| |
DIABLO statistics for newsfeed.yoursite.com on Sat 21 Sep 2024 |
Generated on 20240921 2358 by feeder-stats v4.006. Copyright © 2002 The Diablo Project.
Diablo running processes:  81    Dnewslink running processes:  0


11:59PM  up 216 days,  7:18, 0 users, load averages: 1.22, 0.69, 0.58

Filesystem     Size    Used   Avail Capacity  Mounted on
/dev/da0s1g     94G    1.2G     85G     1%    /news
/dev/da1       7.3T    5.8T    934G    86%    /news2/spool/news/00
/dev/da2       7.3T    5.8T    937G    86%    /news2/spool/news/01
/dev/da3       3.7T    3.3T     65G    98%    /news2/spool/news/02
/dev/da4       5.5T    2.9T    2.1T    58%    /news2/spool/news/03
/dev/da8       7.3T    5.8T    936G    86%    /news2/spool/news/04
/dev/da9       7.3T    5.8T    934G    86%    /news2/spool/news/05
/dev/da10      7.3T    5.8T    936G    86%    /news2/spool/news/06
/dev/da11      5.5T      5T     63G    99%    /news2/spool/news/07
/dev/da12      5.5T    4.3T    740G    86%    /news2/spool/news/08
/dev/da13      7.3T    5.8T    934G    86%    /news2/spool/news/09
/dev/da14      7.3T    5.8T    934G    86%    /news2/spool/news/10
/dev/da15      7.3T    5.8T    935G    86%    /news2/spool/news/11
/dev/da16      7.3T    5.8T    932G    86%    /news2/spool/news/12
/dev/da17      7.3T    5.8T    935G    86%    /news2/spool/news/13
/dev/da18      7.3T    5.8T    937G    86%    /news2/spool/news/14
/dev/da19      7.3T    5.8T    938G    86%    /news2/spool/news/15
/dev/da20      7.3T    5.8T    934G    86%    /news2/spool/news/16
/dev/da21      7.3T    5.8T    935G    86%    /news2/spool/news/17
/dev/da22      7.3T    5.8T    936G    86%    /news2/spool/news/18
/dev/da23      7.3T    5.8T    933G    86%    /news2/spool/news/19
/dev/da24      7.3T    5.8T    933G    86%    /news2/spool/news/20
/dev/da25      7.3T    5.8T    936G    86%    /news2/spool/news/21
/dev/da26      7.3T    5.8T    936G    86%    /news2/spool/news/22
/dev/da5       221G     34G    169G    17%    /news1
/dev/md0        40G     12G     23G    36%    /news3
| Incoming Feed (+ Top1000 #) | Accepted | %Acc | %Tot | Art/sec | Volume | %Vol | KB/art | Check | Ihave | Spam | TooOld | Rejs | Errs | ||
|---|---|---|---|---|---|---|---|---|---|---|---|---|---|---|---|
| 1 | feeder.ecngs.de | 5686409 | 87.91 | 92.50 | 65.81 | 3.78TB | 99.90 | 713.90 | 6468567 | 0 | 0 | 0 | 184 | 0 | |
| 2 | feeder2.ecngs.de | 460803 | 58.73 | 7.50 | 5.35 | 3.95GB | 0.10 | 9.00 | 784394 | 0 | 0 | 0 | 195 | 0 | |
| Total | 6147212 | 0.00 | 100.00 | 71.17 | 3.78TB | 100.00 | 661.06 | 7252961 | 0 | 0 | 0 | 379 | 0 | ||
 |
| Incoming Feed (+ Top1000 #) | Volume | %Vol | Kbps | Accepted | %Acc | %Tot | KB/art | Check | Ihave | Spam | TooOld | Rejs | Errs | ||
|---|---|---|---|---|---|---|---|---|---|---|---|---|---|---|---|
| 1 | feeder.ecngs.de | 3.78TB | 99.90 | 375881.88 | 5686409 | 87.91 | 92.50 | 713.90 | 6468567 | 0 | 0 | 0 | 184 | 0 | |
| 2 | feeder2.ecngs.de | 3.95GB | 0.10 | 385.25 | 460803 | 58.73 | 7.50 | 9.00 | 784394 | 0 | 0 | 0 | 195 | 0 | |
| Total | 3.78TB | 100.00 | 376267.14 | 6147212 | 0.00 | 100.00 | 661.06 | 7252961 | 0 | 0 | 0 | 379 | 0 | ||
 |
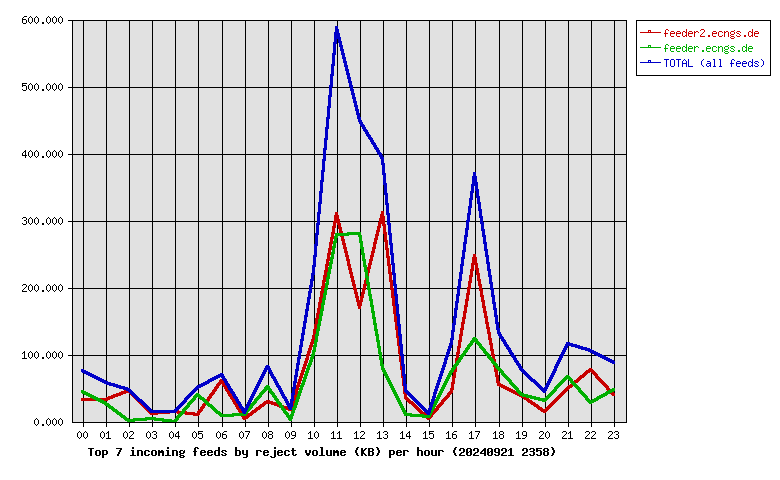
| Incoming Feed (+ Top1000 #) | Rej. Vol. | %Vol | Kbps | Accepted | %Acc | %Tot | KB/art | Check | Ihave | Spam | TooOld | Rejs | Errs | ||
|---|---|---|---|---|---|---|---|---|---|---|---|---|---|---|---|
| 1 | feeder2.ecngs.de | 1.73MB | 55.35 | 0.16 | 460803 | 58.73 | 7.50 | 9.00 | 784394 | 0 | 0 | 0 | 195 | 0 | |
| 2 | feeder.ecngs.de | 1.39MB | 44.65 | 0.13 | 5686409 | 87.91 | 92.50 | 713.90 | 6468567 | 0 | 0 | 0 | 184 | 0 | |
| Total | 3.12MB | 100.00 | 0.30 | 6147212 | 0.00 | 100.00 | 661.06 | 7252961 | 0 | 0 | 0 | 379 | 0 | ||
 |
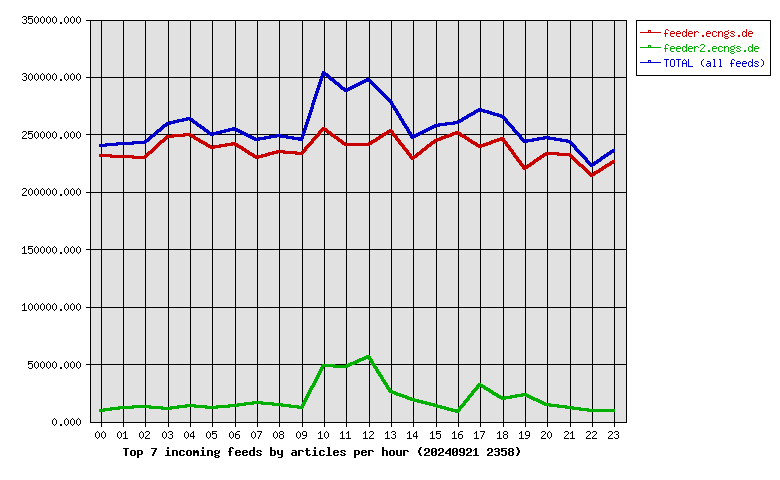
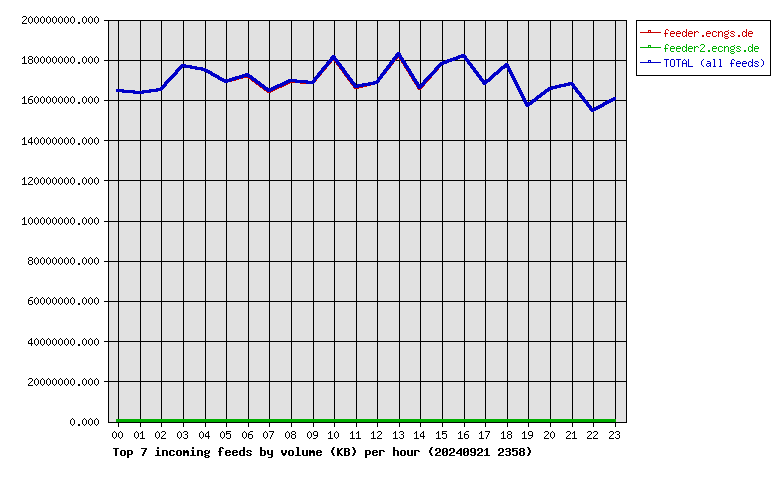
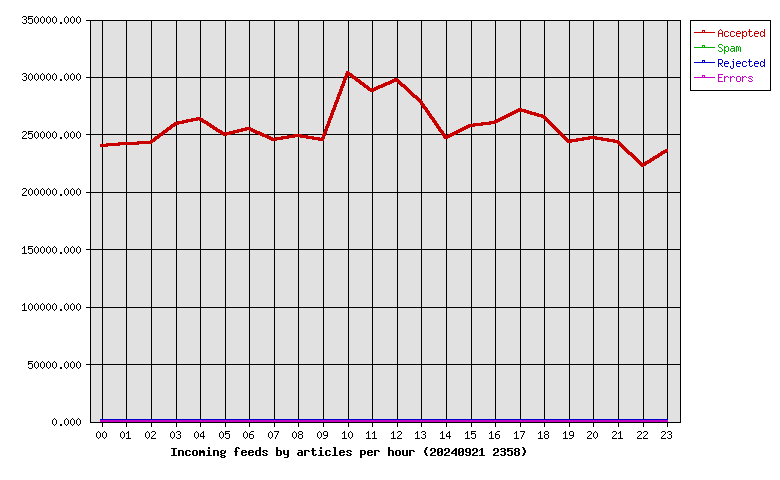
| Hour | Accepted | %Acc | Volume | %Vol | Check | Ihave | Spam | Rejs | Errs |
|---|---|---|---|---|---|---|---|---|---|
| 00 | 240240 | 3.91 | 156.89GB | 4.05 | 280672 | 0 | 0 | 9 | 0 |
| 01 | 241506 | 3.93 | 156.07GB | 4.03 | 289704 | 0 | 0 | 3 | 0 |
| 02 | 242181 | 3.94 | 157.42GB | 4.06 | 289610 | 0 | 0 | 3 | 0 |
| 03 | 258723 | 4.21 | 168.74GB | 4.35 | 304404 | 0 | 0 | 8 | 0 |
| 04 | 263099 | 4.28 | 166.85GB | 4.31 | 308326 | 0 | 0 | 2 | 0 |
| 05 | 249523 | 4.06 | 160.96GB | 4.15 | 315314 | 0 | 0 | 7 | 0 |
| 06 | 254978 | 4.15 | 164.23GB | 4.24 | 301837 | 0 | 0 | 7 | 0 |
| 07 | 245286 | 3.99 | 156.63GB | 4.04 | 300083 | 0 | 0 | 3 | 0 |
| 08 | 249002 | 4.05 | 161.39GB | 4.16 | 305790 | 0 | 0 | 10 | 0 |
| 09 | 244941 | 3.98 | 160.76GB | 4.15 | 293495 | 0 | 0 | 2 | 0 |
| 10 | 303125 | 4.93 | 172.97GB | 4.46 | 386483 | 0 | 0 | 22 | 0 |
| 11 | 287942 | 4.68 | 158.87GB | 4.10 | 383787 | 0 | 0 | 63 | 0 |
| 12 | 297154 | 4.83 | 160.82GB | 4.15 | 393033 | 0 | 0 | 68 | 0 |
| 13 | 278058 | 4.52 | 174.16GB | 4.49 | 338684 | 0 | 0 | 26 | 0 |
| 14 | 246903 | 4.02 | 158.02GB | 4.08 | 305914 | 0 | 0 | 6 | 0 |
| 15 | 256994 | 4.18 | 169.57GB | 4.38 | 315818 | 0 | 0 | 5 | 0 |
| 16 | 259495 | 4.22 | 173.35GB | 4.47 | 270184 | 0 | 0 | 8 | 0 |
| 17 | 271177 | 4.41 | 160.16GB | 4.13 | 308316 | 0 | 0 | 55 | 0 |
| 18 | 265418 | 4.32 | 169.27GB | 4.37 | 289042 | 0 | 0 | 9 | 0 |
| 19 | 243161 | 3.96 | 149.64GB | 3.86 | 272065 | 0 | 0 | 19 | 0 |
| 20 | 246995 | 4.02 | 157.81GB | 4.07 | 263479 | 0 | 0 | 10 | 0 |
| 21 | 243134 | 3.96 | 160.17GB | 4.13 | 256616 | 0 | 0 | 13 | 0 |
| 22 | 222835 | 3.62 | 147.50GB | 3.81 | 233456 | 0 | 0 | 12 | 0 |
| 23 | 235342 | 3.83 | 153.17GB | 3.95 | 246849 | 0 | 0 | 9 | 0 |
| Total | 6147212 | 100.00 | 3.78TB | 100.00 | 7252961 | 0 | 0 | 379 | 0 |
 |
| Outgoing Feed (+ Top1000 #) | Accepted | %Acc | %Tot | Art/sec | Volume | %Vol | KB/art | Dups | Rejs | % Ratio (Out/In) | ||
|---|---|---|---|---|---|---|---|---|---|---|---|---|
| 1 | 217.73.144.40 | 0 | 0.00 | 0.00 | 0.00 | 0.00KB | 0.00 | 0.00 | 6222143 | 0 | … | |
| Total | 0 | 0.00 | 0.00 | 0.00 | 0.00KB | 0.00 | 0.00 | 6222143 | 0 | |||
 |
| Outgoing Feed (+ Top1000 #) | Volume | %Vol | Kbps | Accepted | %Acc | %Tot | KB/art | Dups | Rejs | % Ratio (Out/In) | ||
|---|---|---|---|---|---|---|---|---|---|---|---|---|
| 1 | 217.73.144.40 | 0.00KB | 0.00 | 0.00 | 0 | 0.00 | 0.00 | 0.00 | 6222143 | 0 | … | |
| Total | 0.00KB | 0.00 | 0.00 | 0 | 0.00 | 0.00 | 0.00 | 6222143 | 0 | |||
 |
| Outgoing Feed (+ Top1000 #) | Rej. Vol. | %Vol | Kbps | Accepted | %Acc | %Tot | KB/art | Dups | Rejs | % Ratio (Out/In) | ||
|---|---|---|---|---|---|---|---|---|---|---|---|---|
| 1 | 217.73.144.40 | 0.00KB | 0.00 | 0.00 | 0 | 0.00 | 0.00 | 0.00 | 6222143 | 0 | … | |
| Total | 0.00KB | 0.00 | 0.00 | 0 | 0.00 | 0.00 | 0.00 | 6222143 | 0 | |||
 |
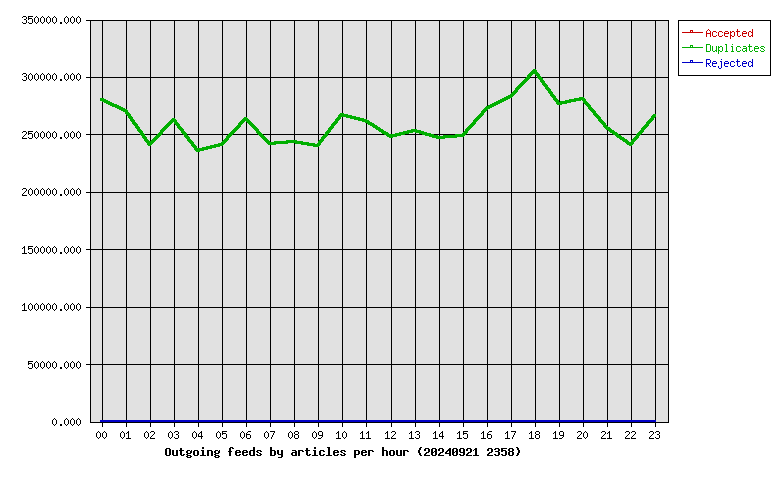
| Hour | Accepted | %Acc | Volume | %Vol | dups | Rejs |
|---|---|---|---|---|---|---|
| 00 | 0 | 0.00 | 0.00KB | 0.00 | 280266 | 0 |
| 01 | 0 | 0.00 | 0.00KB | 0.00 | 270668 | 0 |
| 02 | 0 | 0.00 | 0.00KB | 0.00 | 240446 | 0 |
| 03 | 0 | 0.00 | 0.00KB | 0.00 | 262849 | 0 |
| 04 | 0 | 0.00 | 0.00KB | 0.00 | 235904 | 0 |
| 05 | 0 | 0.00 | 0.00KB | 0.00 | 241079 | 0 |
| 06 | 0 | 0.00 | 0.00KB | 0.00 | 263090 | 0 |
| 07 | 0 | 0.00 | 0.00KB | 0.00 | 241983 | 0 |
| 08 | 0 | 0.00 | 0.00KB | 0.00 | 243449 | 0 |
| 09 | 0 | 0.00 | 0.00KB | 0.00 | 239730 | 0 |
| 10 | 0 | 0.00 | 0.00KB | 0.00 | 266518 | 0 |
| 11 | 0 | 0.00 | 0.00KB | 0.00 | 261496 | 0 |
| 12 | 0 | 0.00 | 0.00KB | 0.00 | 247288 | 0 |
| 13 | 0 | 0.00 | 0.00KB | 0.00 | 252718 | 0 |
| 14 | 0 | 0.00 | 0.00KB | 0.00 | 247227 | 0 |
| 15 | 0 | 0.00 | 0.00KB | 0.00 | 248422 | 0 |
| 16 | 0 | 0.00 | 0.00KB | 0.00 | 271942 | 0 |
| 17 | 0 | 0.00 | 0.00KB | 0.00 | 282220 | 0 |
| 18 | 0 | 0.00 | 0.00KB | 0.00 | 305178 | 0 |
| 19 | 0 | 0.00 | 0.00KB | 0.00 | 276402 | 0 |
| 20 | 0 | 0.00 | 0.00KB | 0.00 | 281117 | 0 |
| 21 | 0 | 0.00 | 0.00KB | 0.00 | 255726 | 0 |
| 22 | 0 | 0.00 | 0.00KB | 0.00 | 240356 | 0 |
| 23 | 0 | 0.00 | 0.00KB | 0.00 | 266069 | 0 |
| Total | 0 | 0.00 | 0.00KB | 0.00 | 6222143 | 0 |
 |
| >= 20% Full | >= 35% Full | >= 50% Full | >= 65% Full | >= 80% Full | >= 95% Full |
| Outgoing Feed | Batch Seq | Batch Num | Batch Max | %Full | Av. Pending |
|---|---|---|---|---|---|
| nbr.elbracht.net-o | 988927-989008 | 81 | 500 | 16 | 0.0 |
| text-spool-out | 0-0 | 0 | 500 | 0 | 0.0 |
| 1st Time | Last Time | # Msgs | Message |
|---|---|---|---|
| 22:05:03 | 1 | DNS Fwd/Rev mismatch: visit.keznews.com/194.165.16.72 | |
| 17:19:41 | 1 | DNS Fwd/Rev mismatch: lookup of scanner-25.ch1.censys-scanner.com failed |