| |
DIABLO statistics for newsfeed.yoursite.com on Fri 20 Sep 2024 |
Generated on 20240920 2358 by feeder-stats v4.006. Copyright © 2002 The Diablo Project.
Diablo running processes:  81    Dnewslink running processes:  0


11:59PM  up 215 days,  7:18, 0 users, load averages: 1.75, 1.03, 0.72

Filesystem     Size    Used   Avail Capacity  Mounted on
/dev/da0s1g     94G    1.2G     85G     1%    /news
/dev/da1       7.3T    5.8T    942G    86%    /news2/spool/news/00
/dev/da2       7.3T    5.8T    944G    86%    /news2/spool/news/01
/dev/da3       3.7T    3.3T     64G    98%    /news2/spool/news/02
/dev/da4       5.5T    2.9T    2.1T    58%    /news2/spool/news/03
/dev/da8       7.3T    5.8T    943G    86%    /news2/spool/news/04
/dev/da9       7.3T    5.8T    941G    86%    /news2/spool/news/05
/dev/da10      7.3T    5.8T    942G    86%    /news2/spool/news/06
/dev/da11      5.5T      5T     64G    99%    /news2/spool/news/07
/dev/da12      5.5T    4.3T    745G    85%    /news2/spool/news/08
/dev/da13      7.3T    5.8T    943G    86%    /news2/spool/news/09
/dev/da14      7.3T    5.8T    942G    86%    /news2/spool/news/10
/dev/da15      7.3T    5.8T    943G    86%    /news2/spool/news/11
/dev/da16      7.3T    5.8T    940G    86%    /news2/spool/news/12
/dev/da17      7.3T    5.8T    942G    86%    /news2/spool/news/13
/dev/da18      7.3T    5.8T    944G    86%    /news2/spool/news/14
/dev/da19      7.3T    5.8T    938G    86%    /news2/spool/news/15
/dev/da20      7.3T    5.8T    942G    86%    /news2/spool/news/16
/dev/da21      7.3T    5.8T    942G    86%    /news2/spool/news/17
/dev/da22      7.3T    5.8T    951G    86%    /news2/spool/news/18
/dev/da23      7.3T    5.8T    941G    86%    /news2/spool/news/19
/dev/da24      7.3T    5.8T    941G    86%    /news2/spool/news/20
/dev/da25      7.3T    5.8T    943G    86%    /news2/spool/news/21
/dev/da26      7.3T    5.8T    943G    86%    /news2/spool/news/22
/dev/da5       221G     34G    169G    17%    /news1
/dev/md0        40G     12G     23G    36%    /news3
| Incoming Feed (+ Top1000 #) | Accepted | %Acc | %Tot | Art/sec | Volume | %Vol | KB/art | Check | Ihave | Spam | TooOld | Rejs | Errs | ||
|---|---|---|---|---|---|---|---|---|---|---|---|---|---|---|---|
| 1 | feeder.ecngs.de | 5744805 | 88.50 | 90.36 | 66.49 | 3.83TB | 99.86 | 716.59 | 6491176 | 0 | 0 | 0 | 365 | 0 | |
| 2 | feeder2.ecngs.de | 613084 | 81.97 | 9.64 | 7.10 | 5.34GB | 0.14 | 9.13 | 747540 | 0 | 0 | 0 | 372 | 0 | |
| Total | 6357889 | 0.00 | 100.00 | 73.59 | 3.84TB | 100.00 | 648.37 | 7238716 | 0 | 0 | 0 | 737 | 0 | ||
 |
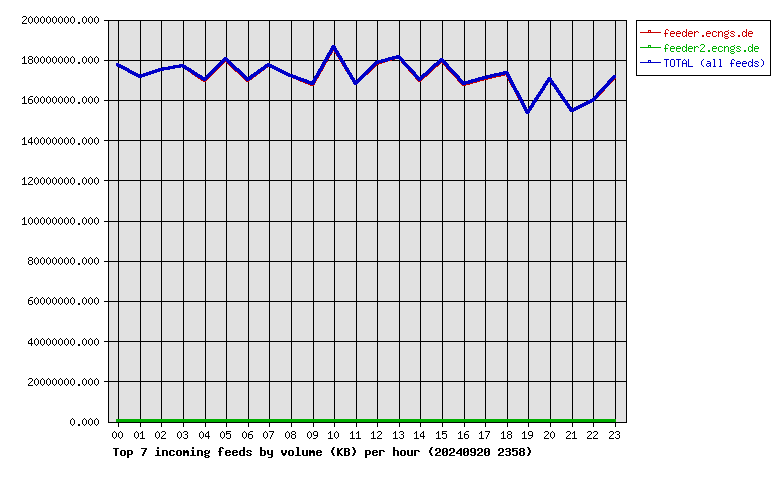
| Incoming Feed (+ Top1000 #) | Volume | %Vol | Kbps | Accepted | %Acc | %Tot | KB/art | Check | Ihave | Spam | TooOld | Rejs | Errs | ||
|---|---|---|---|---|---|---|---|---|---|---|---|---|---|---|---|
| 1 | feeder.ecngs.de | 3.83TB | 99.86 | 381175.10 | 5744805 | 88.50 | 90.36 | 716.59 | 6491176 | 0 | 0 | 0 | 365 | 0 | |
| 2 | feeder2.ecngs.de | 5.34GB | 0.14 | 518.37 | 613084 | 81.97 | 9.64 | 9.13 | 747540 | 0 | 0 | 0 | 372 | 0 | |
| Total | 3.84TB | 100.00 | 381693.47 | 6357889 | 0.00 | 100.00 | 648.37 | 7238716 | 0 | 0 | 0 | 737 | 0 | ||
 |
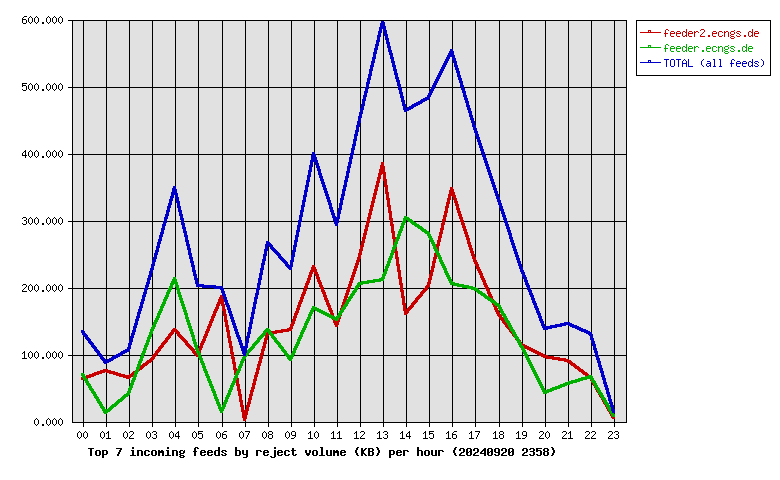
| Incoming Feed (+ Top1000 #) | Rej. Vol. | %Vol | Kbps | Accepted | %Acc | %Tot | KB/art | Check | Ihave | Spam | TooOld | Rejs | Errs | ||
|---|---|---|---|---|---|---|---|---|---|---|---|---|---|---|---|
| 1 | feeder2.ecngs.de | 3.38MB | 52.82 | 0.32 | 613084 | 81.97 | 9.64 | 9.13 | 747540 | 0 | 0 | 0 | 372 | 0 | |
| 2 | feeder.ecngs.de | 3.02MB | 47.18 | 0.29 | 5744805 | 88.50 | 90.36 | 716.59 | 6491176 | 0 | 0 | 0 | 365 | 0 | |
| Total | 6.40MB | 100.00 | 0.61 | 6357889 | 0.00 | 100.00 | 648.37 | 7238716 | 0 | 0 | 0 | 737 | 0 | ||
 |
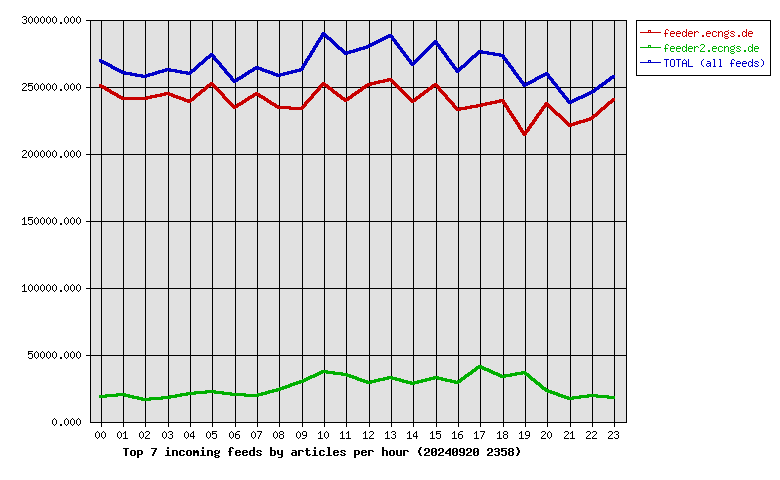
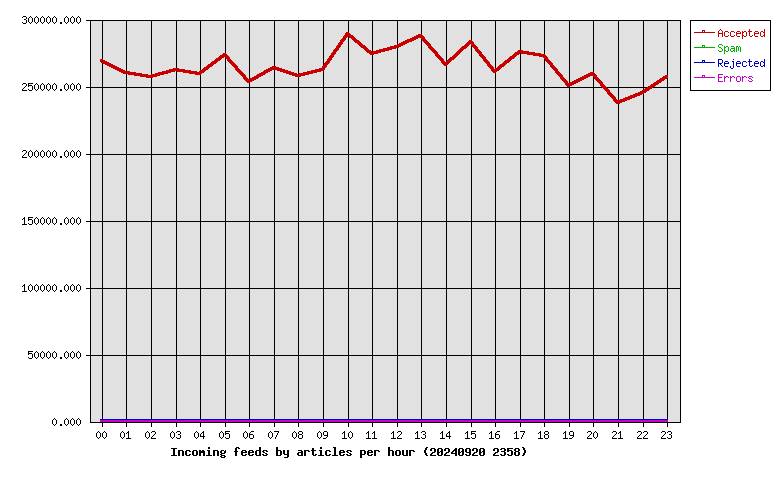
| Hour | Accepted | %Acc | Volume | %Vol | Check | Ihave | Spam | Rejs | Errs |
|---|---|---|---|---|---|---|---|---|---|
| 00 | 268659 | 4.23 | 169.16GB | 4.30 | 289175 | 0 | 0 | 10 | 0 |
| 01 | 260326 | 4.09 | 163.66GB | 4.16 | 282911 | 0 | 0 | 7 | 0 |
| 02 | 256752 | 4.04 | 166.71GB | 4.24 | 278704 | 0 | 0 | 18 | 0 |
| 03 | 262178 | 4.12 | 168.73GB | 4.29 | 285146 | 0 | 0 | 22 | 0 |
| 04 | 259537 | 4.08 | 161.89GB | 4.12 | 289642 | 0 | 0 | 27 | 0 |
| 05 | 273563 | 4.30 | 171.83GB | 4.37 | 315256 | 0 | 0 | 18 | 0 |
| 06 | 253697 | 3.99 | 161.85GB | 4.12 | 277443 | 0 | 0 | 25 | 0 |
| 07 | 263665 | 4.15 | 169.27GB | 4.31 | 285566 | 0 | 0 | 13 | 0 |
| 08 | 257797 | 4.05 | 164.06GB | 4.17 | 284381 | 0 | 0 | 26 | 0 |
| 09 | 262349 | 4.13 | 160.00GB | 4.07 | 295030 | 0 | 0 | 29 | 0 |
| 10 | 289369 | 4.55 | 177.74GB | 4.52 | 332265 | 0 | 0 | 39 | 0 |
| 11 | 274086 | 4.31 | 160.31GB | 4.08 | 316653 | 0 | 0 | 35 | 0 |
| 12 | 279452 | 4.40 | 169.88GB | 4.32 | 311282 | 0 | 0 | 33 | 0 |
| 13 | 287421 | 4.52 | 173.08GB | 4.40 | 325739 | 0 | 0 | 70 | 0 |
| 14 | 266376 | 4.19 | 161.80GB | 4.12 | 301158 | 0 | 0 | 67 | 0 |
| 15 | 283510 | 4.46 | 171.48GB | 4.36 | 321021 | 0 | 0 | 54 | 0 |
| 16 | 260903 | 4.10 | 160.02GB | 4.07 | 294284 | 0 | 0 | 54 | 0 |
| 17 | 276114 | 4.34 | 162.83GB | 4.14 | 321882 | 0 | 0 | 59 | 0 |
| 18 | 272806 | 4.29 | 165.21GB | 4.20 | 312472 | 0 | 0 | 41 | 0 |
| 19 | 250024 | 3.93 | 146.44GB | 3.73 | 293640 | 0 | 0 | 44 | 0 |
| 20 | 259679 | 4.08 | 162.63GB | 4.14 | 307745 | 0 | 0 | 16 | 0 |
| 21 | 237505 | 3.74 | 147.46GB | 3.75 | 277736 | 0 | 0 | 11 | 0 |
| 22 | 244996 | 3.85 | 152.02GB | 3.87 | 291999 | 0 | 0 | 15 | 0 |
| 23 | 257125 | 4.04 | 163.24GB | 4.15 | 347586 | 0 | 0 | 4 | 0 |
| Total | 6357889 | 100.00 | 3.84TB | 100.00 | 7238716 | 0 | 0 | 737 | 0 |
 |
| Outgoing Feed (+ Top1000 #) | Accepted | %Acc | %Tot | Art/sec | Volume | %Vol | KB/art | Dups | Rejs | % Ratio (Out/In) | ||
|---|---|---|---|---|---|---|---|---|---|---|---|---|
| 1 | 217.73.144.40 | 0 | 0.00 | 0.00 | 0.00 | 0.00KB | 0.00 | 0.00 | 6430499 | 0 | … | |
| Total | 0 | 0.00 | 0.00 | 0.00 | 0.00KB | 0.00 | 0.00 | 6430499 | 0 | |||
 |
| Outgoing Feed (+ Top1000 #) | Volume | %Vol | Kbps | Accepted | %Acc | %Tot | KB/art | Dups | Rejs | % Ratio (Out/In) | ||
|---|---|---|---|---|---|---|---|---|---|---|---|---|
| 1 | 217.73.144.40 | 0.00KB | 0.00 | 0.00 | 0 | 0.00 | 0.00 | 0.00 | 6430499 | 0 | … | |
| Total | 0.00KB | 0.00 | 0.00 | 0 | 0.00 | 0.00 | 0.00 | 6430499 | 0 | |||
 |
| Outgoing Feed (+ Top1000 #) | Rej. Vol. | %Vol | Kbps | Accepted | %Acc | %Tot | KB/art | Dups | Rejs | % Ratio (Out/In) | ||
|---|---|---|---|---|---|---|---|---|---|---|---|---|
| 1 | 217.73.144.40 | 0.00KB | 0.00 | 0.00 | 0 | 0.00 | 0.00 | 0.00 | 6430499 | 0 | … | |
| Total | 0.00KB | 0.00 | 0.00 | 0 | 0.00 | 0.00 | 0.00 | 6430499 | 0 | |||
 |
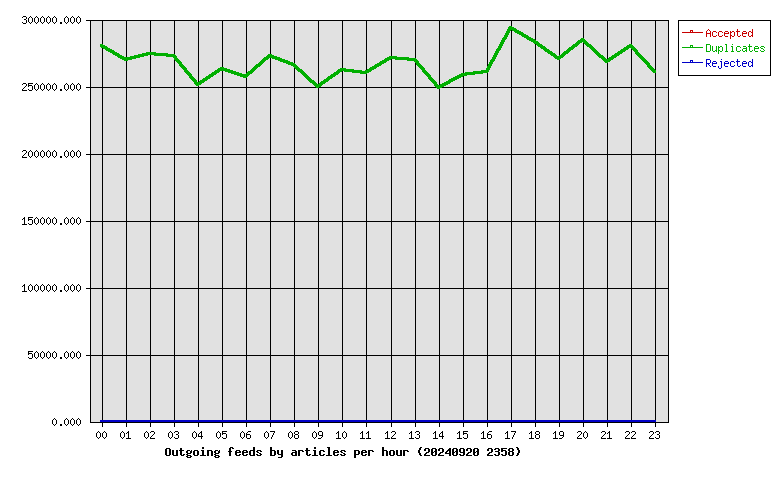
| Hour | Accepted | %Acc | Volume | %Vol | dups | Rejs |
|---|---|---|---|---|---|---|
| 00 | 0 | 0.00 | 0.00KB | 0.00 | 280350 | 0 |
| 01 | 0 | 0.00 | 0.00KB | 0.00 | 269522 | 0 |
| 02 | 0 | 0.00 | 0.00KB | 0.00 | 273906 | 0 |
| 03 | 0 | 0.00 | 0.00KB | 0.00 | 272806 | 0 |
| 04 | 0 | 0.00 | 0.00KB | 0.00 | 250954 | 0 |
| 05 | 0 | 0.00 | 0.00KB | 0.00 | 262785 | 0 |
| 06 | 0 | 0.00 | 0.00KB | 0.00 | 257405 | 0 |
| 07 | 0 | 0.00 | 0.00KB | 0.00 | 272704 | 0 |
| 08 | 0 | 0.00 | 0.00KB | 0.00 | 266209 | 0 |
| 09 | 0 | 0.00 | 0.00KB | 0.00 | 249960 | 0 |
| 10 | 0 | 0.00 | 0.00KB | 0.00 | 261968 | 0 |
| 11 | 0 | 0.00 | 0.00KB | 0.00 | 260255 | 0 |
| 12 | 0 | 0.00 | 0.00KB | 0.00 | 270934 | 0 |
| 13 | 0 | 0.00 | 0.00KB | 0.00 | 269658 | 0 |
| 14 | 0 | 0.00 | 0.00KB | 0.00 | 249094 | 0 |
| 15 | 0 | 0.00 | 0.00KB | 0.00 | 258745 | 0 |
| 16 | 0 | 0.00 | 0.00KB | 0.00 | 261085 | 0 |
| 17 | 0 | 0.00 | 0.00KB | 0.00 | 293974 | 0 |
| 18 | 0 | 0.00 | 0.00KB | 0.00 | 283483 | 0 |
| 19 | 0 | 0.00 | 0.00KB | 0.00 | 270198 | 0 |
| 20 | 0 | 0.00 | 0.00KB | 0.00 | 285017 | 0 |
| 21 | 0 | 0.00 | 0.00KB | 0.00 | 268532 | 0 |
| 22 | 0 | 0.00 | 0.00KB | 0.00 | 280139 | 0 |
| 23 | 0 | 0.00 | 0.00KB | 0.00 | 260816 | 0 |
| Total | 0 | 0.00 | 0.00KB | 0.00 | 6430499 | 0 |
 |
| >= 20% Full | >= 35% Full | >= 50% Full | >= 65% Full | >= 80% Full | >= 95% Full |
| Outgoing Feed | Batch Seq | Batch Num | Batch Max | %Full | Av. Pending |
|---|---|---|---|---|---|
| nbr.elbracht.net-o | 988639-988720 | 81 | 500 | 16 | 0.0 |
| text-spool-out | 0-0 | 0 | 500 | 0 | 0.0 |
| 1st Time | Last Time | # Msgs | Message |
|---|---|---|---|
| 21:44:44 | 1 | DNS Fwd/Rev mismatch: iodimaxio.com/69.10.48.174 |