| |
DIABLO statistics for newsfeed.yoursite.com on Thu 19 Sep 2024 |
Generated on 20240919 2358 by feeder-stats v4.006. Copyright © 2002 The Diablo Project.
Diablo running processes:  81    Dnewslink running processes:  0


11:59PM  up 214 days,  7:18, 0 users, load averages: 1.33, 0.98, 0.76

Filesystem     Size    Used   Avail Capacity  Mounted on
/dev/da0s1g     94G    1.2G     85G     1%    /news
/dev/da1       7.3T    5.8T    946G    86%    /news2/spool/news/00
/dev/da2       7.3T    5.8T    949G    86%    /news2/spool/news/01
/dev/da3       3.7T    3.3T     67G    98%    /news2/spool/news/02
/dev/da4       5.5T    2.9T    2.1T    57%    /news2/spool/news/03
/dev/da8       7.3T    5.8T    947G    86%    /news2/spool/news/04
/dev/da9       7.3T    5.8T    946G    86%    /news2/spool/news/05
/dev/da10      7.3T    5.8T    947G    86%    /news2/spool/news/06
/dev/da11      5.5T      5T     67G    99%    /news2/spool/news/07
/dev/da12      5.5T    4.3T    748G    85%    /news2/spool/news/08
/dev/da13      7.3T    5.8T    948G    86%    /news2/spool/news/09
/dev/da14      7.3T    5.8T    947G    86%    /news2/spool/news/10
/dev/da15      7.3T    5.8T    947G    86%    /news2/spool/news/11
/dev/da16      7.3T    5.8T    945G    86%    /news2/spool/news/12
/dev/da17      7.3T    5.8T    947G    86%    /news2/spool/news/13
/dev/da18      7.3T    5.8T    948G    86%    /news2/spool/news/14
/dev/da19      7.3T    5.8T    943G    86%    /news2/spool/news/15
/dev/da20      7.3T    5.8T    947G    86%    /news2/spool/news/16
/dev/da21      7.3T    5.8T    947G    86%    /news2/spool/news/17
/dev/da22      7.3T    5.8T    949G    86%    /news2/spool/news/18
/dev/da23      7.3T    5.8T    946G    86%    /news2/spool/news/19
/dev/da24      7.3T    5.8T    953G    86%    /news2/spool/news/20
/dev/da25      7.3T    5.8T    948G    86%    /news2/spool/news/21
/dev/da26      7.3T    5.8T    947G    86%    /news2/spool/news/22
/dev/da5       221G     34G    169G    17%    /news1
/dev/md0        40G     12G     23G    36%    /news3
| Incoming Feed (+ Top1000 #) | Accepted | %Acc | %Tot | Art/sec | Volume | %Vol | KB/art | Check | Ihave | Spam | TooOld | Rejs | Errs | ||
|---|---|---|---|---|---|---|---|---|---|---|---|---|---|---|---|
| 1 | feeder.ecngs.de | 5762753 | 89.87 | 90.68 | 66.70 | 3.79TB | 99.86 | 705.29 | 6411902 | 0 | 0 | 0 | 296 | 0 | |
| 2 | feeder2.ecngs.de | 592096 | 90.15 | 9.32 | 6.85 | 5.49GB | 0.14 | 9.72 | 656484 | 0 | 0 | 0 | 339 | 0 | |
| Total | 6354849 | 0.00 | 100.00 | 73.55 | 3.79TB | 100.00 | 640.48 | 7068386 | 0 | 0 | 0 | 635 | 0 | ||
 |
| Incoming Feed (+ Top1000 #) | Volume | %Vol | Kbps | Accepted | %Acc | %Tot | KB/art | Check | Ihave | Spam | TooOld | Rejs | Errs | ||
|---|---|---|---|---|---|---|---|---|---|---|---|---|---|---|---|
| 1 | feeder.ecngs.de | 3.79TB | 99.86 | 376332.24 | 5762753 | 89.87 | 90.68 | 705.29 | 6411902 | 0 | 0 | 0 | 296 | 0 | |
| 2 | feeder2.ecngs.de | 5.49GB | 0.14 | 533.15 | 592096 | 90.15 | 9.32 | 9.72 | 656484 | 0 | 0 | 0 | 339 | 0 | |
| Total | 3.79TB | 100.00 | 376865.39 | 6354849 | 0.00 | 100.00 | 640.48 | 7068386 | 0 | 0 | 0 | 635 | 0 | ||
 |
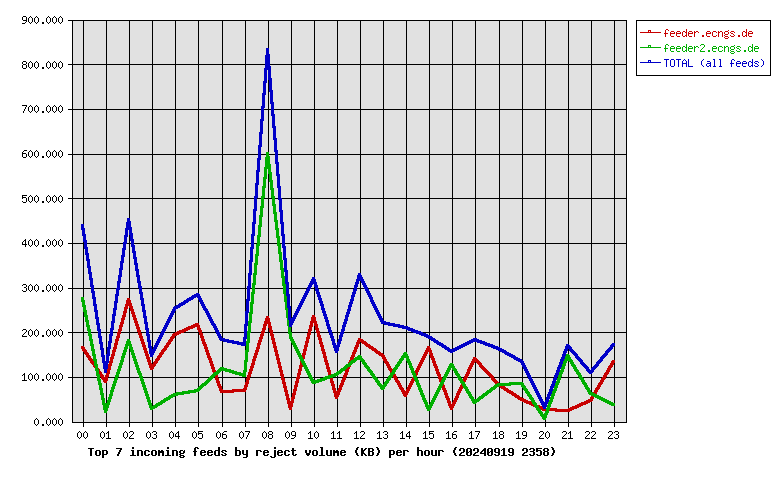
| Incoming Feed (+ Top1000 #) | Rej. Vol. | %Vol | Kbps | Accepted | %Acc | %Tot | KB/art | Check | Ihave | Spam | TooOld | Rejs | Errs | ||
|---|---|---|---|---|---|---|---|---|---|---|---|---|---|---|---|
| 1 | feeder.ecngs.de | 2.75MB | 50.10 | 0.26 | 5762753 | 89.87 | 90.68 | 705.29 | 6411902 | 0 | 0 | 0 | 296 | 0 | |
| 2 | feeder2.ecngs.de | 2.74MB | 49.90 | 0.26 | 592096 | 90.15 | 9.32 | 9.72 | 656484 | 0 | 0 | 0 | 339 | 0 | |
| Total | 5.49MB | 100.00 | 0.52 | 6354849 | 0.00 | 100.00 | 640.48 | 7068386 | 0 | 0 | 0 | 635 | 0 | ||
 |
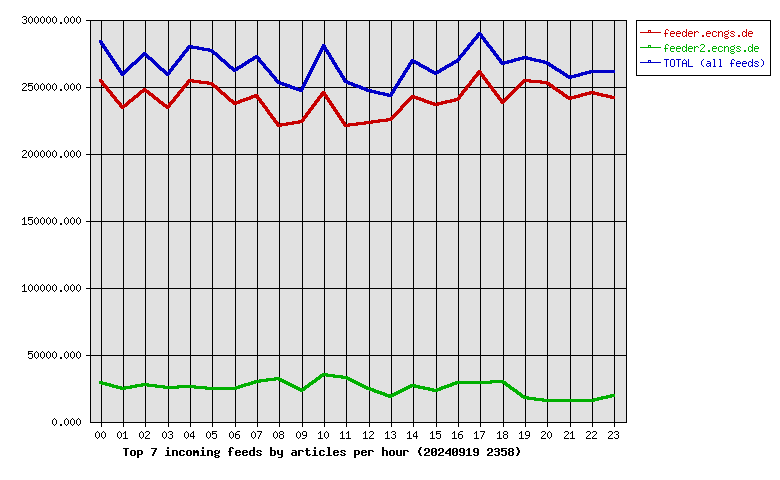
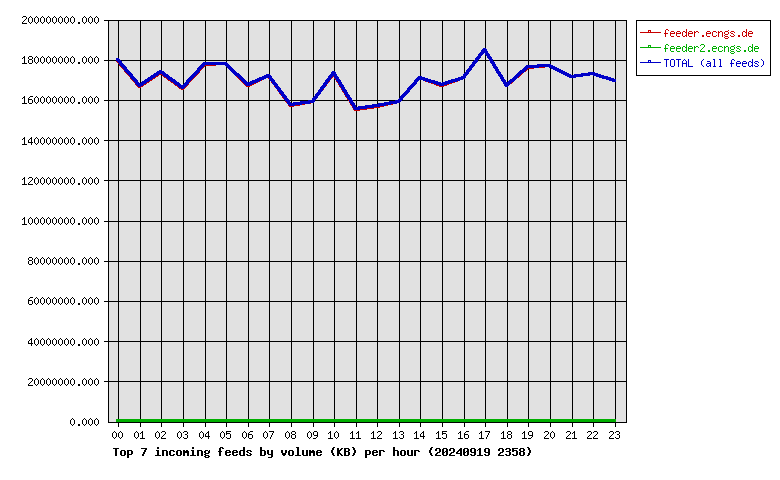
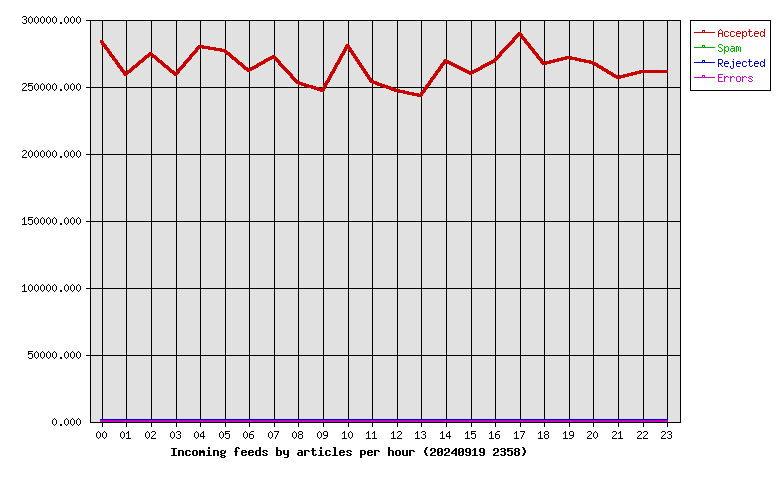
| Hour | Accepted | %Acc | Volume | %Vol | Check | Ihave | Spam | Rejs | Errs |
|---|---|---|---|---|---|---|---|---|---|
| 00 | 282937 | 4.45 | 171.42GB | 4.42 | 313662 | 0 | 0 | 49 | 0 |
| 01 | 258408 | 4.07 | 159.16GB | 4.10 | 294950 | 0 | 0 | 14 | 0 |
| 02 | 274325 | 4.32 | 165.78GB | 4.27 | 310028 | 0 | 0 | 45 | 0 |
| 03 | 258467 | 4.07 | 158.18GB | 4.08 | 284605 | 0 | 0 | 12 | 0 |
| 04 | 279763 | 4.40 | 169.45GB | 4.37 | 313481 | 0 | 0 | 42 | 0 |
| 05 | 276201 | 4.35 | 169.70GB | 4.37 | 319022 | 0 | 0 | 33 | 0 |
| 06 | 261216 | 4.11 | 159.42GB | 4.11 | 289272 | 0 | 0 | 27 | 0 |
| 07 | 271928 | 4.28 | 163.97GB | 4.22 | 304382 | 0 | 0 | 22 | 0 |
| 08 | 252350 | 3.97 | 150.02GB | 3.86 | 289815 | 0 | 0 | 89 | 0 |
| 09 | 246434 | 3.88 | 151.73GB | 3.91 | 272761 | 0 | 0 | 25 | 0 |
| 10 | 279991 | 4.41 | 165.35GB | 4.26 | 320399 | 0 | 0 | 35 | 0 |
| 11 | 253412 | 3.99 | 148.11GB | 3.82 | 290605 | 0 | 0 | 17 | 0 |
| 12 | 246697 | 3.88 | 149.67GB | 3.86 | 275497 | 0 | 0 | 40 | 0 |
| 13 | 243122 | 3.83 | 151.64GB | 3.91 | 265262 | 0 | 0 | 13 | 0 |
| 14 | 268784 | 4.23 | 163.11GB | 4.20 | 298776 | 0 | 0 | 22 | 0 |
| 15 | 259121 | 4.08 | 159.51GB | 4.11 | 286341 | 0 | 0 | 23 | 0 |
| 16 | 268758 | 4.23 | 163.12GB | 4.20 | 302868 | 0 | 0 | 15 | 0 |
| 17 | 289318 | 4.55 | 176.43GB | 4.55 | 321752 | 0 | 0 | 24 | 0 |
| 18 | 266977 | 4.20 | 159.25GB | 4.10 | 300826 | 0 | 0 | 27 | 0 |
| 19 | 271263 | 4.27 | 168.01GB | 4.33 | 292424 | 0 | 0 | 12 | 0 |
| 20 | 267783 | 4.21 | 168.61GB | 4.34 | 285142 | 0 | 0 | 5 | 0 |
| 21 | 256116 | 4.03 | 163.40GB | 4.21 | 274350 | 0 | 0 | 17 | 0 |
| 22 | 260929 | 4.11 | 165.01GB | 4.25 | 278922 | 0 | 0 | 12 | 0 |
| 23 | 260549 | 4.10 | 161.55GB | 4.16 | 283244 | 0 | 0 | 15 | 0 |
| Total | 6354849 | 100.00 | 3.79TB | 100.00 | 7068386 | 0 | 0 | 635 | 0 |
 |
| Outgoing Feed (+ Top1000 #) | Accepted | %Acc | %Tot | Art/sec | Volume | %Vol | KB/art | Dups | Rejs | % Ratio (Out/In) | ||
|---|---|---|---|---|---|---|---|---|---|---|---|---|
| 1 | 217.73.144.40 | 0 | 0.00 | 0.00 | 0.00 | 0.00KB | 0.00 | 0.00 | 6350683 | 0 | … | |
| Total | 0 | 0.00 | 0.00 | 0.00 | 0.00KB | 0.00 | 0.00 | 6350683 | 0 | |||
 |
| Outgoing Feed (+ Top1000 #) | Volume | %Vol | Kbps | Accepted | %Acc | %Tot | KB/art | Dups | Rejs | % Ratio (Out/In) | ||
|---|---|---|---|---|---|---|---|---|---|---|---|---|
| 1 | 217.73.144.40 | 0.00KB | 0.00 | 0.00 | 0 | 0.00 | 0.00 | 0.00 | 6350683 | 0 | … | |
| Total | 0.00KB | 0.00 | 0.00 | 0 | 0.00 | 0.00 | 0.00 | 6350683 | 0 | |||
 |
| Outgoing Feed (+ Top1000 #) | Rej. Vol. | %Vol | Kbps | Accepted | %Acc | %Tot | KB/art | Dups | Rejs | % Ratio (Out/In) | ||
|---|---|---|---|---|---|---|---|---|---|---|---|---|
| 1 | 217.73.144.40 | 0.00KB | 0.00 | 0.00 | 0 | 0.00 | 0.00 | 0.00 | 6350683 | 0 | … | |
| Total | 0.00KB | 0.00 | 0.00 | 0 | 0.00 | 0.00 | 0.00 | 6350683 | 0 | |||
 |
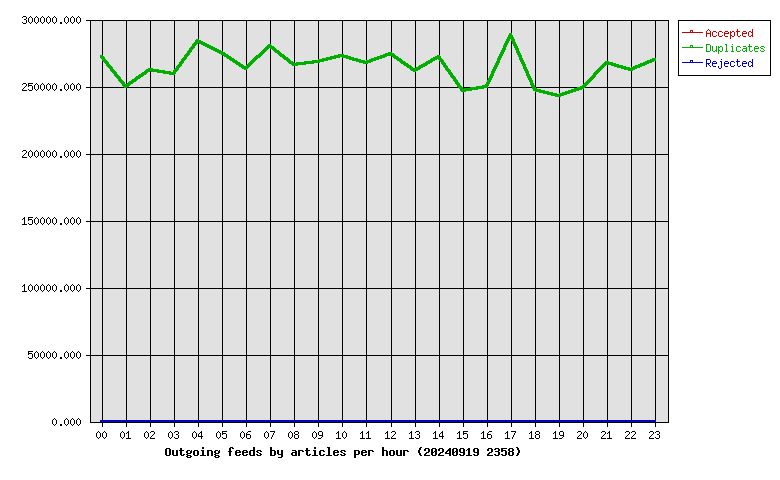
| Hour | Accepted | %Acc | Volume | %Vol | dups | Rejs |
|---|---|---|---|---|---|---|
| 00 | 0 | 0.00 | 0.00KB | 0.00 | 272007 | 0 |
| 01 | 0 | 0.00 | 0.00KB | 0.00 | 249741 | 0 |
| 02 | 0 | 0.00 | 0.00KB | 0.00 | 261941 | 0 |
| 03 | 0 | 0.00 | 0.00KB | 0.00 | 259400 | 0 |
| 04 | 0 | 0.00 | 0.00KB | 0.00 | 283986 | 0 |
| 05 | 0 | 0.00 | 0.00KB | 0.00 | 275058 | 0 |
| 06 | 0 | 0.00 | 0.00KB | 0.00 | 262703 | 0 |
| 07 | 0 | 0.00 | 0.00KB | 0.00 | 280245 | 0 |
| 08 | 0 | 0.00 | 0.00KB | 0.00 | 266132 | 0 |
| 09 | 0 | 0.00 | 0.00KB | 0.00 | 267925 | 0 |
| 10 | 0 | 0.00 | 0.00KB | 0.00 | 272725 | 0 |
| 11 | 0 | 0.00 | 0.00KB | 0.00 | 267727 | 0 |
| 12 | 0 | 0.00 | 0.00KB | 0.00 | 274158 | 0 |
| 13 | 0 | 0.00 | 0.00KB | 0.00 | 261570 | 0 |
| 14 | 0 | 0.00 | 0.00KB | 0.00 | 272177 | 0 |
| 15 | 0 | 0.00 | 0.00KB | 0.00 | 246387 | 0 |
| 16 | 0 | 0.00 | 0.00KB | 0.00 | 249736 | 0 |
| 17 | 0 | 0.00 | 0.00KB | 0.00 | 288173 | 0 |
| 18 | 0 | 0.00 | 0.00KB | 0.00 | 247164 | 0 |
| 19 | 0 | 0.00 | 0.00KB | 0.00 | 243231 | 0 |
| 20 | 0 | 0.00 | 0.00KB | 0.00 | 248766 | 0 |
| 21 | 0 | 0.00 | 0.00KB | 0.00 | 267702 | 0 |
| 22 | 0 | 0.00 | 0.00KB | 0.00 | 261942 | 0 |
| 23 | 0 | 0.00 | 0.00KB | 0.00 | 270087 | 0 |
| Total | 0 | 0.00 | 0.00KB | 0.00 | 6350683 | 0 |
 |
| >= 20% Full | >= 35% Full | >= 50% Full | >= 65% Full | >= 80% Full | >= 95% Full |
| Outgoing Feed | Batch Seq | Batch Num | Batch Max | %Full | Av. Pending |
|---|---|---|---|---|---|
| nbr.elbracht.net-o | 988351-988432 | 81 | 500 | 16 | 0.0 |
| text-spool-out | 0-0 | 0 | 500 | 0 | 0.0 |
| 1st Time | Last Time | # Msgs | Message |
|---|---|---|---|
| 17:34:05 | 17:34:18 | 5 | DNS Fwd/Rev mismatch: lookup of scanner-07.ch1.censys-scanner.com failed |
| 22:40:03 | 22:40:12 | 3 | DNS Fwd/Rev mismatch: lookup of scanner-25.ch1.censys-scanner.com failed |
| 12:51:30 | 1 | DNS Fwd/Rev mismatch: host-by.safe-vpn.mobi/179.60.149.238 |