| |
DIABLO statistics for newsfeed.yoursite.com on Wed 18 Sep 2024 |
Generated on 20240918 2358 by feeder-stats v4.006. Copyright © 2002 The Diablo Project.
Diablo running processes:  81    Dnewslink running processes:  0


11:59PM  up 213 days,  7:18, 0 users, load averages: 1.21, 1.01, 0.78

Filesystem     Size    Used   Avail Capacity  Mounted on
/dev/da0s1g     94G    1.2G     85G     1%    /news
/dev/da1       7.3T    5.8T    945G    86%    /news2/spool/news/00
/dev/da2       7.3T    5.8T    948G    86%    /news2/spool/news/01
/dev/da3       3.7T    3.3T     63G    98%    /news2/spool/news/02
/dev/da4       5.5T    2.9T    2.1T    57%    /news2/spool/news/03
/dev/da8       7.3T    5.8T    946G    86%    /news2/spool/news/04
/dev/da9       7.3T    5.8T    945G    86%    /news2/spool/news/05
/dev/da10      7.3T    5.8T    946G    86%    /news2/spool/news/06
/dev/da11      5.5T      5T     65G    99%    /news2/spool/news/07
/dev/da12      5.5T    4.3T    747G    85%    /news2/spool/news/08
/dev/da13      7.3T    5.8T    947G    86%    /news2/spool/news/09
/dev/da14      7.3T    5.8T    946G    86%    /news2/spool/news/10
/dev/da15      7.3T    5.8T    946G    86%    /news2/spool/news/11
/dev/da16      7.3T    5.8T    944G    86%    /news2/spool/news/12
/dev/da17      7.3T    5.8T    946G    86%    /news2/spool/news/13
/dev/da18      7.3T    5.8T    947G    86%    /news2/spool/news/14
/dev/da19      7.3T    5.8T    948G    86%    /news2/spool/news/15
/dev/da20      7.3T    5.8T    946G    86%    /news2/spool/news/16
/dev/da21      7.3T    5.8T    946G    86%    /news2/spool/news/17
/dev/da22      7.3T    5.8T    948G    86%    /news2/spool/news/18
/dev/da23      7.3T    5.8T    946G    86%    /news2/spool/news/19
/dev/da24      7.3T    5.8T    945G    86%    /news2/spool/news/20
/dev/da25      7.3T    5.8T    947G    86%    /news2/spool/news/21
/dev/da26      7.3T    5.8T    946G    86%    /news2/spool/news/22
/dev/da5       221G     34G    169G    17%    /news1
/dev/md0        40G     12G     23G    36%    /news3
| Incoming Feed (+ Top1000 #) | Accepted | %Acc | %Tot | Art/sec | Volume | %Vol | KB/art | Check | Ihave | Spam | TooOld | Rejs | Errs | ||
|---|---|---|---|---|---|---|---|---|---|---|---|---|---|---|---|
| 1 | feeder.ecngs.de | 5625137 | 89.94 | 90.79 | 65.11 | 3.72TB | 99.87 | 710.91 | 6253805 | 0 | 0 | 0 | 434 | 0 | |
| 2 | feeder2.ecngs.de | 570479 | 88.73 | 9.21 | 6.64 | 4.93GB | 0.13 | 9.07 | 642499 | 0 | 0 | 0 | 440 | 0 | |
| Total | 6195616 | 0.00 | 100.00 | 71.74 | 3.73TB | 100.00 | 646.28 | 6896304 | 0 | 0 | 0 | 874 | 0 | ||
 |
| Incoming Feed (+ Top1000 #) | Volume | %Vol | Kbps | Accepted | %Acc | %Tot | KB/art | Check | Ihave | Spam | TooOld | Rejs | Errs | ||
|---|---|---|---|---|---|---|---|---|---|---|---|---|---|---|---|
| 1 | feeder.ecngs.de | 3.72TB | 99.87 | 370272.91 | 5625137 | 89.94 | 90.79 | 710.91 | 6253805 | 0 | 0 | 0 | 434 | 0 | |
| 2 | feeder2.ecngs.de | 4.93GB | 0.13 | 481.46 | 570479 | 88.73 | 9.21 | 9.07 | 642499 | 0 | 0 | 0 | 440 | 0 | |
| Total | 3.73TB | 100.00 | 370754.37 | 6195616 | 0.00 | 100.00 | 646.28 | 6896304 | 0 | 0 | 0 | 874 | 0 | ||
 |
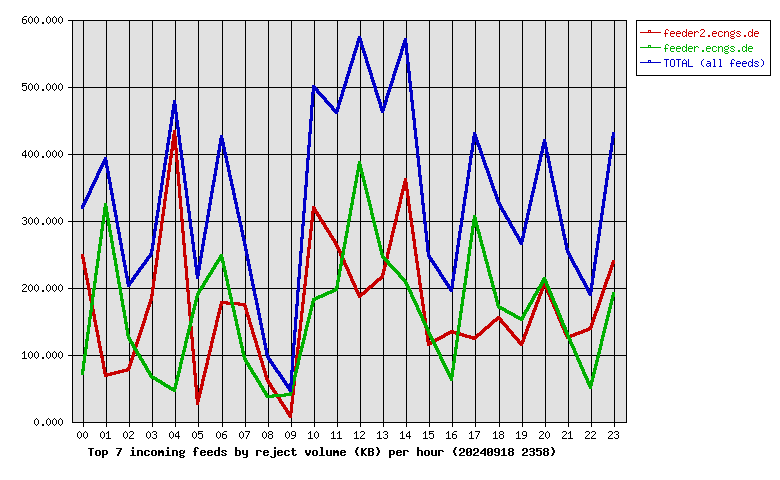
| Incoming Feed (+ Top1000 #) | Rej. Vol. | %Vol | Kbps | Accepted | %Acc | %Tot | KB/art | Check | Ihave | Spam | TooOld | Rejs | Errs | ||
|---|---|---|---|---|---|---|---|---|---|---|---|---|---|---|---|
| 1 | feeder2.ecngs.de | 4.04MB | 51.77 | 0.39 | 570479 | 88.73 | 9.21 | 9.07 | 642499 | 0 | 0 | 0 | 440 | 0 | |
| 2 | feeder.ecngs.de | 3.77MB | 48.23 | 0.36 | 5625137 | 89.94 | 90.79 | 710.91 | 6253805 | 0 | 0 | 0 | 434 | 0 | |
| Total | 7.81MB | 100.00 | 0.74 | 6195616 | 0.00 | 100.00 | 646.28 | 6896304 | 0 | 0 | 0 | 874 | 0 | ||
 |
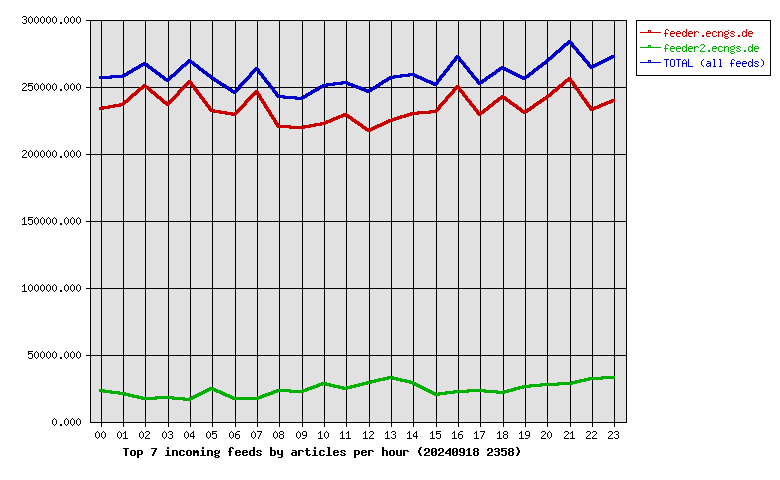
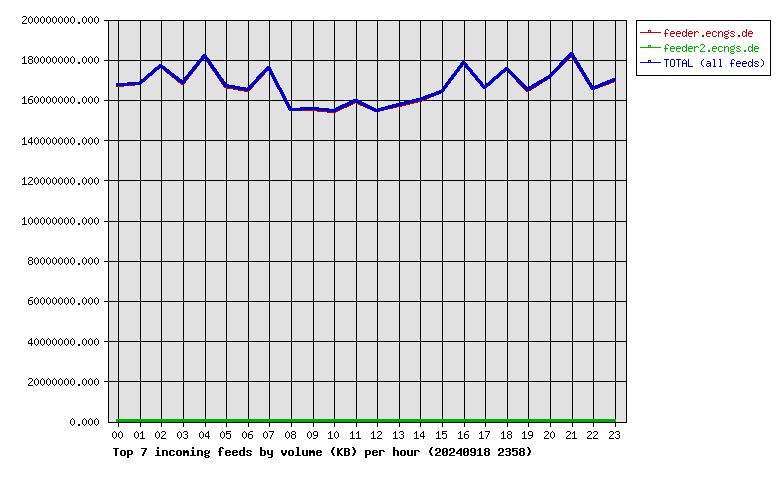
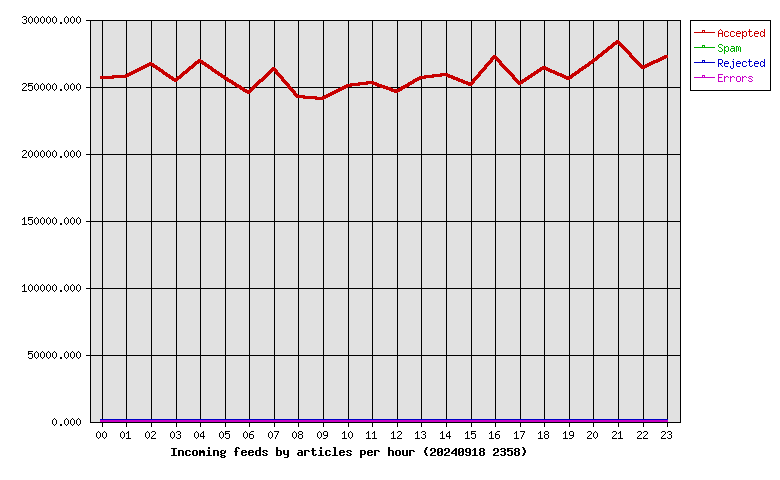
| Hour | Accepted | %Acc | Volume | %Vol | Check | Ihave | Spam | Rejs | Errs |
|---|---|---|---|---|---|---|---|---|---|
| 00 | 256338 | 4.14 | 159.53GB | 4.18 | 283228 | 0 | 0 | 33 | 0 |
| 01 | 257006 | 4.15 | 160.22GB | 4.20 | 282747 | 0 | 0 | 34 | 0 |
| 02 | 266782 | 4.31 | 168.67GB | 4.42 | 286285 | 0 | 0 | 27 | 0 |
| 03 | 254225 | 4.10 | 160.40GB | 4.20 | 275246 | 0 | 0 | 39 | 0 |
| 04 | 269079 | 4.34 | 173.50GB | 4.54 | 289625 | 0 | 0 | 40 | 0 |
| 05 | 256204 | 4.14 | 159.10GB | 4.17 | 289505 | 0 | 0 | 27 | 0 |
| 06 | 245111 | 3.96 | 157.14GB | 4.12 | 265471 | 0 | 0 | 41 | 0 |
| 07 | 262884 | 4.24 | 167.84GB | 4.40 | 283496 | 0 | 0 | 36 | 0 |
| 08 | 242277 | 3.91 | 147.86GB | 3.87 | 267955 | 0 | 0 | 16 | 0 |
| 09 | 240502 | 3.88 | 148.13GB | 3.88 | 266159 | 0 | 0 | 7 | 0 |
| 10 | 250375 | 4.04 | 147.22GB | 3.86 | 282588 | 0 | 0 | 55 | 0 |
| 11 | 252907 | 4.08 | 151.90GB | 3.98 | 283900 | 0 | 0 | 59 | 0 |
| 12 | 245928 | 3.97 | 147.41GB | 3.86 | 281586 | 0 | 0 | 60 | 0 |
| 13 | 256481 | 4.14 | 150.01GB | 3.93 | 293767 | 0 | 0 | 50 | 0 |
| 14 | 258471 | 4.17 | 152.46GB | 3.99 | 295982 | 0 | 0 | 56 | 0 |
| 15 | 251384 | 4.06 | 156.51GB | 4.10 | 274865 | 0 | 0 | 21 | 0 |
| 16 | 271829 | 4.39 | 170.10GB | 4.45 | 298684 | 0 | 0 | 27 | 0 |
| 17 | 251530 | 4.06 | 158.46GB | 4.15 | 277492 | 0 | 0 | 47 | 0 |
| 18 | 263775 | 4.26 | 167.27GB | 4.38 | 291801 | 0 | 0 | 21 | 0 |
| 19 | 255826 | 4.13 | 157.27GB | 4.12 | 287419 | 0 | 0 | 29 | 0 |
| 20 | 268181 | 4.33 | 163.57GB | 4.28 | 302317 | 0 | 0 | 51 | 0 |
| 21 | 283162 | 4.57 | 174.33GB | 4.57 | 314960 | 0 | 0 | 42 | 0 |
| 22 | 263629 | 4.26 | 157.86GB | 4.13 | 305170 | 0 | 0 | 22 | 0 |
| 23 | 271730 | 4.39 | 161.88GB | 4.24 | 316056 | 0 | 0 | 34 | 0 |
| Total | 6195616 | 100.00 | 3.73TB | 100.00 | 6896304 | 0 | 0 | 874 | 0 |
 |
| Outgoing Feed (+ Top1000 #) | Accepted | %Acc | %Tot | Art/sec | Volume | %Vol | KB/art | Dups | Rejs | % Ratio (Out/In) | ||
|---|---|---|---|---|---|---|---|---|---|---|---|---|
| 1 | 217.73.144.40 | 0 | 0.00 | 0.00 | 0.00 | 0.00KB | 0.00 | 0.00 | 6054082 | 0 | … | |
| Total | 0 | 0.00 | 0.00 | 0.00 | 0.00KB | 0.00 | 0.00 | 6054082 | 0 | |||
 |
| Outgoing Feed (+ Top1000 #) | Volume | %Vol | Kbps | Accepted | %Acc | %Tot | KB/art | Dups | Rejs | % Ratio (Out/In) | ||
|---|---|---|---|---|---|---|---|---|---|---|---|---|
| 1 | 217.73.144.40 | 0.00KB | 0.00 | 0.00 | 0 | 0.00 | 0.00 | 0.00 | 6054082 | 0 | … | |
| Total | 0.00KB | 0.00 | 0.00 | 0 | 0.00 | 0.00 | 0.00 | 6054082 | 0 | |||
 |
| Outgoing Feed (+ Top1000 #) | Rej. Vol. | %Vol | Kbps | Accepted | %Acc | %Tot | KB/art | Dups | Rejs | % Ratio (Out/In) | ||
|---|---|---|---|---|---|---|---|---|---|---|---|---|
| 1 | 217.73.144.40 | 0.00KB | 0.00 | 0.00 | 0 | 0.00 | 0.00 | 0.00 | 6054082 | 0 | … | |
| Total | 0.00KB | 0.00 | 0.00 | 0 | 0.00 | 0.00 | 0.00 | 6054082 | 0 | |||
 |
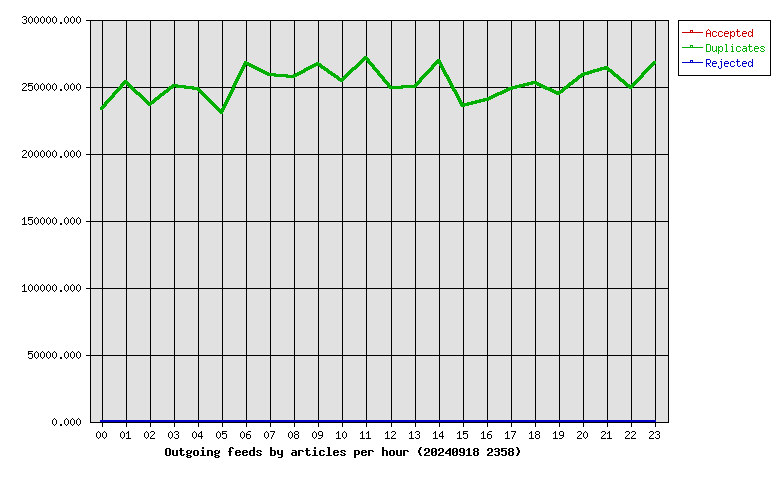
| Hour | Accepted | %Acc | Volume | %Vol | dups | Rejs |
|---|---|---|---|---|---|---|
| 00 | 0 | 0.00 | 0.00KB | 0.00 | 233319 | 0 |
| 01 | 0 | 0.00 | 0.00KB | 0.00 | 253338 | 0 |
| 02 | 0 | 0.00 | 0.00KB | 0.00 | 236493 | 0 |
| 03 | 0 | 0.00 | 0.00KB | 0.00 | 250369 | 0 |
| 04 | 0 | 0.00 | 0.00KB | 0.00 | 248331 | 0 |
| 05 | 0 | 0.00 | 0.00KB | 0.00 | 230478 | 0 |
| 06 | 0 | 0.00 | 0.00KB | 0.00 | 267440 | 0 |
| 07 | 0 | 0.00 | 0.00KB | 0.00 | 258610 | 0 |
| 08 | 0 | 0.00 | 0.00KB | 0.00 | 257291 | 0 |
| 09 | 0 | 0.00 | 0.00KB | 0.00 | 266473 | 0 |
| 10 | 0 | 0.00 | 0.00KB | 0.00 | 253914 | 0 |
| 11 | 0 | 0.00 | 0.00KB | 0.00 | 271361 | 0 |
| 12 | 0 | 0.00 | 0.00KB | 0.00 | 248949 | 0 |
| 13 | 0 | 0.00 | 0.00KB | 0.00 | 249586 | 0 |
| 14 | 0 | 0.00 | 0.00KB | 0.00 | 269066 | 0 |
| 15 | 0 | 0.00 | 0.00KB | 0.00 | 235649 | 0 |
| 16 | 0 | 0.00 | 0.00KB | 0.00 | 239957 | 0 |
| 17 | 0 | 0.00 | 0.00KB | 0.00 | 247794 | 0 |
| 18 | 0 | 0.00 | 0.00KB | 0.00 | 252405 | 0 |
| 19 | 0 | 0.00 | 0.00KB | 0.00 | 244641 | 0 |
| 20 | 0 | 0.00 | 0.00KB | 0.00 | 258281 | 0 |
| 21 | 0 | 0.00 | 0.00KB | 0.00 | 264170 | 0 |
| 22 | 0 | 0.00 | 0.00KB | 0.00 | 248751 | 0 |
| 23 | 0 | 0.00 | 0.00KB | 0.00 | 267416 | 0 |
| Total | 0 | 0.00 | 0.00KB | 0.00 | 6054082 | 0 |
 |
| >= 20% Full | >= 35% Full | >= 50% Full | >= 65% Full | >= 80% Full | >= 95% Full |
| Outgoing Feed | Batch Seq | Batch Num | Batch Max | %Full | Av. Pending |
|---|---|---|---|---|---|
| nbr.elbracht.net-o | 988063-988144 | 81 | 500 | 16 | 0.0 |
| text-spool-out | 0-0 | 0 | 500 | 0 | 0.0 |
| 1st Time | Last Time | # Msgs | Message |
|---|---|---|---|
| 21:20:22 | 21:20:31 | 4 | DNS Fwd/Rev mismatch: lookup of scanner-201.hk2.censys-scanner.com failed |