| |
DIABLO statistics for newsfeed.yoursite.com on Tue 17 Sep 2024 |
Generated on 20240917 2358 by feeder-stats v4.006. Copyright © 2002 The Diablo Project.
Diablo running processes:  81    Dnewslink running processes:  0


11:59PM  up 212 days,  7:18, 0 users, load averages: 1.26, 0.91, 0.81

Filesystem     Size    Used   Avail Capacity  Mounted on
/dev/da0s1g     94G    1.2G     85G     1%    /news
/dev/da1       7.3T    5.8T    947G    86%    /news2/spool/news/00
/dev/da2       7.3T    5.8T    950G    86%    /news2/spool/news/01
/dev/da3       3.7T    3.3T     64G    98%    /news2/spool/news/02
/dev/da4       5.5T    2.9T    2.1T    57%    /news2/spool/news/03
/dev/da8       7.3T    5.8T    947G    86%    /news2/spool/news/04
/dev/da9       7.3T    5.8T    946G    86%    /news2/spool/news/05
/dev/da10      7.3T    5.8T    948G    86%    /news2/spool/news/06
/dev/da11      5.5T      5T     65G    99%    /news2/spool/news/07
/dev/da12      5.5T    4.3T    748G    85%    /news2/spool/news/08
/dev/da13      7.3T    5.8T    949G    86%    /news2/spool/news/09
/dev/da14      7.3T    5.8T    956G    86%    /news2/spool/news/10
/dev/da15      7.3T    5.8T    949G    86%    /news2/spool/news/11
/dev/da16      7.3T    5.8T    946G    86%    /news2/spool/news/12
/dev/da17      7.3T    5.8T    948G    86%    /news2/spool/news/13
/dev/da18      7.3T    5.8T    949G    86%    /news2/spool/news/14
/dev/da19      7.3T    5.8T    943G    86%    /news2/spool/news/15
/dev/da20      7.3T    5.8T    948G    86%    /news2/spool/news/16
/dev/da21      7.3T    5.8T    948G    86%    /news2/spool/news/17
/dev/da22      7.3T    5.8T    949G    86%    /news2/spool/news/18
/dev/da23      7.3T    5.8T    948G    86%    /news2/spool/news/19
/dev/da24      7.3T    5.8T    948G    86%    /news2/spool/news/20
/dev/da25      7.3T    5.8T    948G    86%    /news2/spool/news/21
/dev/da26      7.3T    5.8T    948G    86%    /news2/spool/news/22
/dev/da5       221G     34G    169G    17%    /news1
/dev/md0        40G     12G     23G    36%    /news3
| Incoming Feed (+ Top1000 #) | Accepted | %Acc | %Tot | Art/sec | Volume | %Vol | KB/art | Check | Ihave | Spam | TooOld | Rejs | Errs | ||
|---|---|---|---|---|---|---|---|---|---|---|---|---|---|---|---|
| 1 | feeder.ecngs.de | 5583588 | 90.33 | 91.16 | 64.62 | 3.73TB | 99.88 | 717.86 | 6181011 | 0 | 0 | 0 | 370 | 0 | |
| 2 | feeder2.ecngs.de | 541127 | 90.11 | 8.84 | 6.32 | 4.52GB | 0.12 | 8.76 | 600113 | 0 | 0 | 0 | 381 | 0 | |
| Total | 6124715 | 0.00 | 100.00 | 70.94 | 3.74TB | 100.00 | 655.21 | 6781124 | 0 | 0 | 0 | 751 | 0 | ||
 |
| Incoming Feed (+ Top1000 #) | Volume | %Vol | Kbps | Accepted | %Acc | %Tot | KB/art | Check | Ihave | Spam | TooOld | Rejs | Errs | ||
|---|---|---|---|---|---|---|---|---|---|---|---|---|---|---|---|
| 1 | feeder.ecngs.de | 3.73TB | 99.88 | 371134.91 | 5583588 | 90.33 | 91.16 | 717.86 | 6181011 | 0 | 0 | 0 | 370 | 0 | |
| 2 | feeder2.ecngs.de | 4.52GB | 0.12 | 442.98 | 541127 | 90.11 | 8.84 | 8.76 | 600113 | 0 | 0 | 0 | 381 | 0 | |
| Total | 3.74TB | 100.00 | 371577.89 | 6124715 | 0.00 | 100.00 | 655.21 | 6781124 | 0 | 0 | 0 | 751 | 0 | ||
 |
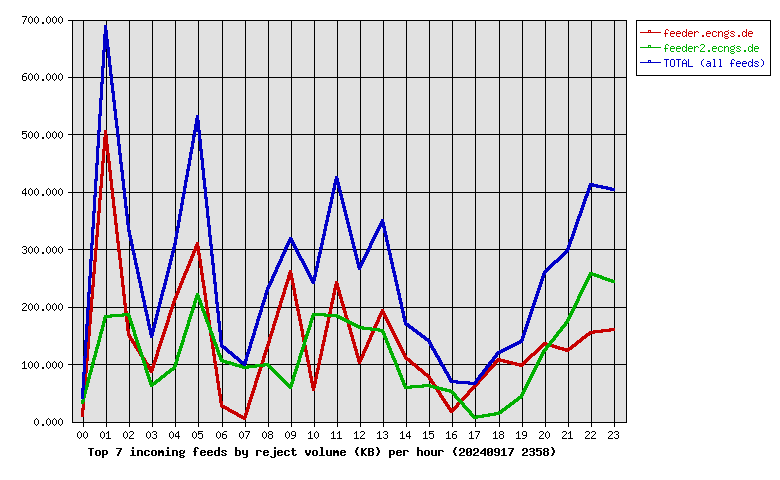
| Incoming Feed (+ Top1000 #) | Rej. Vol. | %Vol | Kbps | Accepted | %Acc | %Tot | KB/art | Check | Ihave | Spam | TooOld | Rejs | Errs | ||
|---|---|---|---|---|---|---|---|---|---|---|---|---|---|---|---|
| 1 | feeder.ecngs.de | 3.24MB | 53.83 | 0.31 | 5583588 | 90.33 | 91.16 | 717.86 | 6181011 | 0 | 0 | 0 | 370 | 0 | |
| 2 | feeder2.ecngs.de | 2.78MB | 46.17 | 0.27 | 541127 | 90.11 | 8.84 | 8.76 | 600113 | 0 | 0 | 0 | 381 | 0 | |
| Total | 6.02MB | 100.00 | 0.57 | 6124715 | 0.00 | 100.00 | 655.21 | 6781124 | 0 | 0 | 0 | 751 | 0 | ||
 |
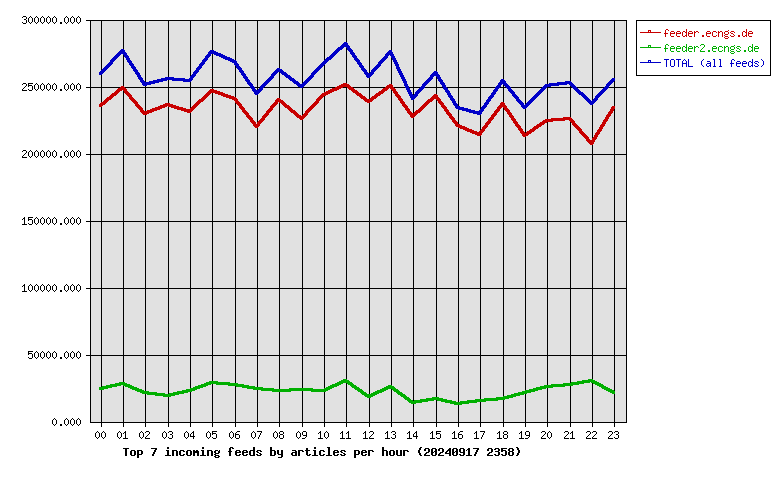
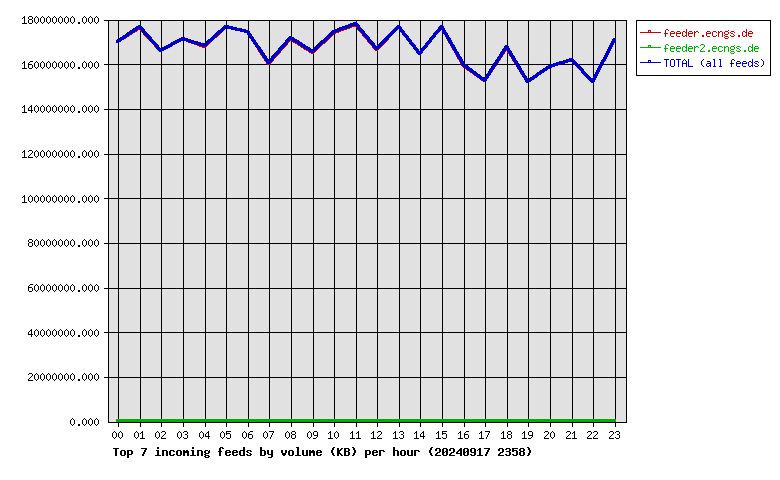
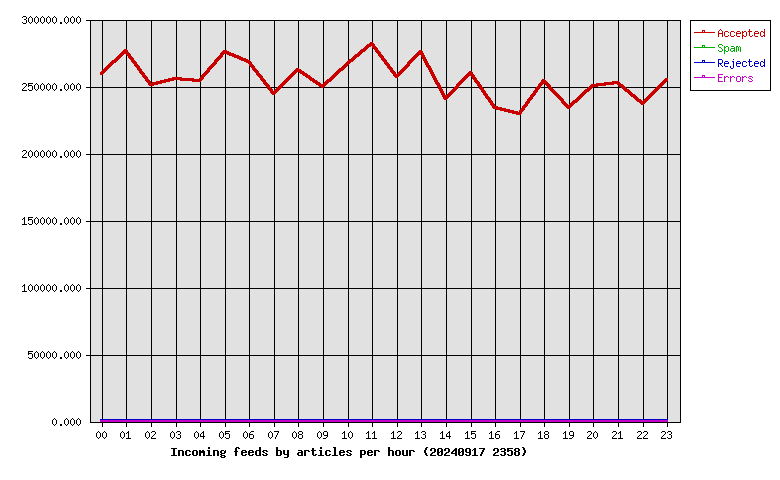
| Hour | Accepted | %Acc | Volume | %Vol | Check | Ihave | Spam | Rejs | Errs |
|---|---|---|---|---|---|---|---|---|---|
| 00 | 259605 | 4.24 | 162.11GB | 4.24 | 286268 | 0 | 0 | 11 | 0 |
| 01 | 276713 | 4.52 | 168.39GB | 4.40 | 316254 | 0 | 0 | 81 | 0 |
| 02 | 251309 | 4.10 | 158.33GB | 4.14 | 277479 | 0 | 0 | 34 | 0 |
| 03 | 255856 | 4.18 | 163.33GB | 4.27 | 276792 | 0 | 0 | 19 | 0 |
| 04 | 253826 | 4.14 | 160.28GB | 4.19 | 280665 | 0 | 0 | 27 | 0 |
| 05 | 275489 | 4.50 | 168.64GB | 4.41 | 325243 | 0 | 0 | 63 | 0 |
| 06 | 268248 | 4.38 | 166.37GB | 4.35 | 301579 | 0 | 0 | 22 | 0 |
| 07 | 244588 | 3.99 | 152.89GB | 3.99 | 272893 | 0 | 0 | 16 | 0 |
| 08 | 262394 | 4.28 | 163.65GB | 4.28 | 286912 | 0 | 0 | 25 | 0 |
| 09 | 249499 | 4.07 | 157.68GB | 4.12 | 277204 | 0 | 0 | 28 | 0 |
| 10 | 266471 | 4.35 | 166.28GB | 4.34 | 293338 | 0 | 0 | 26 | 0 |
| 11 | 281869 | 4.60 | 169.67GB | 4.43 | 318751 | 0 | 0 | 57 | 0 |
| 12 | 256864 | 4.19 | 158.93GB | 4.15 | 279720 | 0 | 0 | 31 | 0 |
| 13 | 275516 | 4.50 | 168.50GB | 4.40 | 305629 | 0 | 0 | 33 | 0 |
| 14 | 240532 | 3.93 | 157.09GB | 4.10 | 256329 | 0 | 0 | 22 | 0 |
| 15 | 259702 | 4.24 | 168.55GB | 4.40 | 278348 | 0 | 0 | 12 | 0 |
| 16 | 233895 | 3.82 | 152.08GB | 3.97 | 249703 | 0 | 0 | 9 | 0 |
| 17 | 229321 | 3.74 | 145.58GB | 3.80 | 246366 | 0 | 0 | 11 | 0 |
| 18 | 253873 | 4.15 | 159.82GB | 4.18 | 273358 | 0 | 0 | 17 | 0 |
| 19 | 233774 | 3.82 | 145.02GB | 3.79 | 258925 | 0 | 0 | 22 | 0 |
| 20 | 250216 | 4.09 | 151.46GB | 3.96 | 280264 | 0 | 0 | 41 | 0 |
| 21 | 252972 | 4.13 | 154.49GB | 4.04 | 286287 | 0 | 0 | 39 | 0 |
| 22 | 237080 | 3.87 | 144.95GB | 3.79 | 271705 | 0 | 0 | 64 | 0 |
| 23 | 255103 | 4.17 | 162.99GB | 4.26 | 281112 | 0 | 0 | 41 | 0 |
| Total | 6124715 | 100.00 | 3.74TB | 100.00 | 6781124 | 0 | 0 | 751 | 0 |
 |
| Outgoing Feed (+ Top1000 #) | Accepted | %Acc | %Tot | Art/sec | Volume | %Vol | KB/art | Dups | Rejs | % Ratio (Out/In) | ||
|---|---|---|---|---|---|---|---|---|---|---|---|---|
| 1 | 217.73.144.40 | 0 | 0.00 | 0.00 | 0.00 | 0.00KB | 0.00 | 0.00 | 6088682 | 0 | … | |
| Total | 0 | 0.00 | 0.00 | 0.00 | 0.00KB | 0.00 | 0.00 | 6088682 | 0 | |||
 |
| Outgoing Feed (+ Top1000 #) | Volume | %Vol | Kbps | Accepted | %Acc | %Tot | KB/art | Dups | Rejs | % Ratio (Out/In) | ||
|---|---|---|---|---|---|---|---|---|---|---|---|---|
| 1 | 217.73.144.40 | 0.00KB | 0.00 | 0.00 | 0 | 0.00 | 0.00 | 0.00 | 6088682 | 0 | … | |
| Total | 0.00KB | 0.00 | 0.00 | 0 | 0.00 | 0.00 | 0.00 | 6088682 | 0 | |||
 |
| Outgoing Feed (+ Top1000 #) | Rej. Vol. | %Vol | Kbps | Accepted | %Acc | %Tot | KB/art | Dups | Rejs | % Ratio (Out/In) | ||
|---|---|---|---|---|---|---|---|---|---|---|---|---|
| 1 | 217.73.144.40 | 0.00KB | 0.00 | 0.00 | 0 | 0.00 | 0.00 | 0.00 | 6088682 | 0 | … | |
| Total | 0.00KB | 0.00 | 0.00 | 0 | 0.00 | 0.00 | 0.00 | 6088682 | 0 | |||
 |
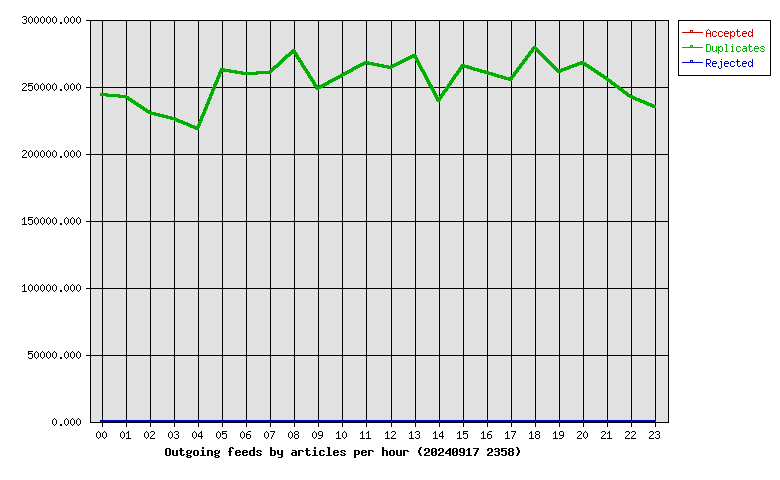
| Hour | Accepted | %Acc | Volume | %Vol | dups | Rejs |
|---|---|---|---|---|---|---|
| 00 | 0 | 0.00 | 0.00KB | 0.00 | 243887 | 0 |
| 01 | 0 | 0.00 | 0.00KB | 0.00 | 242060 | 0 |
| 02 | 0 | 0.00 | 0.00KB | 0.00 | 230529 | 0 |
| 03 | 0 | 0.00 | 0.00KB | 0.00 | 225569 | 0 |
| 04 | 0 | 0.00 | 0.00KB | 0.00 | 218451 | 0 |
| 05 | 0 | 0.00 | 0.00KB | 0.00 | 262556 | 0 |
| 06 | 0 | 0.00 | 0.00KB | 0.00 | 259285 | 0 |
| 07 | 0 | 0.00 | 0.00KB | 0.00 | 260384 | 0 |
| 08 | 0 | 0.00 | 0.00KB | 0.00 | 276710 | 0 |
| 09 | 0 | 0.00 | 0.00KB | 0.00 | 247798 | 0 |
| 10 | 0 | 0.00 | 0.00KB | 0.00 | 257707 | 0 |
| 11 | 0 | 0.00 | 0.00KB | 0.00 | 267834 | 0 |
| 12 | 0 | 0.00 | 0.00KB | 0.00 | 264130 | 0 |
| 13 | 0 | 0.00 | 0.00KB | 0.00 | 273026 | 0 |
| 14 | 0 | 0.00 | 0.00KB | 0.00 | 238820 | 0 |
| 15 | 0 | 0.00 | 0.00KB | 0.00 | 265040 | 0 |
| 16 | 0 | 0.00 | 0.00KB | 0.00 | 259916 | 0 |
| 17 | 0 | 0.00 | 0.00KB | 0.00 | 255060 | 0 |
| 18 | 0 | 0.00 | 0.00KB | 0.00 | 278916 | 0 |
| 19 | 0 | 0.00 | 0.00KB | 0.00 | 261037 | 0 |
| 20 | 0 | 0.00 | 0.00KB | 0.00 | 267473 | 0 |
| 21 | 0 | 0.00 | 0.00KB | 0.00 | 255312 | 0 |
| 22 | 0 | 0.00 | 0.00KB | 0.00 | 242245 | 0 |
| 23 | 0 | 0.00 | 0.00KB | 0.00 | 234937 | 0 |
| Total | 0 | 0.00 | 0.00KB | 0.00 | 6088682 | 0 |
 |
| >= 20% Full | >= 35% Full | >= 50% Full | >= 65% Full | >= 80% Full | >= 95% Full |
| Outgoing Feed | Batch Seq | Batch Num | Batch Max | %Full | Av. Pending |
|---|---|---|---|---|---|
| nbr.elbracht.net-o | 987775-987856 | 81 | 500 | 16 | 0.0 |
| text-spool-out | 0-0 | 0 | 500 | 0 | 0.0 |
| 1st Time | Last Time | # Msgs | Message |
|---|---|---|---|
| 00:25:22 | 1 | DNS Fwd/Rev mismatch: visit.keznews.com/194.165.16.10 |