| |
DIABLO statistics for newsfeed.yoursite.com on Mon 16 Sep 2024 |
Generated on 20240916 2358 by feeder-stats v4.006. Copyright © 2002 The Diablo Project.
Diablo running processes:  81    Dnewslink running processes:  0


11:59PM  up 211 days,  7:18, 0 users, load averages: 1.69, 0.93, 0.68

Filesystem     Size    Used   Avail Capacity  Mounted on
/dev/da0s1g     94G    1.2G     85G     1%    /news
/dev/da1       7.3T    5.8T    952G    86%    /news2/spool/news/00
/dev/da2       7.3T    5.8T    947G    86%    /news2/spool/news/01
/dev/da3       3.7T    3.3T     67G    98%    /news2/spool/news/02
/dev/da4       5.5T    2.9T    2.1T    57%    /news2/spool/news/03
/dev/da8       7.3T    5.8T    945G    86%    /news2/spool/news/04
/dev/da9       7.3T    5.8T    944G    86%    /news2/spool/news/05
/dev/da10      7.3T    5.8T    946G    86%    /news2/spool/news/06
/dev/da11      5.5T      5T     66G    99%    /news2/spool/news/07
/dev/da12      5.5T    4.3T    746G    85%    /news2/spool/news/08
/dev/da13      7.3T    5.8T    946G    86%    /news2/spool/news/09
/dev/da14      7.3T    5.8T    946G    86%    /news2/spool/news/10
/dev/da15      7.3T    5.8T    946G    86%    /news2/spool/news/11
/dev/da16      7.3T    5.8T    943G    86%    /news2/spool/news/12
/dev/da17      7.3T    5.8T    945G    86%    /news2/spool/news/13
/dev/da18      7.3T    5.8T    947G    86%    /news2/spool/news/14
/dev/da19      7.3T    5.8T    940G    86%    /news2/spool/news/15
/dev/da20      7.3T    5.8T    946G    86%    /news2/spool/news/16
/dev/da21      7.3T    5.8T    946G    86%    /news2/spool/news/17
/dev/da22      7.3T    5.8T    947G    86%    /news2/spool/news/18
/dev/da23      7.3T    5.8T    945G    86%    /news2/spool/news/19
/dev/da24      7.3T    5.8T    946G    86%    /news2/spool/news/20
/dev/da25      7.3T    5.8T    946G    86%    /news2/spool/news/21
/dev/da26      7.3T    5.8T    946G    86%    /news2/spool/news/22
/dev/da5       221G     34G    169G    17%    /news1
/dev/md0        40G     12G     23G    36%    /news3
| Incoming Feed (+ Top1000 #) | Accepted | %Acc | %Tot | Art/sec | Volume | %Vol | KB/art | Check | Ihave | Spam | TooOld | Rejs | Errs | ||
|---|---|---|---|---|---|---|---|---|---|---|---|---|---|---|---|
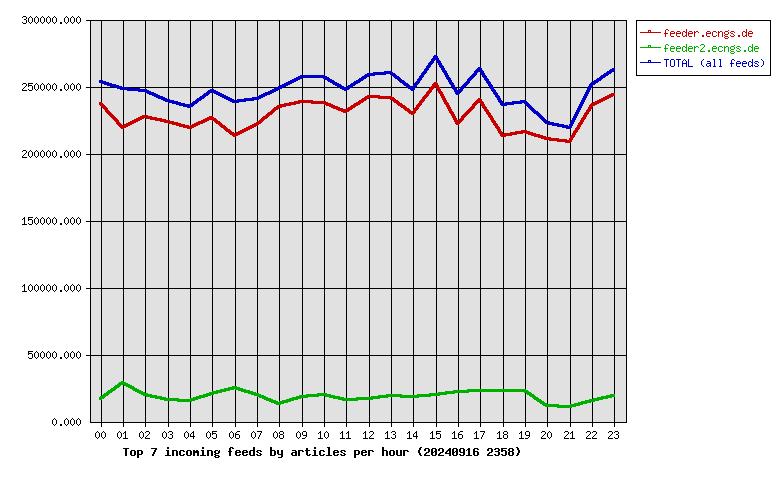
| 1 | feeder.ecngs.de | 5484565 | 91.76 | 92.45 | 63.48 | 3.65TB | 99.91 | 714.67 | 5976619 | 0 | 0 | 0 | 344 | 0 | |
| 2 | feeder2.ecngs.de | 448103 | 90.50 | 7.55 | 5.24 | 3.45GB | 0.09 | 8.08 | 494845 | 0 | 0 | 0 | 317 | 0 | |
| Total | 5932668 | 0.00 | 100.00 | 68.72 | 3.65TB | 100.00 | 661.30 | 6471464 | 0 | 0 | 0 | 661 | 0 | ||
 |
| Incoming Feed (+ Top1000 #) | Volume | %Vol | Kbps | Accepted | %Acc | %Tot | KB/art | Check | Ihave | Spam | TooOld | Rejs | Errs | ||
|---|---|---|---|---|---|---|---|---|---|---|---|---|---|---|---|
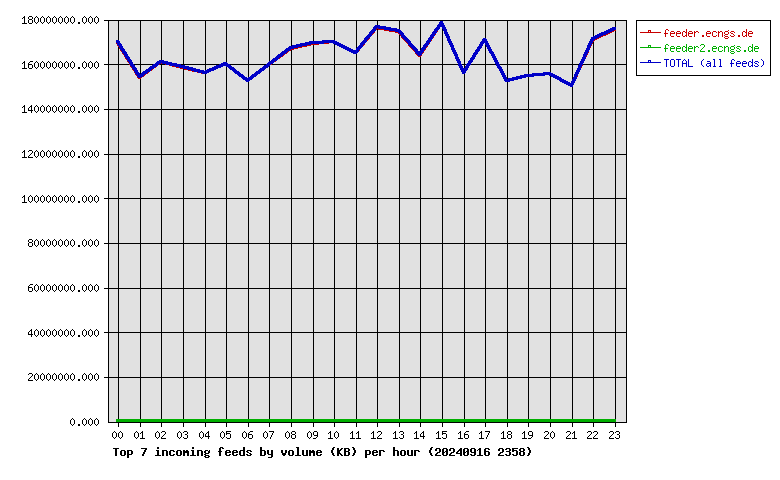
| 1 | feeder.ecngs.de | 3.65TB | 99.91 | 362932.64 | 5484565 | 91.76 | 92.45 | 714.67 | 5976619 | 0 | 0 | 0 | 344 | 0 | |
| 2 | feeder2.ecngs.de | 3.45GB | 0.09 | 338.53 | 448103 | 90.50 | 7.55 | 8.08 | 494845 | 0 | 0 | 0 | 317 | 0 | |
| Total | 3.65TB | 100.00 | 363271.17 | 5932668 | 0.00 | 100.00 | 661.30 | 6471464 | 0 | 0 | 0 | 661 | 0 | ||
 |
| Incoming Feed (+ Top1000 #) | Rej. Vol. | %Vol | Kbps | Accepted | %Acc | %Tot | KB/art | Check | Ihave | Spam | TooOld | Rejs | Errs | ||
|---|---|---|---|---|---|---|---|---|---|---|---|---|---|---|---|
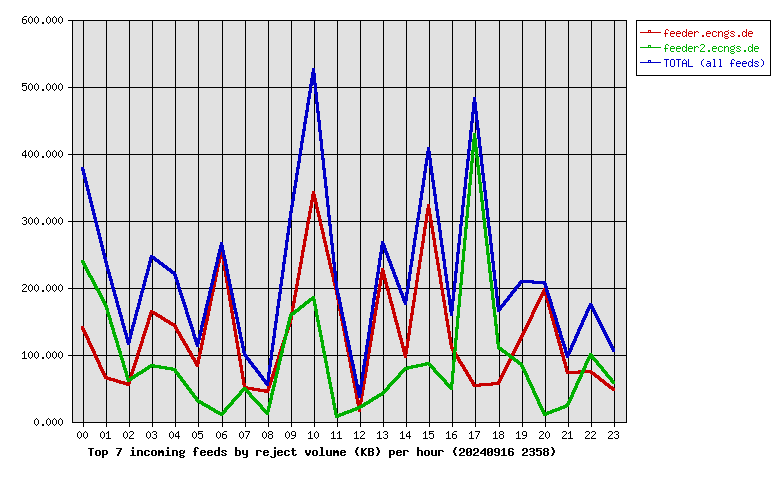
| 1 | feeder.ecngs.de | 3.00MB | 58.65 | 0.28 | 5484565 | 91.76 | 92.45 | 714.67 | 5976619 | 0 | 0 | 0 | 344 | 0 | |
| 2 | feeder2.ecngs.de | 2.12MB | 41.35 | 0.20 | 448103 | 90.50 | 7.55 | 8.08 | 494845 | 0 | 0 | 0 | 317 | 0 | |
| Total | 5.12MB | 100.00 | 0.49 | 5932668 | 0.00 | 100.00 | 661.30 | 6471464 | 0 | 0 | 0 | 661 | 0 | ||
 |
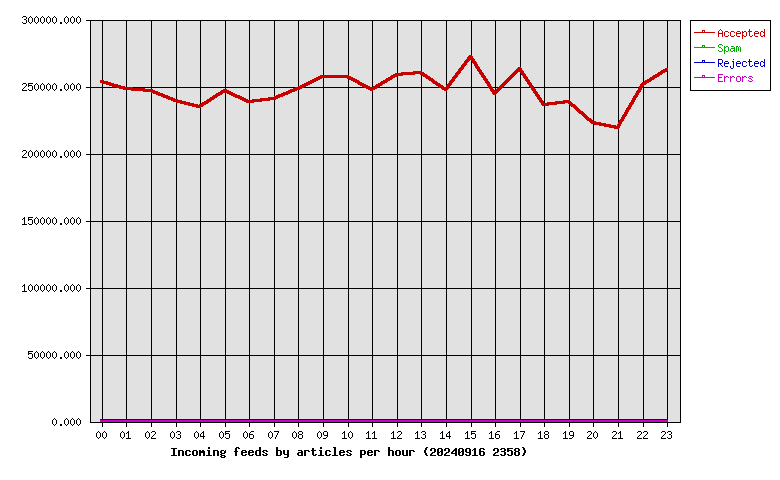
| Hour | Accepted | %Acc | Volume | %Vol | Check | Ihave | Spam | Rejs | Errs |
|---|---|---|---|---|---|---|---|---|---|
| 00 | 253593 | 4.27 | 161.91GB | 4.33 | 274743 | 0 | 0 | 44 | 0 |
| 01 | 247763 | 4.18 | 146.90GB | 3.93 | 279632 | 0 | 0 | 34 | 0 |
| 02 | 246560 | 4.16 | 153.58GB | 4.10 | 269020 | 0 | 0 | 25 | 0 |
| 03 | 239132 | 4.03 | 151.21GB | 4.04 | 258215 | 0 | 0 | 28 | 0 |
| 04 | 234623 | 3.95 | 148.76GB | 3.98 | 252460 | 0 | 0 | 28 | 0 |
| 05 | 246782 | 4.16 | 152.66GB | 4.08 | 284454 | 0 | 0 | 11 | 0 |
| 06 | 238414 | 4.02 | 145.42GB | 3.89 | 266614 | 0 | 0 | 30 | 0 |
| 07 | 240922 | 4.06 | 152.34GB | 4.07 | 264385 | 0 | 0 | 20 | 0 |
| 08 | 247888 | 4.18 | 159.31GB | 4.26 | 262535 | 0 | 0 | 10 | 0 |
| 09 | 256974 | 4.33 | 161.49GB | 4.32 | 280156 | 0 | 0 | 44 | 0 |
| 10 | 257128 | 4.33 | 162.00GB | 4.33 | 278464 | 0 | 0 | 43 | 0 |
| 11 | 247521 | 4.17 | 157.38GB | 4.21 | 267691 | 0 | 0 | 23 | 0 |
| 12 | 258677 | 4.36 | 168.28GB | 4.50 | 277732 | 0 | 0 | 10 | 0 |
| 13 | 260078 | 4.38 | 166.58GB | 4.45 | 282441 | 0 | 0 | 31 | 0 |
| 14 | 247755 | 4.18 | 156.33GB | 4.18 | 268975 | 0 | 0 | 28 | 0 |
| 15 | 271791 | 4.58 | 170.18GB | 4.55 | 294466 | 0 | 0 | 30 | 0 |
| 16 | 244159 | 4.12 | 148.90GB | 3.98 | 268037 | 0 | 0 | 30 | 0 |
| 17 | 262746 | 4.43 | 163.05GB | 4.36 | 291091 | 0 | 0 | 52 | 0 |
| 18 | 236302 | 3.98 | 145.53GB | 3.89 | 263515 | 0 | 0 | 32 | 0 |
| 19 | 238767 | 4.02 | 147.56GB | 3.94 | 266358 | 0 | 0 | 28 | 0 |
| 20 | 222636 | 3.75 | 148.39GB | 3.97 | 236071 | 0 | 0 | 32 | 0 |
| 21 | 219191 | 3.69 | 143.15GB | 3.83 | 230910 | 0 | 0 | 9 | 0 |
| 22 | 251161 | 4.23 | 163.22GB | 4.36 | 269299 | 0 | 0 | 20 | 0 |
| 23 | 262105 | 4.42 | 167.41GB | 4.47 | 284200 | 0 | 0 | 19 | 0 |
| Total | 5932668 | 100.00 | 3.65TB | 100.00 | 6471464 | 0 | 0 | 661 | 0 |
 |
| Outgoing Feed (+ Top1000 #) | Accepted | %Acc | %Tot | Art/sec | Volume | %Vol | KB/art | Dups | Rejs | % Ratio (Out/In) | ||
|---|---|---|---|---|---|---|---|---|---|---|---|---|
| 1 | 217.73.144.40 | 0 | 0.00 | 0.00 | 0.00 | 0.00KB | 0.00 | 0.00 | 6061699 | 0 | … | |
| Total | 0 | 0.00 | 0.00 | 0.00 | 0.00KB | 0.00 | 0.00 | 6061699 | 0 | |||
 |
| Outgoing Feed (+ Top1000 #) | Volume | %Vol | Kbps | Accepted | %Acc | %Tot | KB/art | Dups | Rejs | % Ratio (Out/In) | ||
|---|---|---|---|---|---|---|---|---|---|---|---|---|
| 1 | 217.73.144.40 | 0.00KB | 0.00 | 0.00 | 0 | 0.00 | 0.00 | 0.00 | 6061699 | 0 | … | |
| Total | 0.00KB | 0.00 | 0.00 | 0 | 0.00 | 0.00 | 0.00 | 6061699 | 0 | |||
 |
| Outgoing Feed (+ Top1000 #) | Rej. Vol. | %Vol | Kbps | Accepted | %Acc | %Tot | KB/art | Dups | Rejs | % Ratio (Out/In) | ||
|---|---|---|---|---|---|---|---|---|---|---|---|---|
| 1 | 217.73.144.40 | 0.00KB | 0.00 | 0.00 | 0 | 0.00 | 0.00 | 0.00 | 6061699 | 0 | … | |
| Total | 0.00KB | 0.00 | 0.00 | 0 | 0.00 | 0.00 | 0.00 | 6061699 | 0 | |||
 |
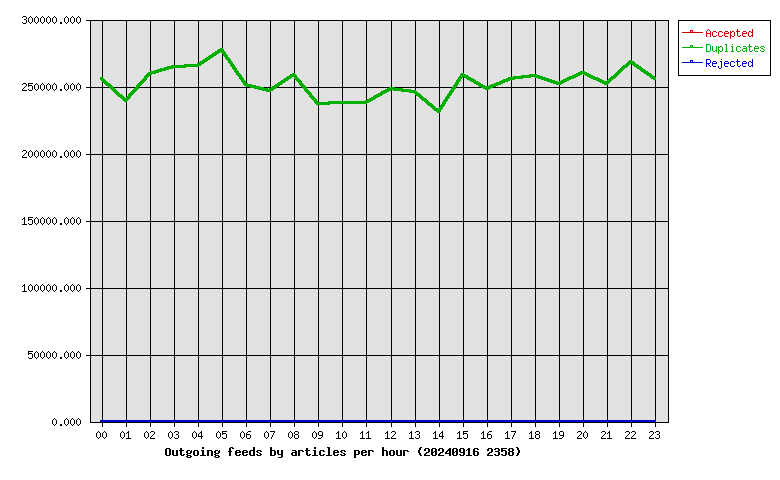
| Hour | Accepted | %Acc | Volume | %Vol | dups | Rejs |
|---|---|---|---|---|---|---|
| 00 | 0 | 0.00 | 0.00KB | 0.00 | 255748 | 0 |
| 01 | 0 | 0.00 | 0.00KB | 0.00 | 239182 | 0 |
| 02 | 0 | 0.00 | 0.00KB | 0.00 | 259146 | 0 |
| 03 | 0 | 0.00 | 0.00KB | 0.00 | 264822 | 0 |
| 04 | 0 | 0.00 | 0.00KB | 0.00 | 264965 | 0 |
| 05 | 0 | 0.00 | 0.00KB | 0.00 | 277211 | 0 |
| 06 | 0 | 0.00 | 0.00KB | 0.00 | 250774 | 0 |
| 07 | 0 | 0.00 | 0.00KB | 0.00 | 246440 | 0 |
| 08 | 0 | 0.00 | 0.00KB | 0.00 | 258760 | 0 |
| 09 | 0 | 0.00 | 0.00KB | 0.00 | 236884 | 0 |
| 10 | 0 | 0.00 | 0.00KB | 0.00 | 237925 | 0 |
| 11 | 0 | 0.00 | 0.00KB | 0.00 | 237428 | 0 |
| 12 | 0 | 0.00 | 0.00KB | 0.00 | 248224 | 0 |
| 13 | 0 | 0.00 | 0.00KB | 0.00 | 245765 | 0 |
| 14 | 0 | 0.00 | 0.00KB | 0.00 | 230718 | 0 |
| 15 | 0 | 0.00 | 0.00KB | 0.00 | 258763 | 0 |
| 16 | 0 | 0.00 | 0.00KB | 0.00 | 248198 | 0 |
| 17 | 0 | 0.00 | 0.00KB | 0.00 | 255799 | 0 |
| 18 | 0 | 0.00 | 0.00KB | 0.00 | 257746 | 0 |
| 19 | 0 | 0.00 | 0.00KB | 0.00 | 251619 | 0 |
| 20 | 0 | 0.00 | 0.00KB | 0.00 | 259989 | 0 |
| 21 | 0 | 0.00 | 0.00KB | 0.00 | 251781 | 0 |
| 22 | 0 | 0.00 | 0.00KB | 0.00 | 268296 | 0 |
| 23 | 0 | 0.00 | 0.00KB | 0.00 | 255516 | 0 |
| Total | 0 | 0.00 | 0.00KB | 0.00 | 6061699 | 0 |
 |
| >= 20% Full | >= 35% Full | >= 50% Full | >= 65% Full | >= 80% Full | >= 95% Full |
| Outgoing Feed | Batch Seq | Batch Num | Batch Max | %Full | Av. Pending |
|---|---|---|---|---|---|
| nbr.elbracht.net-o | 987487-987568 | 81 | 500 | 16 | 0.0 |
| text-spool-out | 0-0 | 0 | 500 | 0 | 0.0 |
| 1st Time | Last Time | # Msgs | Message |
|---|