| |
DIABLO statistics for newsfeed.yoursite.com on Sun 15 Sep 2024 |
Generated on 20240915 2358 by feeder-stats v4.006. Copyright © 2002 The Diablo Project.
Diablo running processes:  81    Dnewslink running processes:  0


11:59PM  up 210 days,  7:18, 0 users, load averages: 1.50, 0.91, 0.76

Filesystem     Size    Used   Avail Capacity  Mounted on
/dev/da0s1g     94G    1.2G     85G     1%    /news
/dev/da1       7.3T    5.8T    952G    86%    /news2/spool/news/00
/dev/da2       7.3T    5.8T    948G    86%    /news2/spool/news/01
/dev/da3       3.7T    3.3T     68G    98%    /news2/spool/news/02
/dev/da4       5.5T    2.9T    2.1T    57%    /news2/spool/news/03
/dev/da8       7.3T    5.8T    946G    86%    /news2/spool/news/04
/dev/da9       7.3T    5.8T    945G    86%    /news2/spool/news/05
/dev/da10      7.3T    5.8T    946G    86%    /news2/spool/news/06
/dev/da11      5.5T      5T     65G    99%    /news2/spool/news/07
/dev/da12      5.5T    4.3T    747G    85%    /news2/spool/news/08
/dev/da13      7.3T    5.8T    947G    86%    /news2/spool/news/09
/dev/da14      7.3T    5.8T    945G    86%    /news2/spool/news/10
/dev/da15      7.3T    5.8T    946G    86%    /news2/spool/news/11
/dev/da16      7.3T    5.8T    943G    86%    /news2/spool/news/12
/dev/da17      7.3T    5.8T    946G    86%    /news2/spool/news/13
/dev/da18      7.3T    5.8T    948G    86%    /news2/spool/news/14
/dev/da19      7.3T    5.8T    942G    86%    /news2/spool/news/15
/dev/da20      7.3T    5.8T    947G    86%    /news2/spool/news/16
/dev/da21      7.3T    5.8T    946G    86%    /news2/spool/news/17
/dev/da22      7.3T    5.8T    948G    86%    /news2/spool/news/18
/dev/da23      7.3T    5.8T    947G    86%    /news2/spool/news/19
/dev/da24      7.3T    5.8T    946G    86%    /news2/spool/news/20
/dev/da25      7.3T    5.8T    946G    86%    /news2/spool/news/21
/dev/da26      7.3T    5.8T    946G    86%    /news2/spool/news/22
/dev/da5       221G     34G    169G    17%    /news1
/dev/md0        40G     12G     23G    35%    /news3
| Incoming Feed (+ Top1000 #) | Accepted | %Acc | %Tot | Art/sec | Volume | %Vol | KB/art | Check | Ihave | Spam | TooOld | Rejs | Errs | ||
|---|---|---|---|---|---|---|---|---|---|---|---|---|---|---|---|
| 1 | feeder.ecngs.de | 5649550 | 91.97 | 92.69 | 65.39 | 3.78TB | 99.91 | 719.02 | 6142514 | 0 | 0 | 0 | 278 | 0 | |
| 2 | feeder2.ecngs.de | 445260 | 90.41 | 7.31 | 5.16 | 3.58GB | 0.09 | 8.43 | 492219 | 0 | 0 | 0 | 252 | 0 | |
| Total | 6094810 | 0.00 | 100.00 | 70.55 | 3.79TB | 100.00 | 667.11 | 6634733 | 0 | 0 | 0 | 530 | 0 | ||
 |
| Incoming Feed (+ Top1000 #) | Volume | %Vol | Kbps | Accepted | %Acc | %Tot | KB/art | Check | Ihave | Spam | TooOld | Rejs | Errs | ||
|---|---|---|---|---|---|---|---|---|---|---|---|---|---|---|---|
| 1 | feeder.ecngs.de | 3.78TB | 99.91 | 376124.73 | 5649550 | 91.97 | 92.69 | 719.02 | 6142514 | 0 | 0 | 0 | 278 | 0 | |
| 2 | feeder2.ecngs.de | 3.58GB | 0.09 | 348.35 | 445260 | 90.41 | 7.31 | 8.43 | 492219 | 0 | 0 | 0 | 252 | 0 | |
| Total | 3.79TB | 100.00 | 376473.08 | 6094810 | 0.00 | 100.00 | 667.11 | 6634733 | 0 | 0 | 0 | 530 | 0 | ||
 |
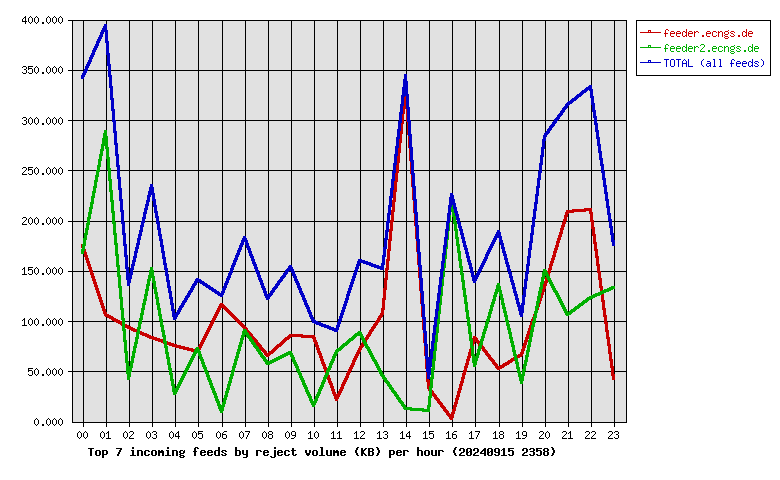
| Incoming Feed (+ Top1000 #) | Rej. Vol. | %Vol | Kbps | Accepted | %Acc | %Tot | KB/art | Check | Ihave | Spam | TooOld | Rejs | Errs | ||
|---|---|---|---|---|---|---|---|---|---|---|---|---|---|---|---|
| 1 | feeder.ecngs.de | 2.35MB | 52.48 | 0.22 | 5649550 | 91.97 | 92.69 | 719.02 | 6142514 | 0 | 0 | 0 | 278 | 0 | |
| 2 | feeder2.ecngs.de | 2.13MB | 47.52 | 0.20 | 445260 | 90.41 | 7.31 | 8.43 | 492219 | 0 | 0 | 0 | 252 | 0 | |
| Total | 4.47MB | 100.00 | 0.42 | 6094810 | 0.00 | 100.00 | 667.11 | 6634733 | 0 | 0 | 0 | 530 | 0 | ||
 |
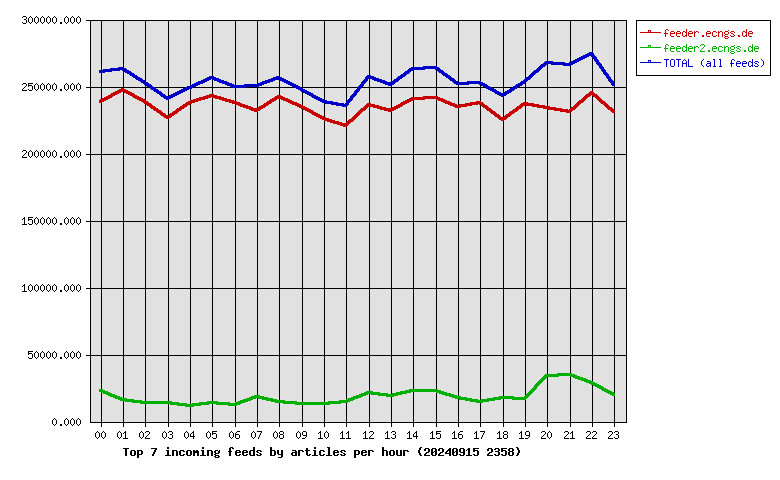
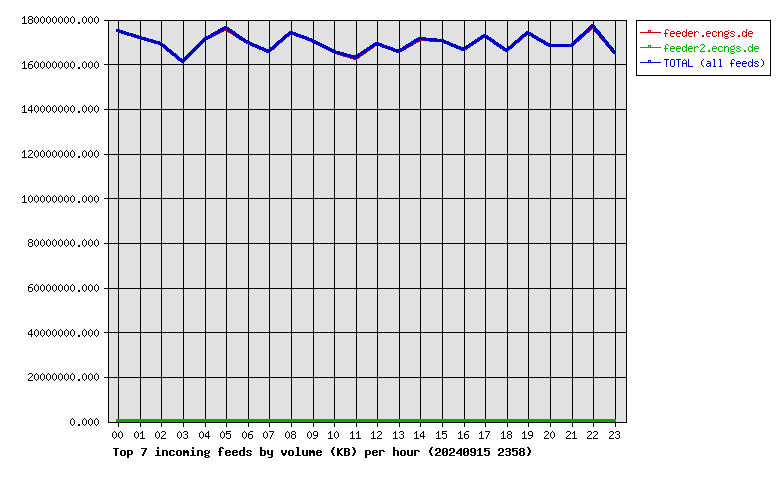
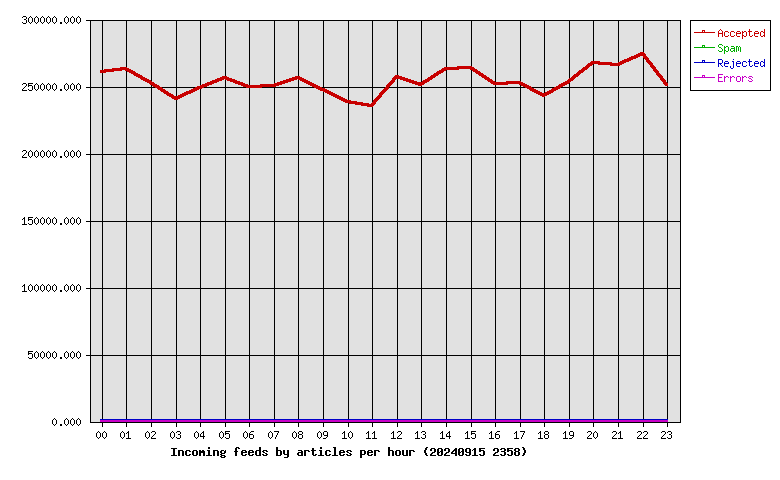
| Hour | Accepted | %Acc | Volume | %Vol | Check | Ihave | Spam | Rejs | Errs |
|---|---|---|---|---|---|---|---|---|---|
| 00 | 260596 | 4.28 | 166.87GB | 4.30 | 286265 | 0 | 0 | 36 | 0 |
| 01 | 262925 | 4.31 | 163.94GB | 4.23 | 283275 | 0 | 0 | 44 | 0 |
| 02 | 252303 | 4.14 | 161.35GB | 4.16 | 270053 | 0 | 0 | 12 | 0 |
| 03 | 240863 | 3.95 | 153.54GB | 3.96 | 257126 | 0 | 0 | 23 | 0 |
| 04 | 249178 | 4.09 | 163.12GB | 4.21 | 262858 | 0 | 0 | 12 | 0 |
| 05 | 256610 | 4.21 | 167.85GB | 4.33 | 289050 | 0 | 0 | 13 | 0 |
| 06 | 249846 | 4.10 | 161.82GB | 4.17 | 263930 | 0 | 0 | 18 | 0 |
| 07 | 250091 | 4.10 | 157.92GB | 4.07 | 270800 | 0 | 0 | 25 | 0 |
| 08 | 256578 | 4.21 | 165.97GB | 4.28 | 273793 | 0 | 0 | 10 | 0 |
| 09 | 247243 | 4.06 | 162.58GB | 4.19 | 261985 | 0 | 0 | 16 | 0 |
| 10 | 238708 | 3.92 | 157.76GB | 4.07 | 253479 | 0 | 0 | 16 | 0 |
| 11 | 235454 | 3.86 | 155.06GB | 4.00 | 252224 | 0 | 0 | 8 | 0 |
| 12 | 257086 | 4.22 | 161.38GB | 4.16 | 280547 | 0 | 0 | 21 | 0 |
| 13 | 251079 | 4.12 | 157.72GB | 4.07 | 273314 | 0 | 0 | 19 | 0 |
| 14 | 263016 | 4.32 | 163.23GB | 4.21 | 290639 | 0 | 0 | 39 | 0 |
| 15 | 263791 | 4.33 | 162.61GB | 4.19 | 288482 | 0 | 0 | 17 | 0 |
| 16 | 252111 | 4.14 | 158.76GB | 4.09 | 274103 | 0 | 0 | 26 | 0 |
| 17 | 252357 | 4.14 | 164.58GB | 4.24 | 269338 | 0 | 0 | 10 | 0 |
| 18 | 242918 | 3.99 | 158.32GB | 4.08 | 263946 | 0 | 0 | 18 | 0 |
| 19 | 253646 | 4.16 | 165.87GB | 4.28 | 271987 | 0 | 0 | 15 | 0 |
| 20 | 267715 | 4.39 | 160.52GB | 4.14 | 308640 | 0 | 0 | 29 | 0 |
| 21 | 265718 | 4.36 | 160.55GB | 4.14 | 304048 | 0 | 0 | 34 | 0 |
| 22 | 274188 | 4.50 | 168.86GB | 4.35 | 309825 | 0 | 0 | 48 | 0 |
| 23 | 250790 | 4.11 | 157.40GB | 4.06 | 275026 | 0 | 0 | 21 | 0 |
| Total | 6094810 | 100.00 | 3.79TB | 100.00 | 6634733 | 0 | 0 | 530 | 0 |
 |
| Outgoing Feed (+ Top1000 #) | Accepted | %Acc | %Tot | Art/sec | Volume | %Vol | KB/art | Dups | Rejs | % Ratio (Out/In) | ||
|---|---|---|---|---|---|---|---|---|---|---|---|---|
| 1 | 217.73.144.40 | 0 | 0.00 | 0.00 | 0.00 | 0.00KB | 0.00 | 0.00 | 6113365 | 0 | … | |
| Total | 0 | 0.00 | 0.00 | 0.00 | 0.00KB | 0.00 | 0.00 | 6113365 | 0 | |||
 |
| Outgoing Feed (+ Top1000 #) | Volume | %Vol | Kbps | Accepted | %Acc | %Tot | KB/art | Dups | Rejs | % Ratio (Out/In) | ||
|---|---|---|---|---|---|---|---|---|---|---|---|---|
| 1 | 217.73.144.40 | 0.00KB | 0.00 | 0.00 | 0 | 0.00 | 0.00 | 0.00 | 6113365 | 0 | … | |
| Total | 0.00KB | 0.00 | 0.00 | 0 | 0.00 | 0.00 | 0.00 | 6113365 | 0 | |||
 |
| Outgoing Feed (+ Top1000 #) | Rej. Vol. | %Vol | Kbps | Accepted | %Acc | %Tot | KB/art | Dups | Rejs | % Ratio (Out/In) | ||
|---|---|---|---|---|---|---|---|---|---|---|---|---|
| 1 | 217.73.144.40 | 0.00KB | 0.00 | 0.00 | 0 | 0.00 | 0.00 | 0.00 | 6113365 | 0 | … | |
| Total | 0.00KB | 0.00 | 0.00 | 0 | 0.00 | 0.00 | 0.00 | 6113365 | 0 | |||
 |
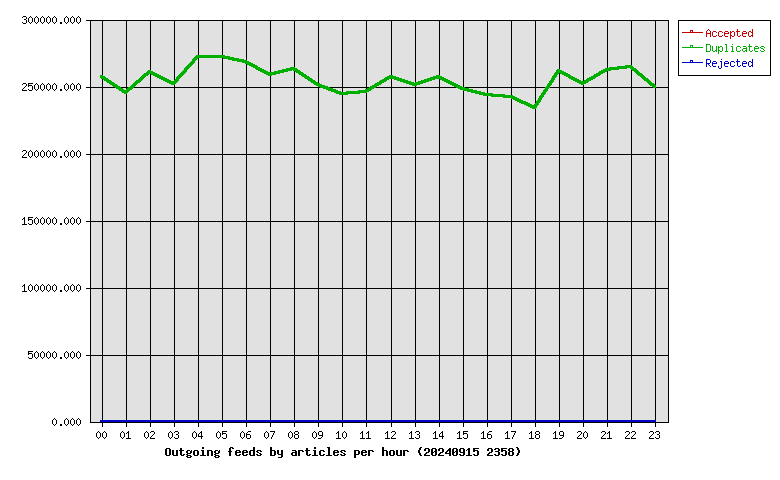
| Hour | Accepted | %Acc | Volume | %Vol | dups | Rejs |
|---|---|---|---|---|---|---|
| 00 | 0 | 0.00 | 0.00KB | 0.00 | 257156 | 0 |
| 01 | 0 | 0.00 | 0.00KB | 0.00 | 245513 | 0 |
| 02 | 0 | 0.00 | 0.00KB | 0.00 | 260485 | 0 |
| 03 | 0 | 0.00 | 0.00KB | 0.00 | 252164 | 0 |
| 04 | 0 | 0.00 | 0.00KB | 0.00 | 271910 | 0 |
| 05 | 0 | 0.00 | 0.00KB | 0.00 | 272331 | 0 |
| 06 | 0 | 0.00 | 0.00KB | 0.00 | 268029 | 0 |
| 07 | 0 | 0.00 | 0.00KB | 0.00 | 258268 | 0 |
| 08 | 0 | 0.00 | 0.00KB | 0.00 | 263114 | 0 |
| 09 | 0 | 0.00 | 0.00KB | 0.00 | 250976 | 0 |
| 10 | 0 | 0.00 | 0.00KB | 0.00 | 244180 | 0 |
| 11 | 0 | 0.00 | 0.00KB | 0.00 | 245956 | 0 |
| 12 | 0 | 0.00 | 0.00KB | 0.00 | 257220 | 0 |
| 13 | 0 | 0.00 | 0.00KB | 0.00 | 251264 | 0 |
| 14 | 0 | 0.00 | 0.00KB | 0.00 | 256829 | 0 |
| 15 | 0 | 0.00 | 0.00KB | 0.00 | 248263 | 0 |
| 16 | 0 | 0.00 | 0.00KB | 0.00 | 243351 | 0 |
| 17 | 0 | 0.00 | 0.00KB | 0.00 | 242047 | 0 |
| 18 | 0 | 0.00 | 0.00KB | 0.00 | 233838 | 0 |
| 19 | 0 | 0.00 | 0.00KB | 0.00 | 261834 | 0 |
| 20 | 0 | 0.00 | 0.00KB | 0.00 | 252143 | 0 |
| 21 | 0 | 0.00 | 0.00KB | 0.00 | 262015 | 0 |
| 22 | 0 | 0.00 | 0.00KB | 0.00 | 264653 | 0 |
| 23 | 0 | 0.00 | 0.00KB | 0.00 | 249826 | 0 |
| Total | 0 | 0.00 | 0.00KB | 0.00 | 6113365 | 0 |
 |
| >= 20% Full | >= 35% Full | >= 50% Full | >= 65% Full | >= 80% Full | >= 95% Full |
| Outgoing Feed | Batch Seq | Batch Num | Batch Max | %Full | Av. Pending |
|---|---|---|---|---|---|
| nbr.elbracht.net-o | 987199-987280 | 81 | 500 | 16 | 0.0 |
| text-spool-out | 0-0 | 0 | 500 | 0 | 0.0 |
| 1st Time | Last Time | # Msgs | Message |
|---|---|---|---|
| 21:33:26 | 21:33:39 | 4 | DNS Fwd/Rev mismatch: lookup of scanner-201.hk2.censys-scanner.com failed |