| |
DIABLO statistics for newsfeed.yoursite.com on Sat 14 Sep 2024 |
Generated on 20240914 2358 by feeder-stats v4.006. Copyright © 2002 The Diablo Project.
Diablo running processes:  81    Dnewslink running processes:  0


11:59PM  up 209 days,  7:18, 0 users, load averages: 1.01, 0.84, 0.90

Filesystem     Size    Used   Avail Capacity  Mounted on
/dev/da0s1g     94G    1.2G     85G     1%    /news
/dev/da1       7.3T    5.8T    953G    86%    /news2/spool/news/00
/dev/da2       7.3T    5.8T    955G    86%    /news2/spool/news/01
/dev/da3       3.7T    3.3T     68G    98%    /news2/spool/news/02
/dev/da4       5.5T    2.9T    2.1T    57%    /news2/spool/news/03
/dev/da8       7.3T    5.8T    954G    86%    /news2/spool/news/04
/dev/da9       7.3T    5.8T    953G    86%    /news2/spool/news/05
/dev/da10      7.3T    5.8T    955G    86%    /news2/spool/news/06
/dev/da11      5.5T      5T     66G    99%    /news2/spool/news/07
/dev/da12      5.5T    4.3T    753G    85%    /news2/spool/news/08
/dev/da13      7.3T    5.8T    955G    86%    /news2/spool/news/09
/dev/da14      7.3T    5.8T    953G    86%    /news2/spool/news/10
/dev/da15      7.3T    5.8T    954G    86%    /news2/spool/news/11
/dev/da16      7.3T    5.8T    951G    86%    /news2/spool/news/12
/dev/da17      7.3T    5.8T    954G    86%    /news2/spool/news/13
/dev/da18      7.3T    5.8T    956G    86%    /news2/spool/news/14
/dev/da19      7.3T    5.8T    958G    86%    /news2/spool/news/15
/dev/da20      7.3T    5.8T    955G    86%    /news2/spool/news/16
/dev/da21      7.3T    5.8T    954G    86%    /news2/spool/news/17
/dev/da22      7.3T    5.8T    956G    86%    /news2/spool/news/18
/dev/da23      7.3T    5.8T    955G    86%    /news2/spool/news/19
/dev/da24      7.3T    5.8T    954G    86%    /news2/spool/news/20
/dev/da25      7.3T    5.8T    954G    86%    /news2/spool/news/21
/dev/da26      7.3T    5.8T    954G    86%    /news2/spool/news/22
/dev/da5       221G     34G    169G    17%    /news1
/dev/md0        40G     12G     23G    35%    /news3
| Incoming Feed (+ Top1000 #) | Accepted | %Acc | %Tot | Art/sec | Volume | %Vol | KB/art | Check | Ihave | Spam | TooOld | Rejs | Errs | ||
|---|---|---|---|---|---|---|---|---|---|---|---|---|---|---|---|
| 1 | feeder.ecngs.de | 5603279 | 92.15 | 92.86 | 64.85 | 3.73TB | 99.92 | 715.22 | 6080226 | 0 | 0 | 0 | 368 | 0 | |
| 2 | feeder2.ecngs.de | 430918 | 90.18 | 7.14 | 5.04 | 3.25GB | 0.08 | 7.90 | 477531 | 0 | 0 | 0 | 294 | 0 | |
| Total | 6034197 | 0.00 | 100.00 | 69.89 | 3.74TB | 100.00 | 664.71 | 6557757 | 0 | 0 | 0 | 662 | 0 | ||
 |
| Incoming Feed (+ Top1000 #) | Volume | %Vol | Kbps | Accepted | %Acc | %Tot | KB/art | Check | Ihave | Spam | TooOld | Rejs | Errs | ||
|---|---|---|---|---|---|---|---|---|---|---|---|---|---|---|---|
| 1 | feeder.ecngs.de | 3.73TB | 99.92 | 371070.56 | 5603279 | 92.15 | 92.86 | 715.22 | 6080226 | 0 | 0 | 0 | 368 | 0 | |
| 2 | feeder2.ecngs.de | 3.25GB | 0.08 | 318.35 | 430918 | 90.18 | 7.14 | 7.90 | 477531 | 0 | 0 | 0 | 294 | 0 | |
| Total | 3.74TB | 100.00 | 371388.91 | 6034197 | 0.00 | 100.00 | 664.71 | 6557757 | 0 | 0 | 0 | 662 | 0 | ||
 |
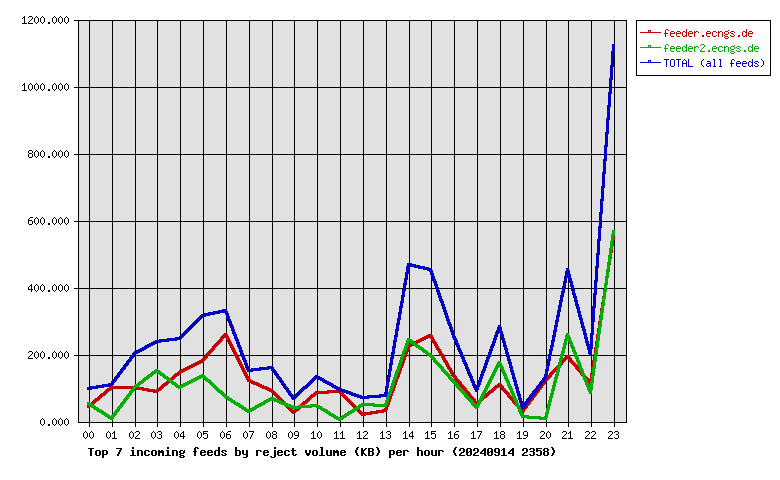
| Incoming Feed (+ Top1000 #) | Rej. Vol. | %Vol | Kbps | Accepted | %Acc | %Tot | KB/art | Check | Ihave | Spam | TooOld | Rejs | Errs | ||
|---|---|---|---|---|---|---|---|---|---|---|---|---|---|---|---|
| 1 | feeder.ecngs.de | 3.09MB | 54.82 | 0.29 | 5603279 | 92.15 | 92.86 | 715.22 | 6080226 | 0 | 0 | 0 | 368 | 0 | |
| 2 | feeder2.ecngs.de | 2.55MB | 45.18 | 0.24 | 430918 | 90.18 | 7.14 | 7.90 | 477531 | 0 | 0 | 0 | 294 | 0 | |
| Total | 5.63MB | 100.00 | 0.54 | 6034197 | 0.00 | 100.00 | 664.71 | 6557757 | 0 | 0 | 0 | 662 | 0 | ||
 |
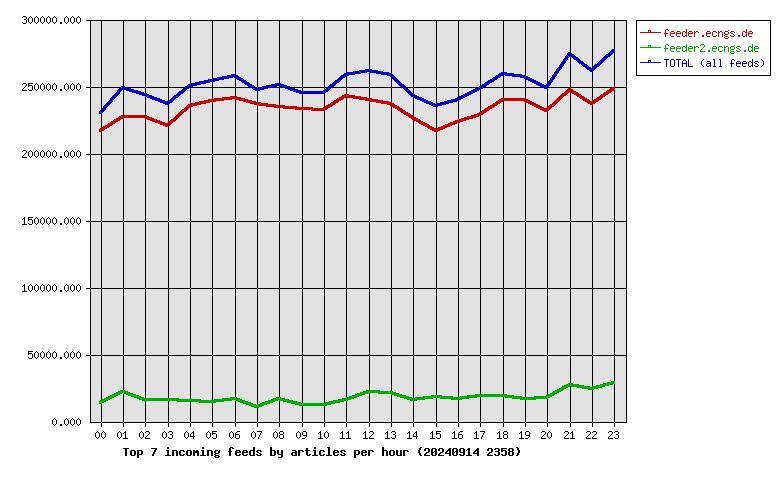
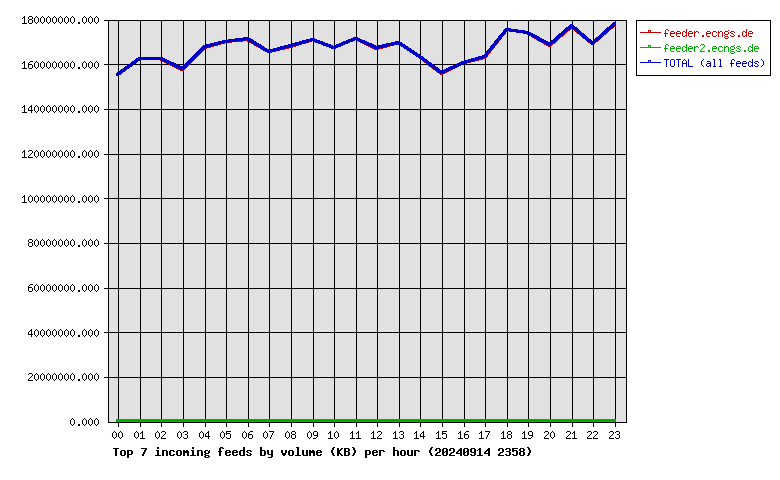
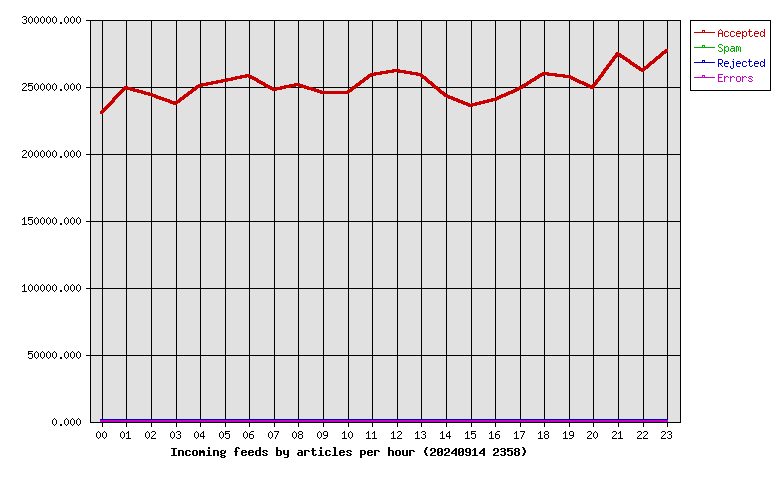
| Hour | Accepted | %Acc | Volume | %Vol | Check | Ihave | Spam | Rejs | Errs |
|---|---|---|---|---|---|---|---|---|---|
| 00 | 230455 | 3.82 | 148.06GB | 3.87 | 247340 | 0 | 0 | 11 | 0 |
| 01 | 248950 | 4.13 | 154.82GB | 4.05 | 273288 | 0 | 0 | 19 | 0 |
| 02 | 243805 | 4.04 | 154.85GB | 4.05 | 264253 | 0 | 0 | 25 | 0 |
| 03 | 236800 | 3.92 | 150.31GB | 3.93 | 253696 | 0 | 0 | 28 | 0 |
| 04 | 250463 | 4.15 | 159.76GB | 4.18 | 269572 | 0 | 0 | 19 | 0 |
| 05 | 253973 | 4.21 | 162.23GB | 4.24 | 286824 | 0 | 0 | 30 | 0 |
| 06 | 257769 | 4.27 | 163.20GB | 4.27 | 277539 | 0 | 0 | 41 | 0 |
| 07 | 247717 | 4.11 | 157.93GB | 4.13 | 260323 | 0 | 0 | 11 | 0 |
| 08 | 251333 | 4.17 | 160.18GB | 4.19 | 270982 | 0 | 0 | 21 | 0 |
| 09 | 245345 | 4.07 | 162.79GB | 4.26 | 259366 | 0 | 0 | 12 | 0 |
| 10 | 245123 | 4.06 | 159.65GB | 4.17 | 258556 | 0 | 0 | 12 | 0 |
| 11 | 258723 | 4.29 | 163.45GB | 4.27 | 278024 | 0 | 0 | 12 | 0 |
| 12 | 261843 | 4.34 | 159.38GB | 4.17 | 286085 | 0 | 0 | 11 | 0 |
| 13 | 258315 | 4.28 | 161.74GB | 4.23 | 284571 | 0 | 0 | 16 | 0 |
| 14 | 242849 | 4.02 | 155.68GB | 4.07 | 261578 | 0 | 0 | 30 | 0 |
| 15 | 235563 | 3.90 | 148.63GB | 3.89 | 256923 | 0 | 0 | 49 | 0 |
| 16 | 240211 | 3.98 | 153.22GB | 4.01 | 261058 | 0 | 0 | 24 | 0 |
| 17 | 247824 | 4.11 | 155.47GB | 4.06 | 268320 | 0 | 0 | 18 | 0 |
| 18 | 259257 | 4.30 | 167.29GB | 4.37 | 282687 | 0 | 0 | 29 | 0 |
| 19 | 256964 | 4.26 | 165.96GB | 4.34 | 276643 | 0 | 0 | 12 | 0 |
| 20 | 248744 | 4.12 | 160.68GB | 4.20 | 269742 | 0 | 0 | 21 | 0 |
| 21 | 274247 | 4.54 | 168.83GB | 4.41 | 305087 | 0 | 0 | 41 | 0 |
| 22 | 261550 | 4.33 | 161.39GB | 4.22 | 290158 | 0 | 0 | 41 | 0 |
| 23 | 276374 | 4.58 | 169.65GB | 4.44 | 315142 | 0 | 0 | 129 | 0 |
| Total | 6034197 | 100.00 | 3.74TB | 100.00 | 6557757 | 0 | 0 | 662 | 0 |
 |
| Outgoing Feed (+ Top1000 #) | Accepted | %Acc | %Tot | Art/sec | Volume | %Vol | KB/art | Dups | Rejs | % Ratio (Out/In) | ||
|---|---|---|---|---|---|---|---|---|---|---|---|---|
| 1 | 217.73.144.40 | 0 | 0.00 | 0.00 | 0.00 | 0.00KB | 0.00 | 0.00 | 5917740 | 0 | … | |
| Total | 0 | 0.00 | 0.00 | 0.00 | 0.00KB | 0.00 | 0.00 | 5917740 | 0 | |||
 |
| Outgoing Feed (+ Top1000 #) | Volume | %Vol | Kbps | Accepted | %Acc | %Tot | KB/art | Dups | Rejs | % Ratio (Out/In) | ||
|---|---|---|---|---|---|---|---|---|---|---|---|---|
| 1 | 217.73.144.40 | 0.00KB | 0.00 | 0.00 | 0 | 0.00 | 0.00 | 0.00 | 5917740 | 0 | … | |
| Total | 0.00KB | 0.00 | 0.00 | 0 | 0.00 | 0.00 | 0.00 | 5917740 | 0 | |||
 |
| Outgoing Feed (+ Top1000 #) | Rej. Vol. | %Vol | Kbps | Accepted | %Acc | %Tot | KB/art | Dups | Rejs | % Ratio (Out/In) | ||
|---|---|---|---|---|---|---|---|---|---|---|---|---|
| 1 | 217.73.144.40 | 0.00KB | 0.00 | 0.00 | 0 | 0.00 | 0.00 | 0.00 | 5917740 | 0 | … | |
| Total | 0.00KB | 0.00 | 0.00 | 0 | 0.00 | 0.00 | 0.00 | 5917740 | 0 | |||
 |
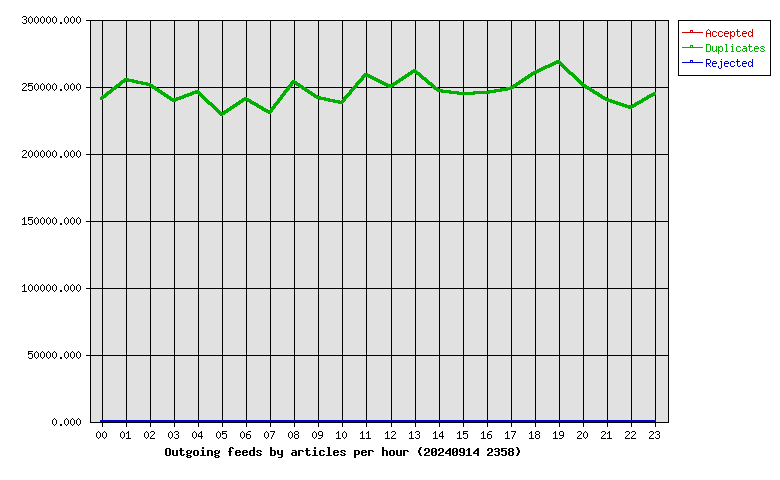
| Hour | Accepted | %Acc | Volume | %Vol | dups | Rejs |
|---|---|---|---|---|---|---|
| 00 | 0 | 0.00 | 0.00KB | 0.00 | 240369 | 0 |
| 01 | 0 | 0.00 | 0.00KB | 0.00 | 254885 | 0 |
| 02 | 0 | 0.00 | 0.00KB | 0.00 | 251388 | 0 |
| 03 | 0 | 0.00 | 0.00KB | 0.00 | 239519 | 0 |
| 04 | 0 | 0.00 | 0.00KB | 0.00 | 246098 | 0 |
| 05 | 0 | 0.00 | 0.00KB | 0.00 | 229103 | 0 |
| 06 | 0 | 0.00 | 0.00KB | 0.00 | 240476 | 0 |
| 07 | 0 | 0.00 | 0.00KB | 0.00 | 230399 | 0 |
| 08 | 0 | 0.00 | 0.00KB | 0.00 | 253512 | 0 |
| 09 | 0 | 0.00 | 0.00KB | 0.00 | 241637 | 0 |
| 10 | 0 | 0.00 | 0.00KB | 0.00 | 237756 | 0 |
| 11 | 0 | 0.00 | 0.00KB | 0.00 | 258453 | 0 |
| 12 | 0 | 0.00 | 0.00KB | 0.00 | 249889 | 0 |
| 13 | 0 | 0.00 | 0.00KB | 0.00 | 261499 | 0 |
| 14 | 0 | 0.00 | 0.00KB | 0.00 | 246599 | 0 |
| 15 | 0 | 0.00 | 0.00KB | 0.00 | 244381 | 0 |
| 16 | 0 | 0.00 | 0.00KB | 0.00 | 245328 | 0 |
| 17 | 0 | 0.00 | 0.00KB | 0.00 | 248435 | 0 |
| 18 | 0 | 0.00 | 0.00KB | 0.00 | 259878 | 0 |
| 19 | 0 | 0.00 | 0.00KB | 0.00 | 268314 | 0 |
| 20 | 0 | 0.00 | 0.00KB | 0.00 | 251072 | 0 |
| 21 | 0 | 0.00 | 0.00KB | 0.00 | 239887 | 0 |
| 22 | 0 | 0.00 | 0.00KB | 0.00 | 234204 | 0 |
| 23 | 0 | 0.00 | 0.00KB | 0.00 | 244659 | 0 |
| Total | 0 | 0.00 | 0.00KB | 0.00 | 5917740 | 0 |
 |
| >= 20% Full | >= 35% Full | >= 50% Full | >= 65% Full | >= 80% Full | >= 95% Full |
| Outgoing Feed | Batch Seq | Batch Num | Batch Max | %Full | Av. Pending |
|---|---|---|---|---|---|
| nbr.elbracht.net-o | 986911-986992 | 81 | 500 | 16 | 0.0 |
| text-spool-out | 0-0 | 0 | 500 | 0 | 0.0 |
| 1st Time | Last Time | # Msgs | Message |
|---|