| |
DIABLO statistics for newsfeed.yoursite.com on Fri 13 Sep 2024 |
Generated on 20240913 2358 by feeder-stats v4.006. Copyright © 2002 The Diablo Project.
Diablo running processes:  81    Dnewslink running processes:  0


11:59PM  up 208 days,  7:18, 0 users, load averages: 1.09, 0.76, 0.67

Filesystem     Size    Used   Avail Capacity  Mounted on
/dev/da0s1g     94G    1.2G     85G     1%    /news
/dev/da1       7.3T    5.8T    962G    86%    /news2/spool/news/00
/dev/da2       7.3T    5.8T    964G    86%    /news2/spool/news/01
/dev/da3       3.7T    3.3T     62G    98%    /news2/spool/news/02
/dev/da4       5.5T    2.9T    2.1T    57%    /news2/spool/news/03
/dev/da8       7.3T    5.8T    963G    86%    /news2/spool/news/04
/dev/da9       7.3T    5.8T    963G    86%    /news2/spool/news/05
/dev/da10      7.3T    5.8T    964G    86%    /news2/spool/news/06
/dev/da11      5.5T      5T     63G    99%    /news2/spool/news/07
/dev/da12      5.5T    4.3T    760G    85%    /news2/spool/news/08
/dev/da13      7.3T    5.8T    965G    86%    /news2/spool/news/09
/dev/da14      7.3T    5.8T    970G    86%    /news2/spool/news/10
/dev/da15      7.3T    5.8T    963G    86%    /news2/spool/news/11
/dev/da16      7.3T    5.8T    960G    86%    /news2/spool/news/12
/dev/da17      7.3T    5.8T    964G    86%    /news2/spool/news/13
/dev/da18      7.3T    5.8T    965G    86%    /news2/spool/news/14
/dev/da19      7.3T    5.8T    959G    86%    /news2/spool/news/15
/dev/da20      7.3T    5.8T    964G    86%    /news2/spool/news/16
/dev/da21      7.3T    5.8T    964G    86%    /news2/spool/news/17
/dev/da22      7.3T    5.8T    966G    86%    /news2/spool/news/18
/dev/da23      7.3T    5.8T    964G    86%    /news2/spool/news/19
/dev/da24      7.3T    5.8T    963G    86%    /news2/spool/news/20
/dev/da25      7.3T    5.8T    964G    86%    /news2/spool/news/21
/dev/da26      7.3T    5.8T    964G    86%    /news2/spool/news/22
/dev/da5       221G     34G    169G    17%    /news1
/dev/md0        40G     12G     23G    35%    /news3
| Incoming Feed (+ Top1000 #) | Accepted | %Acc | %Tot | Art/sec | Volume | %Vol | KB/art | Check | Ihave | Spam | TooOld | Rejs | Errs | ||
|---|---|---|---|---|---|---|---|---|---|---|---|---|---|---|---|
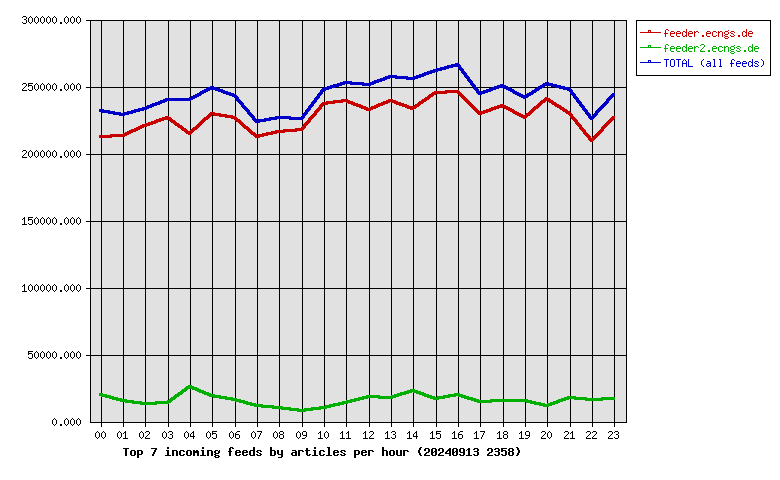
| 1 | feeder.ecngs.de | 5460119 | 92.88 | 93.54 | 63.20 | 3.65TB | 99.93 | 716.93 | 5878610 | 0 | 0 | 0 | 242 | 0 | |
| 2 | feeder2.ecngs.de | 377080 | 88.79 | 6.46 | 4.36 | 2.58GB | 0.07 | 7.17 | 424416 | 0 | 0 | 0 | 253 | 0 | |
| Total | 5837199 | 0.00 | 100.00 | 67.56 | 3.65TB | 100.00 | 671.08 | 6303026 | 0 | 0 | 0 | 495 | 0 | ||
 |
| Incoming Feed (+ Top1000 #) | Volume | %Vol | Kbps | Accepted | %Acc | %Tot | KB/art | Check | Ihave | Spam | TooOld | Rejs | Errs | ||
|---|---|---|---|---|---|---|---|---|---|---|---|---|---|---|---|
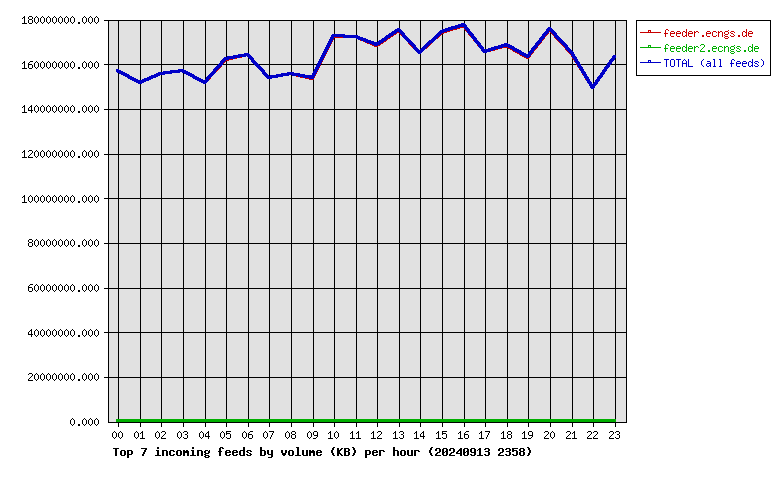
| 1 | feeder.ecngs.de | 3.65TB | 99.93 | 362456.42 | 5460119 | 92.88 | 93.54 | 716.93 | 5878610 | 0 | 0 | 0 | 242 | 0 | |
| 2 | feeder2.ecngs.de | 2.58GB | 0.07 | 250.18 | 377080 | 88.79 | 6.46 | 7.17 | 424416 | 0 | 0 | 0 | 253 | 0 | |
| Total | 3.65TB | 100.00 | 362706.60 | 5837199 | 0.00 | 100.00 | 671.08 | 6303026 | 0 | 0 | 0 | 495 | 0 | ||
 |
| Incoming Feed (+ Top1000 #) | Rej. Vol. | %Vol | Kbps | Accepted | %Acc | %Tot | KB/art | Check | Ihave | Spam | TooOld | Rejs | Errs | ||
|---|---|---|---|---|---|---|---|---|---|---|---|---|---|---|---|
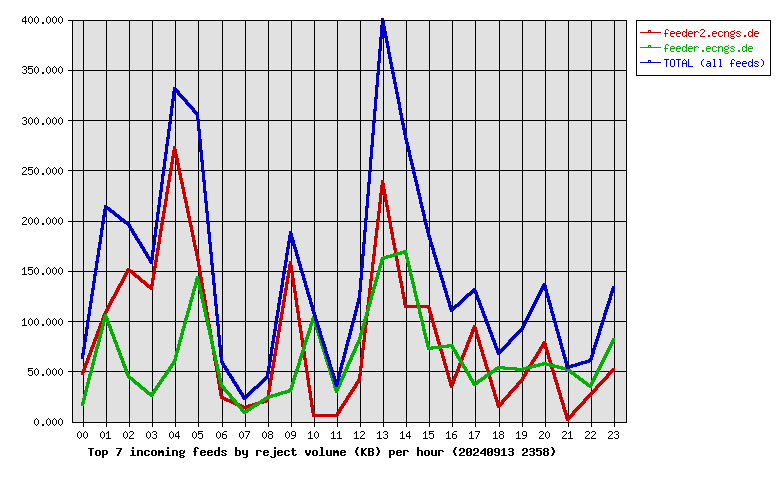
| 1 | feeder2.ecngs.de | 1.90MB | 55.75 | 0.18 | 377080 | 88.79 | 6.46 | 7.17 | 424416 | 0 | 0 | 0 | 253 | 0 | |
| 2 | feeder.ecngs.de | 1.51MB | 44.25 | 0.14 | 5460119 | 92.88 | 93.54 | 716.93 | 5878610 | 0 | 0 | 0 | 242 | 0 | |
| Total | 3.41MB | 100.00 | 0.32 | 5837199 | 0.00 | 100.00 | 671.08 | 6303026 | 0 | 0 | 0 | 495 | 0 | ||
 |
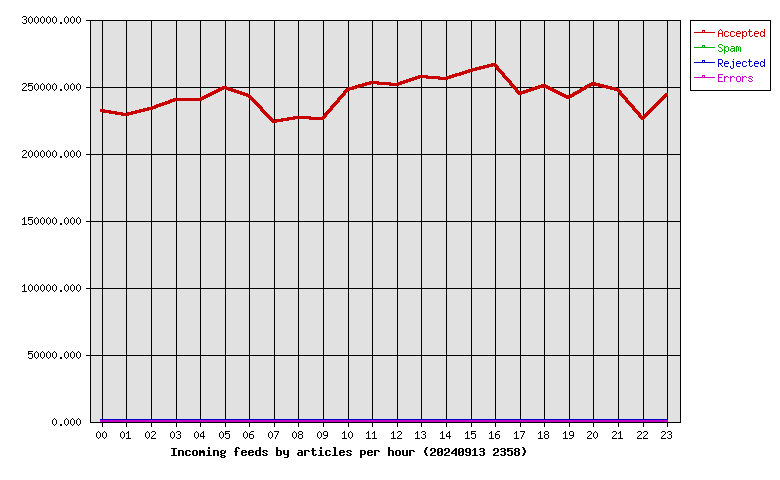
| Hour | Accepted | %Acc | Volume | %Vol | Check | Ihave | Spam | Rejs | Errs |
|---|---|---|---|---|---|---|---|---|---|
| 00 | 232041 | 3.98 | 149.80GB | 4.01 | 253631 | 0 | 0 | 19 | 0 |
| 01 | 228639 | 3.92 | 144.67GB | 3.87 | 248402 | 0 | 0 | 34 | 0 |
| 02 | 233282 | 4.00 | 148.30GB | 3.97 | 248467 | 0 | 0 | 31 | 0 |
| 03 | 240077 | 4.11 | 149.76GB | 4.01 | 256411 | 0 | 0 | 16 | 0 |
| 04 | 240214 | 4.12 | 144.62GB | 3.87 | 279886 | 0 | 0 | 43 | 0 |
| 05 | 248523 | 4.26 | 154.63GB | 4.14 | 287118 | 0 | 0 | 30 | 0 |
| 06 | 242623 | 4.16 | 156.69GB | 4.19 | 261648 | 0 | 0 | 13 | 0 |
| 07 | 223862 | 3.84 | 146.62GB | 3.92 | 236889 | 0 | 0 | 5 | 0 |
| 08 | 226242 | 3.88 | 148.57GB | 3.98 | 237944 | 0 | 0 | 9 | 0 |
| 09 | 225476 | 3.86 | 146.52GB | 3.92 | 235036 | 0 | 0 | 16 | 0 |
| 10 | 247055 | 4.23 | 164.46GB | 4.40 | 258360 | 0 | 0 | 12 | 0 |
| 11 | 252975 | 4.33 | 164.08GB | 4.39 | 268698 | 0 | 0 | 4 | 0 |
| 12 | 250907 | 4.30 | 160.58GB | 4.30 | 271842 | 0 | 0 | 17 | 0 |
| 13 | 256851 | 4.40 | 166.98GB | 4.47 | 276996 | 0 | 0 | 52 | 0 |
| 14 | 255948 | 4.38 | 157.43GB | 4.21 | 281871 | 0 | 0 | 41 | 0 |
| 15 | 261421 | 4.48 | 166.18GB | 4.45 | 281384 | 0 | 0 | 20 | 0 |
| 16 | 265813 | 4.55 | 169.13GB | 4.53 | 288690 | 0 | 0 | 29 | 0 |
| 17 | 244333 | 4.19 | 157.87GB | 4.23 | 261311 | 0 | 0 | 17 | 0 |
| 18 | 250704 | 4.29 | 160.58GB | 4.30 | 267245 | 0 | 0 | 14 | 0 |
| 19 | 241459 | 4.14 | 155.43GB | 4.16 | 259787 | 0 | 0 | 17 | 0 |
| 20 | 252235 | 4.32 | 167.40GB | 4.48 | 265234 | 0 | 0 | 16 | 0 |
| 21 | 247422 | 4.24 | 157.17GB | 4.21 | 267732 | 0 | 0 | 15 | 0 |
| 22 | 225582 | 3.86 | 142.49GB | 3.81 | 245316 | 0 | 0 | 13 | 0 |
| 23 | 243515 | 4.17 | 155.79GB | 4.17 | 263128 | 0 | 0 | 12 | 0 |
| Total | 5837199 | 100.00 | 3.65TB | 100.00 | 6303026 | 0 | 0 | 495 | 0 |
 |
| Outgoing Feed (+ Top1000 #) | Accepted | %Acc | %Tot | Art/sec | Volume | %Vol | KB/art | Dups | Rejs | % Ratio (Out/In) | ||
|---|---|---|---|---|---|---|---|---|---|---|---|---|
| 1 | 217.73.144.40 | 0 | 0.00 | 0.00 | 0.00 | 0.00KB | 0.00 | 0.00 | 5859690 | 0 | … | |
| Total | 0 | 0.00 | 0.00 | 0.00 | 0.00KB | 0.00 | 0.00 | 5859690 | 0 | |||
 |
| Outgoing Feed (+ Top1000 #) | Volume | %Vol | Kbps | Accepted | %Acc | %Tot | KB/art | Dups | Rejs | % Ratio (Out/In) | ||
|---|---|---|---|---|---|---|---|---|---|---|---|---|
| 1 | 217.73.144.40 | 0.00KB | 0.00 | 0.00 | 0 | 0.00 | 0.00 | 0.00 | 5859690 | 0 | … | |
| Total | 0.00KB | 0.00 | 0.00 | 0 | 0.00 | 0.00 | 0.00 | 5859690 | 0 | |||
 |
| Outgoing Feed (+ Top1000 #) | Rej. Vol. | %Vol | Kbps | Accepted | %Acc | %Tot | KB/art | Dups | Rejs | % Ratio (Out/In) | ||
|---|---|---|---|---|---|---|---|---|---|---|---|---|
| 1 | 217.73.144.40 | 0.00KB | 0.00 | 0.00 | 0 | 0.00 | 0.00 | 0.00 | 5859690 | 0 | … | |
| Total | 0.00KB | 0.00 | 0.00 | 0 | 0.00 | 0.00 | 0.00 | 5859690 | 0 | |||
 |
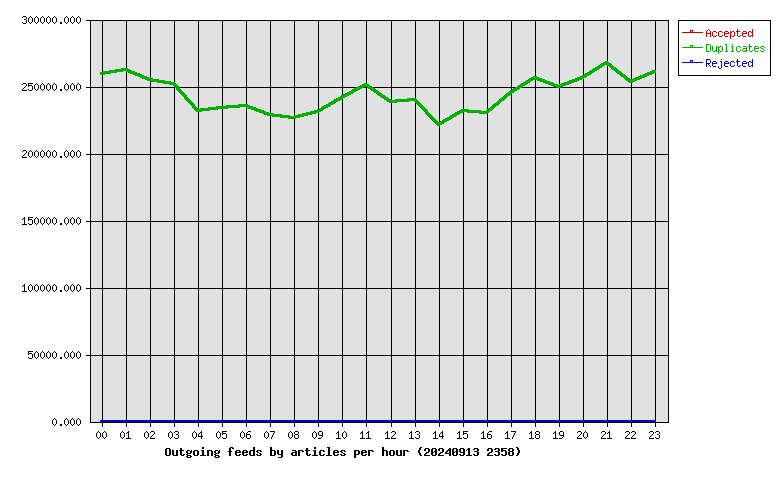
| Hour | Accepted | %Acc | Volume | %Vol | dups | Rejs |
|---|---|---|---|---|---|---|
| 00 | 0 | 0.00 | 0.00KB | 0.00 | 259688 | 0 |
| 01 | 0 | 0.00 | 0.00KB | 0.00 | 261941 | 0 |
| 02 | 0 | 0.00 | 0.00KB | 0.00 | 255041 | 0 |
| 03 | 0 | 0.00 | 0.00KB | 0.00 | 251891 | 0 |
| 04 | 0 | 0.00 | 0.00KB | 0.00 | 231686 | 0 |
| 05 | 0 | 0.00 | 0.00KB | 0.00 | 233589 | 0 |
| 06 | 0 | 0.00 | 0.00KB | 0.00 | 235609 | 0 |
| 07 | 0 | 0.00 | 0.00KB | 0.00 | 228803 | 0 |
| 08 | 0 | 0.00 | 0.00KB | 0.00 | 226647 | 0 |
| 09 | 0 | 0.00 | 0.00KB | 0.00 | 231202 | 0 |
| 10 | 0 | 0.00 | 0.00KB | 0.00 | 241397 | 0 |
| 11 | 0 | 0.00 | 0.00KB | 0.00 | 251189 | 0 |
| 12 | 0 | 0.00 | 0.00KB | 0.00 | 238177 | 0 |
| 13 | 0 | 0.00 | 0.00KB | 0.00 | 239719 | 0 |
| 14 | 0 | 0.00 | 0.00KB | 0.00 | 221514 | 0 |
| 15 | 0 | 0.00 | 0.00KB | 0.00 | 231843 | 0 |
| 16 | 0 | 0.00 | 0.00KB | 0.00 | 230487 | 0 |
| 17 | 0 | 0.00 | 0.00KB | 0.00 | 244963 | 0 |
| 18 | 0 | 0.00 | 0.00KB | 0.00 | 256699 | 0 |
| 19 | 0 | 0.00 | 0.00KB | 0.00 | 249393 | 0 |
| 20 | 0 | 0.00 | 0.00KB | 0.00 | 256287 | 0 |
| 21 | 0 | 0.00 | 0.00KB | 0.00 | 267291 | 0 |
| 22 | 0 | 0.00 | 0.00KB | 0.00 | 253600 | 0 |
| 23 | 0 | 0.00 | 0.00KB | 0.00 | 261034 | 0 |
| Total | 0 | 0.00 | 0.00KB | 0.00 | 5859690 | 0 |
 |
| >= 20% Full | >= 35% Full | >= 50% Full | >= 65% Full | >= 80% Full | >= 95% Full |
| Outgoing Feed | Batch Seq | Batch Num | Batch Max | %Full | Av. Pending |
|---|---|---|---|---|---|
| nbr.elbracht.net-o | 986623-986704 | 81 | 500 | 16 | 0.0 |
| text-spool-out | 0-0 | 0 | 500 | 0 | 0.0 |
| 1st Time | Last Time | # Msgs | Message |
|---|---|---|---|
| 15:22:54 | 15:23:02 | 3 | DNS Fwd/Rev mismatch: lookup of scanner-27.ch1.censys-scanner.com failed |