| |
DIABLO statistics for newsfeed.yoursite.com on Thu 12 Sep 2024 |
Generated on 20240912 2358 by feeder-stats v4.006. Copyright © 2002 The Diablo Project.
Diablo running processes:  81    Dnewslink running processes:  0


11:59PM  up 207 days,  7:18, 0 users, load averages: 1.69, 0.76, 0.55

Filesystem     Size    Used   Avail Capacity  Mounted on
/dev/da0s1g     94G    1.2G     85G     1%    /news
/dev/da1       7.3T    5.8T    969G    86%    /news2/spool/news/00
/dev/da2       7.3T    5.8T    971G    86%    /news2/spool/news/01
/dev/da3       3.7T    3.3T     63G    98%    /news2/spool/news/02
/dev/da4       5.5T    2.9T    2.1T    57%    /news2/spool/news/03
/dev/da8       7.3T    5.8T    971G    86%    /news2/spool/news/04
/dev/da9       7.3T    5.8T    970G    86%    /news2/spool/news/05
/dev/da10      7.3T    5.8T    971G    86%    /news2/spool/news/06
/dev/da11      5.5T      5T     62G    99%    /news2/spool/news/07
/dev/da12      5.5T    4.3T    764G    85%    /news2/spool/news/08
/dev/da13      7.3T    5.8T    972G    86%    /news2/spool/news/09
/dev/da14      7.3T    5.8T    970G    86%    /news2/spool/news/10
/dev/da15      7.3T    5.8T    970G    86%    /news2/spool/news/11
/dev/da16      7.3T    5.8T    967G    86%    /news2/spool/news/12
/dev/da17      7.3T    5.8T    971G    86%    /news2/spool/news/13
/dev/da18      7.3T    5.8T    972G    86%    /news2/spool/news/14
/dev/da19      7.3T    5.8T    966G    86%    /news2/spool/news/15
/dev/da20      7.3T    5.8T    970G    86%    /news2/spool/news/16
/dev/da21      7.3T    5.8T    971G    86%    /news2/spool/news/17
/dev/da22      7.3T    5.8T    980G    86%    /news2/spool/news/18
/dev/da23      7.3T    5.8T    972G    86%    /news2/spool/news/19
/dev/da24      7.3T    5.8T    969G    86%    /news2/spool/news/20
/dev/da25      7.3T    5.8T    970G    86%    /news2/spool/news/21
/dev/da26      7.3T    5.8T    971G    86%    /news2/spool/news/22
/dev/da5       221G     34G    169G    17%    /news1
/dev/md0        40G     12G     23G    35%    /news3
| Incoming Feed (+ Top1000 #) | Accepted | %Acc | %Tot | Art/sec | Volume | %Vol | KB/art | Check | Ihave | Spam | TooOld | Rejs | Errs | ||
|---|---|---|---|---|---|---|---|---|---|---|---|---|---|---|---|
| 1 | feeder.ecngs.de | 5286657 | 91.37 | 92.11 | 61.19 | 3.53TB | 99.93 | 716.28 | 5785964 | 0 | 0 | 0 | 278 | 0 | |
| 2 | feeder2.ecngs.de | 452725 | 90.65 | 7.89 | 5.25 | 2.71GB | 0.07 | 6.27 | 499157 | 0 | 0 | 0 | 276 | 0 | |
| Total | 5739382 | 0.00 | 100.00 | 66.44 | 3.53TB | 100.00 | 660.28 | 6285121 | 0 | 0 | 0 | 554 | 0 | ||
 |
| Incoming Feed (+ Top1000 #) | Volume | %Vol | Kbps | Accepted | %Acc | %Tot | KB/art | Check | Ihave | Spam | TooOld | Rejs | Errs | ||
|---|---|---|---|---|---|---|---|---|---|---|---|---|---|---|---|
| 1 | feeder.ecngs.de | 3.53TB | 99.93 | 350623.90 | 5286657 | 91.37 | 92.11 | 716.28 | 5785964 | 0 | 0 | 0 | 278 | 0 | |
| 2 | feeder2.ecngs.de | 2.71GB | 0.07 | 263.16 | 452725 | 90.65 | 7.89 | 6.27 | 499157 | 0 | 0 | 0 | 276 | 0 | |
| Total | 3.53TB | 100.00 | 350887.06 | 5739382 | 0.00 | 100.00 | 660.28 | 6285121 | 0 | 0 | 0 | 554 | 0 | ||
 |
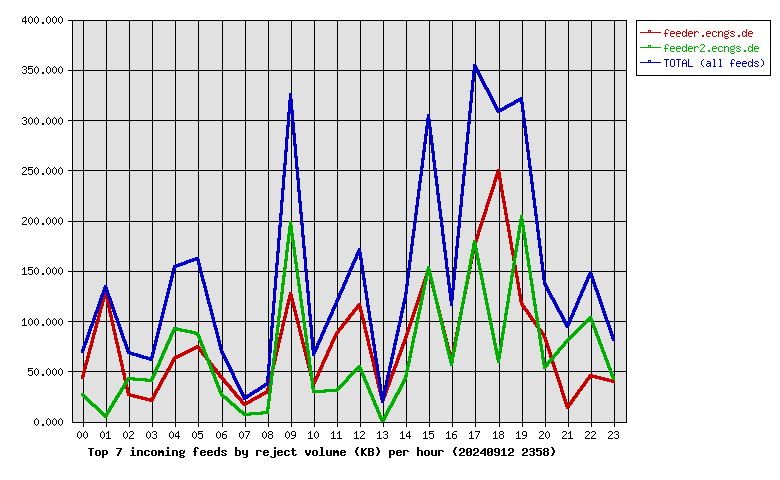
| Incoming Feed (+ Top1000 #) | Rej. Vol. | %Vol | Kbps | Accepted | %Acc | %Tot | KB/art | Check | Ihave | Spam | TooOld | Rejs | Errs | ||
|---|---|---|---|---|---|---|---|---|---|---|---|---|---|---|---|
| 1 | feeder.ecngs.de | 1.80MB | 53.31 | 0.17 | 5286657 | 91.37 | 92.11 | 716.28 | 5785964 | 0 | 0 | 0 | 278 | 0 | |
| 2 | feeder2.ecngs.de | 1.58MB | 46.69 | 0.15 | 452725 | 90.65 | 7.89 | 6.27 | 499157 | 0 | 0 | 0 | 276 | 0 | |
| Total | 3.38MB | 100.00 | 0.32 | 5739382 | 0.00 | 100.00 | 660.28 | 6285121 | 0 | 0 | 0 | 554 | 0 | ||
 |
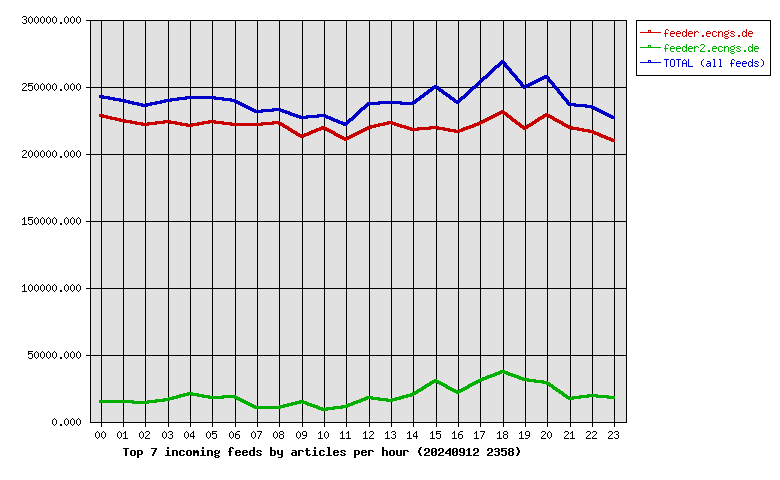
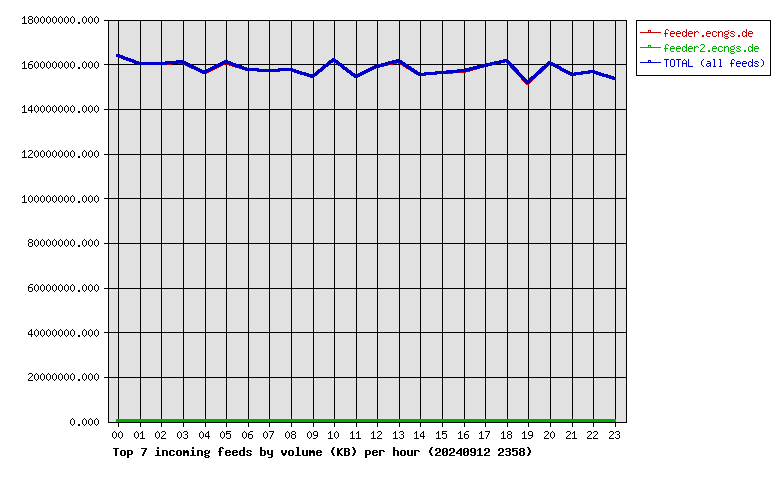
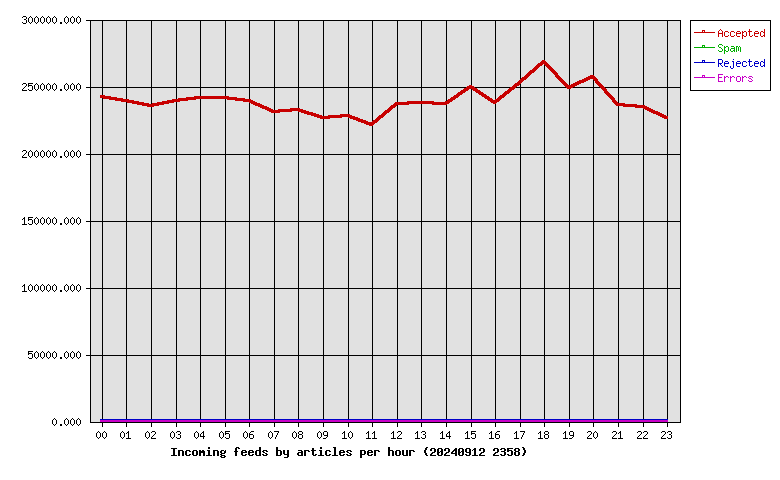
| Hour | Accepted | %Acc | Volume | %Vol | Check | Ihave | Spam | Rejs | Errs |
|---|---|---|---|---|---|---|---|---|---|
| 00 | 242276 | 4.22 | 156.15GB | 4.32 | 262796 | 0 | 0 | 17 | 0 |
| 01 | 239045 | 4.16 | 152.73GB | 4.23 | 255809 | 0 | 0 | 14 | 0 |
| 02 | 235406 | 4.10 | 152.85GB | 4.23 | 251642 | 0 | 0 | 15 | 0 |
| 03 | 239448 | 4.17 | 153.39GB | 4.24 | 257640 | 0 | 0 | 7 | 0 |
| 04 | 241369 | 4.21 | 148.88GB | 4.12 | 264185 | 0 | 0 | 24 | 0 |
| 05 | 241430 | 4.21 | 153.39GB | 4.24 | 279228 | 0 | 0 | 20 | 0 |
| 06 | 239367 | 4.17 | 150.07GB | 4.15 | 260525 | 0 | 0 | 21 | 0 |
| 07 | 231003 | 4.02 | 149.67GB | 4.14 | 242470 | 0 | 0 | 9 | 0 |
| 08 | 232556 | 4.05 | 149.97GB | 4.15 | 243915 | 0 | 0 | 8 | 0 |
| 09 | 226739 | 3.95 | 147.07GB | 4.07 | 243551 | 0 | 0 | 45 | 0 |
| 10 | 227803 | 3.97 | 154.41GB | 4.27 | 237650 | 0 | 0 | 10 | 0 |
| 11 | 221425 | 3.86 | 146.96GB | 4.07 | 233822 | 0 | 0 | 14 | 0 |
| 12 | 236577 | 4.12 | 151.42GB | 4.19 | 256376 | 0 | 0 | 20 | 0 |
| 13 | 237723 | 4.14 | 153.73GB | 4.25 | 255098 | 0 | 0 | 4 | 0 |
| 14 | 237146 | 4.13 | 148.06GB | 4.10 | 258950 | 0 | 0 | 13 | 0 |
| 15 | 249408 | 4.35 | 148.85GB | 4.12 | 285278 | 0 | 0 | 46 | 0 |
| 16 | 237425 | 4.14 | 149.50GB | 4.14 | 262255 | 0 | 0 | 21 | 0 |
| 17 | 252311 | 4.40 | 151.95GB | 4.20 | 288994 | 0 | 0 | 57 | 0 |
| 18 | 268040 | 4.67 | 153.97GB | 4.26 | 311144 | 0 | 0 | 58 | 0 |
| 19 | 248875 | 4.34 | 144.41GB | 4.00 | 284869 | 0 | 0 | 51 | 0 |
| 20 | 256761 | 4.47 | 153.29GB | 4.24 | 289691 | 0 | 0 | 30 | 0 |
| 21 | 235902 | 4.11 | 148.00GB | 4.10 | 255344 | 0 | 0 | 11 | 0 |
| 22 | 234497 | 4.09 | 149.15GB | 4.13 | 257623 | 0 | 0 | 31 | 0 |
| 23 | 226850 | 3.95 | 146.14GB | 4.04 | 246266 | 0 | 0 | 8 | 0 |
| Total | 5739382 | 100.00 | 3.53TB | 100.00 | 6285121 | 0 | 0 | 554 | 0 |
 |
| Outgoing Feed (+ Top1000 #) | Accepted | %Acc | %Tot | Art/sec | Volume | %Vol | KB/art | Dups | Rejs | % Ratio (Out/In) | ||
|---|---|---|---|---|---|---|---|---|---|---|---|---|
| 1 | 217.73.144.40 | 0 | 0.00 | 0.00 | 0.00 | 0.00KB | 0.00 | 0.00 | 5723854 | 0 | … | |
| Total | 0 | 0.00 | 0.00 | 0.00 | 0.00KB | 0.00 | 0.00 | 5723854 | 0 | |||
 |
| Outgoing Feed (+ Top1000 #) | Volume | %Vol | Kbps | Accepted | %Acc | %Tot | KB/art | Dups | Rejs | % Ratio (Out/In) | ||
|---|---|---|---|---|---|---|---|---|---|---|---|---|
| 1 | 217.73.144.40 | 0.00KB | 0.00 | 0.00 | 0 | 0.00 | 0.00 | 0.00 | 5723854 | 0 | … | |
| Total | 0.00KB | 0.00 | 0.00 | 0 | 0.00 | 0.00 | 0.00 | 5723854 | 0 | |||
 |
| Outgoing Feed (+ Top1000 #) | Rej. Vol. | %Vol | Kbps | Accepted | %Acc | %Tot | KB/art | Dups | Rejs | % Ratio (Out/In) | ||
|---|---|---|---|---|---|---|---|---|---|---|---|---|
| 1 | 217.73.144.40 | 0.00KB | 0.00 | 0.00 | 0 | 0.00 | 0.00 | 0.00 | 5723854 | 0 | … | |
| Total | 0.00KB | 0.00 | 0.00 | 0 | 0.00 | 0.00 | 0.00 | 5723854 | 0 | |||
 |
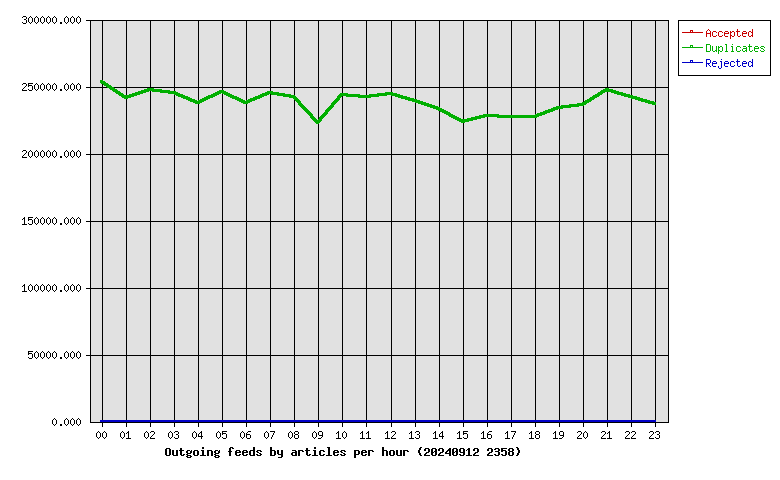
| Hour | Accepted | %Acc | Volume | %Vol | dups | Rejs |
|---|---|---|---|---|---|---|
| 00 | 0 | 0.00 | 0.00KB | 0.00 | 253650 | 0 |
| 01 | 0 | 0.00 | 0.00KB | 0.00 | 241519 | 0 |
| 02 | 0 | 0.00 | 0.00KB | 0.00 | 247572 | 0 |
| 03 | 0 | 0.00 | 0.00KB | 0.00 | 245494 | 0 |
| 04 | 0 | 0.00 | 0.00KB | 0.00 | 237797 | 0 |
| 05 | 0 | 0.00 | 0.00KB | 0.00 | 245715 | 0 |
| 06 | 0 | 0.00 | 0.00KB | 0.00 | 237797 | 0 |
| 07 | 0 | 0.00 | 0.00KB | 0.00 | 245484 | 0 |
| 08 | 0 | 0.00 | 0.00KB | 0.00 | 242056 | 0 |
| 09 | 0 | 0.00 | 0.00KB | 0.00 | 222786 | 0 |
| 10 | 0 | 0.00 | 0.00KB | 0.00 | 243388 | 0 |
| 11 | 0 | 0.00 | 0.00KB | 0.00 | 241860 | 0 |
| 12 | 0 | 0.00 | 0.00KB | 0.00 | 244129 | 0 |
| 13 | 0 | 0.00 | 0.00KB | 0.00 | 239222 | 0 |
| 14 | 0 | 0.00 | 0.00KB | 0.00 | 232997 | 0 |
| 15 | 0 | 0.00 | 0.00KB | 0.00 | 223487 | 0 |
| 16 | 0 | 0.00 | 0.00KB | 0.00 | 227650 | 0 |
| 17 | 0 | 0.00 | 0.00KB | 0.00 | 227510 | 0 |
| 18 | 0 | 0.00 | 0.00KB | 0.00 | 227568 | 0 |
| 19 | 0 | 0.00 | 0.00KB | 0.00 | 233992 | 0 |
| 20 | 0 | 0.00 | 0.00KB | 0.00 | 236048 | 0 |
| 21 | 0 | 0.00 | 0.00KB | 0.00 | 247143 | 0 |
| 22 | 0 | 0.00 | 0.00KB | 0.00 | 242319 | 0 |
| 23 | 0 | 0.00 | 0.00KB | 0.00 | 236671 | 0 |
| Total | 0 | 0.00 | 0.00KB | 0.00 | 5723854 | 0 |
 |
| >= 20% Full | >= 35% Full | >= 50% Full | >= 65% Full | >= 80% Full | >= 95% Full |
| Outgoing Feed | Batch Seq | Batch Num | Batch Max | %Full | Av. Pending |
|---|---|---|---|---|---|
| nbr.elbracht.net-o | 986335-986416 | 81 | 500 | 16 | 0.0 |
| text-spool-out | 0-0 | 0 | 500 | 0 | 0.0 |
| 1st Time | Last Time | # Msgs | Message |
|---|