| |
DIABLO statistics for newsfeed.yoursite.com on Wed 11 Sep 2024 |
Generated on 20240911 2358 by feeder-stats v4.006. Copyright © 2002 The Diablo Project.
Diablo running processes:  81    Dnewslink running processes:  0


11:59PM  up 206 days,  7:18, 0 users, load averages: 1.91, 0.85, 0.57

Filesystem     Size    Used   Avail Capacity  Mounted on
/dev/da0s1g     94G    1.2G     85G     1%    /news
/dev/da1       7.3T    5.8T    973G    86%    /news2/spool/news/00
/dev/da2       7.3T    5.8T    974G    86%    /news2/spool/news/01
/dev/da3       3.7T    3.3T     65G    98%    /news2/spool/news/02
/dev/da4       5.5T    2.9T    2.1T    57%    /news2/spool/news/03
/dev/da8       7.3T    5.8T    974G    86%    /news2/spool/news/04
/dev/da9       7.3T    5.8T    973G    86%    /news2/spool/news/05
/dev/da10      7.3T    5.8T    974G    86%    /news2/spool/news/06
/dev/da11      5.5T      5T     65G    99%    /news2/spool/news/07
/dev/da12      5.5T    4.3T    766G    85%    /news2/spool/news/08
/dev/da13      7.3T    5.8T    975G    86%    /news2/spool/news/09
/dev/da14      7.3T    5.8T    972G    86%    /news2/spool/news/10
/dev/da15      7.3T    5.8T    972G    86%    /news2/spool/news/11
/dev/da16      7.3T    5.8T    970G    86%    /news2/spool/news/12
/dev/da17      7.3T    5.8T    973G    86%    /news2/spool/news/13
/dev/da18      7.3T    5.7T    981G    86%    /news2/spool/news/14
/dev/da19      7.3T    5.8T    970G    86%    /news2/spool/news/15
/dev/da20      7.3T    5.8T    973G    86%    /news2/spool/news/16
/dev/da21      7.3T    5.8T    974G    86%    /news2/spool/news/17
/dev/da22      7.3T    5.8T    976G    86%    /news2/spool/news/18
/dev/da23      7.3T    5.8T    975G    86%    /news2/spool/news/19
/dev/da24      7.3T    5.8T    972G    86%    /news2/spool/news/20
/dev/da25      7.3T    5.8T    973G    86%    /news2/spool/news/21
/dev/da26      7.3T    5.8T    973G    86%    /news2/spool/news/22
/dev/da5       221G     34G    169G    17%    /news1
/dev/md0        40G     12G     23G    35%    /news3
| Incoming Feed (+ Top1000 #) | Accepted | %Acc | %Tot | Art/sec | Volume | %Vol | KB/art | Check | Ihave | Spam | TooOld | Rejs | Errs | ||
|---|---|---|---|---|---|---|---|---|---|---|---|---|---|---|---|
| 1 | feeder.ecngs.de | 5548583 | 93.74 | 94.21 | 64.22 | 3.76TB | 99.94 | 727.48 | 5919082 | 0 | 0 | 0 | 221 | 0 | |
| 2 | feeder2.ecngs.de | 340855 | 90.42 | 5.79 | 3.98 | 2.31GB | 0.06 | 7.10 | 376781 | 0 | 0 | 0 | 175 | 0 | |
| Total | 5889438 | 0.00 | 100.00 | 68.20 | 3.76TB | 100.00 | 685.78 | 6295863 | 0 | 0 | 0 | 396 | 0 | ||
 |
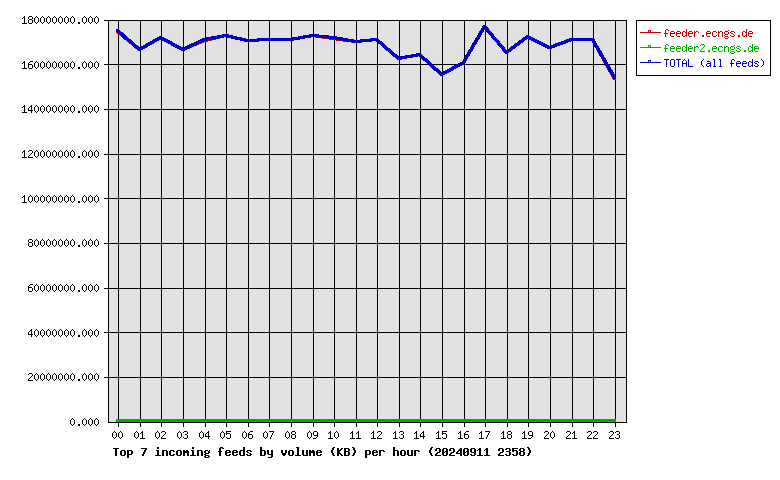
| Incoming Feed (+ Top1000 #) | Volume | %Vol | Kbps | Accepted | %Acc | %Tot | KB/art | Check | Ihave | Spam | TooOld | Rejs | Errs | ||
|---|---|---|---|---|---|---|---|---|---|---|---|---|---|---|---|
| 1 | feeder.ecngs.de | 3.76TB | 99.94 | 373746.46 | 5548583 | 93.74 | 94.21 | 727.48 | 5919082 | 0 | 0 | 0 | 221 | 0 | |
| 2 | feeder2.ecngs.de | 2.31GB | 0.06 | 225.74 | 340855 | 90.42 | 5.79 | 7.10 | 376781 | 0 | 0 | 0 | 175 | 0 | |
| Total | 3.76TB | 100.00 | 373972.20 | 5889438 | 0.00 | 100.00 | 685.78 | 6295863 | 0 | 0 | 0 | 396 | 0 | ||
 |
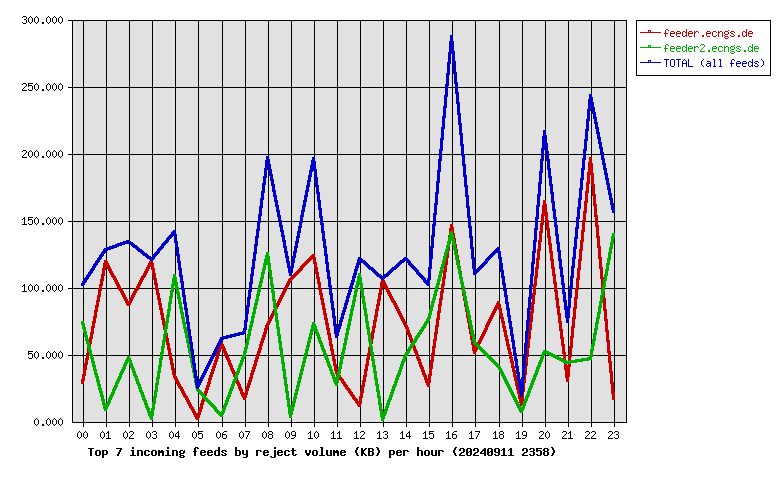
| Incoming Feed (+ Top1000 #) | Rej. Vol. | %Vol | Kbps | Accepted | %Acc | %Tot | KB/art | Check | Ihave | Spam | TooOld | Rejs | Errs | ||
|---|---|---|---|---|---|---|---|---|---|---|---|---|---|---|---|
| 1 | feeder.ecngs.de | 1.68MB | 56.78 | 0.16 | 5548583 | 93.74 | 94.21 | 727.48 | 5919082 | 0 | 0 | 0 | 221 | 0 | |
| 2 | feeder2.ecngs.de | 1.28MB | 43.22 | 0.12 | 340855 | 90.42 | 5.79 | 7.10 | 376781 | 0 | 0 | 0 | 175 | 0 | |
| Total | 2.96MB | 100.00 | 0.28 | 5889438 | 0.00 | 100.00 | 685.78 | 6295863 | 0 | 0 | 0 | 396 | 0 | ||
 |
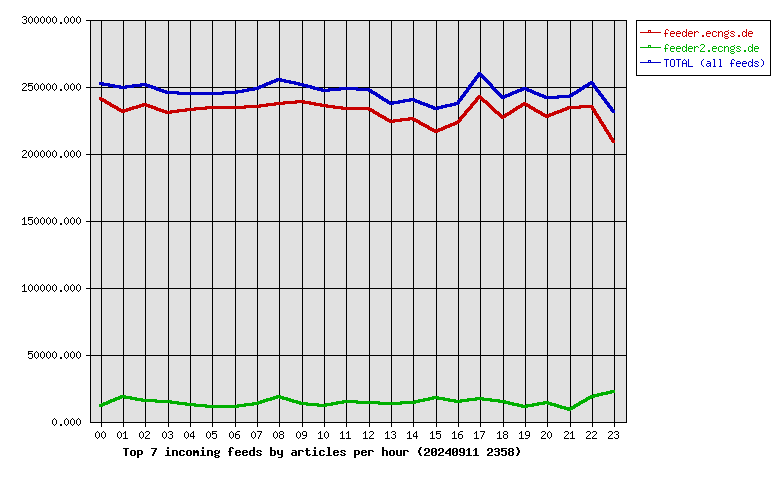
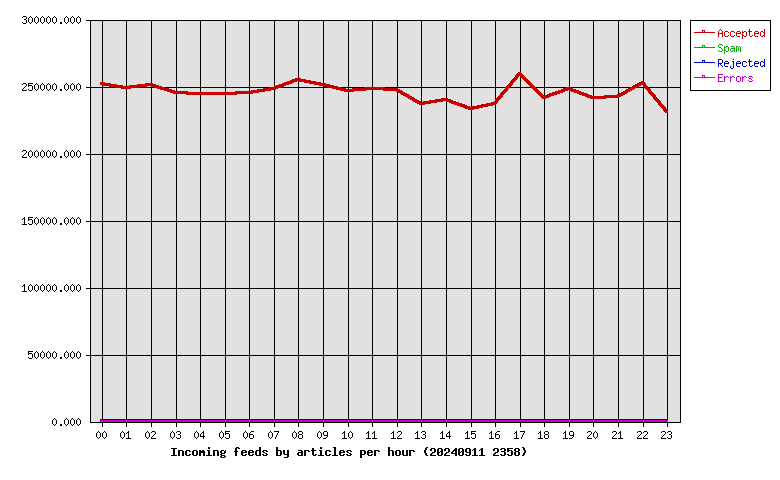
| Hour | Accepted | %Acc | Volume | %Vol | Check | Ihave | Spam | Rejs | Errs |
|---|---|---|---|---|---|---|---|---|---|
| 00 | 251912 | 4.28 | 166.58GB | 4.32 | 263920 | 0 | 0 | 18 | 0 |
| 01 | 248768 | 4.22 | 158.71GB | 4.12 | 269880 | 0 | 0 | 20 | 0 |
| 02 | 251457 | 4.27 | 163.85GB | 4.25 | 270747 | 0 | 0 | 16 | 0 |
| 03 | 244777 | 4.16 | 158.81GB | 4.12 | 261257 | 0 | 0 | 13 | 0 |
| 04 | 244631 | 4.15 | 162.72GB | 4.22 | 258385 | 0 | 0 | 22 | 0 |
| 05 | 244510 | 4.15 | 164.71GB | 4.28 | 268872 | 0 | 0 | 5 | 0 |
| 06 | 245326 | 4.17 | 162.67GB | 4.22 | 257015 | 0 | 0 | 10 | 0 |
| 07 | 247986 | 4.21 | 162.98GB | 4.23 | 264015 | 0 | 0 | 15 | 0 |
| 08 | 254956 | 4.33 | 163.02GB | 4.23 | 276782 | 0 | 0 | 32 | 0 |
| 09 | 251257 | 4.27 | 164.48GB | 4.27 | 265926 | 0 | 0 | 9 | 0 |
| 10 | 246509 | 4.19 | 163.59GB | 4.25 | 259157 | 0 | 0 | 22 | 0 |
| 11 | 248067 | 4.21 | 161.97GB | 4.20 | 264740 | 0 | 0 | 8 | 0 |
| 12 | 247183 | 4.20 | 162.87GB | 4.23 | 262841 | 0 | 0 | 11 | 0 |
| 13 | 236752 | 4.02 | 154.88GB | 4.02 | 250650 | 0 | 0 | 14 | 0 |
| 14 | 239870 | 4.07 | 156.41GB | 4.06 | 257000 | 0 | 0 | 12 | 0 |
| 15 | 233043 | 3.96 | 148.06GB | 3.84 | 253201 | 0 | 0 | 11 | 0 |
| 16 | 237214 | 4.03 | 153.23GB | 3.98 | 255823 | 0 | 0 | 40 | 0 |
| 17 | 259225 | 4.40 | 168.55GB | 4.38 | 278564 | 0 | 0 | 15 | 0 |
| 18 | 241297 | 4.10 | 157.38GB | 4.09 | 259306 | 0 | 0 | 13 | 0 |
| 19 | 247826 | 4.21 | 164.12GB | 4.26 | 260354 | 0 | 0 | 6 | 0 |
| 20 | 241118 | 4.09 | 159.47GB | 4.14 | 257155 | 0 | 0 | 29 | 0 |
| 21 | 242201 | 4.11 | 163.08GB | 4.23 | 252060 | 0 | 0 | 9 | 0 |
| 22 | 252663 | 4.29 | 163.06GB | 4.23 | 273566 | 0 | 0 | 32 | 0 |
| 23 | 230890 | 3.92 | 146.59GB | 3.81 | 254647 | 0 | 0 | 14 | 0 |
| Total | 5889438 | 100.00 | 3.76TB | 100.00 | 6295863 | 0 | 0 | 396 | 0 |
 |
| Outgoing Feed (+ Top1000 #) | Accepted | %Acc | %Tot | Art/sec | Volume | %Vol | KB/art | Dups | Rejs | % Ratio (Out/In) | ||
|---|---|---|---|---|---|---|---|---|---|---|---|---|
| 1 | 217.73.144.40 | 0 | 0.00 | 0.00 | 0.00 | 0.00KB | 0.00 | 0.00 | 5894064 | 0 | … | |
| Total | 0 | 0.00 | 0.00 | 0.00 | 0.00KB | 0.00 | 0.00 | 5894064 | 0 | |||
 |
| Outgoing Feed (+ Top1000 #) | Volume | %Vol | Kbps | Accepted | %Acc | %Tot | KB/art | Dups | Rejs | % Ratio (Out/In) | ||
|---|---|---|---|---|---|---|---|---|---|---|---|---|
| 1 | 217.73.144.40 | 0.00KB | 0.00 | 0.00 | 0 | 0.00 | 0.00 | 0.00 | 5894064 | 0 | … | |
| Total | 0.00KB | 0.00 | 0.00 | 0 | 0.00 | 0.00 | 0.00 | 5894064 | 0 | |||
 |
| Outgoing Feed (+ Top1000 #) | Rej. Vol. | %Vol | Kbps | Accepted | %Acc | %Tot | KB/art | Dups | Rejs | % Ratio (Out/In) | ||
|---|---|---|---|---|---|---|---|---|---|---|---|---|
| 1 | 217.73.144.40 | 0.00KB | 0.00 | 0.00 | 0 | 0.00 | 0.00 | 0.00 | 5894064 | 0 | … | |
| Total | 0.00KB | 0.00 | 0.00 | 0 | 0.00 | 0.00 | 0.00 | 5894064 | 0 | |||
 |
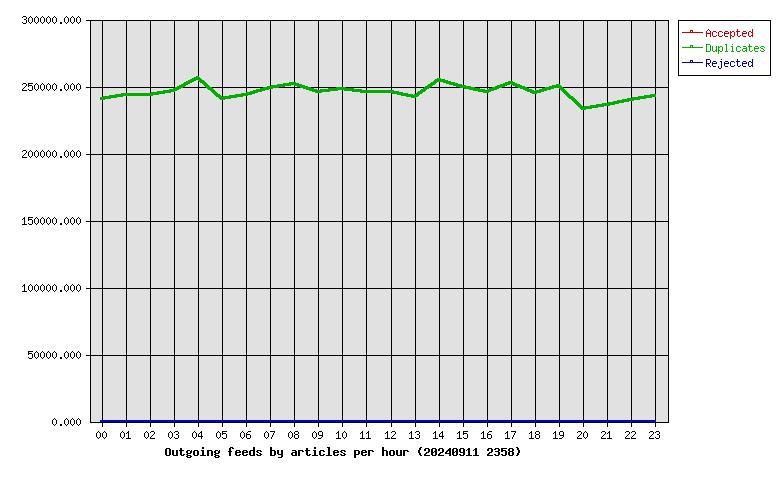
| Hour | Accepted | %Acc | Volume | %Vol | dups | Rejs |
|---|---|---|---|---|---|---|
| 00 | 0 | 0.00 | 0.00KB | 0.00 | 241018 | 0 |
| 01 | 0 | 0.00 | 0.00KB | 0.00 | 243553 | 0 |
| 02 | 0 | 0.00 | 0.00KB | 0.00 | 243912 | 0 |
| 03 | 0 | 0.00 | 0.00KB | 0.00 | 246732 | 0 |
| 04 | 0 | 0.00 | 0.00KB | 0.00 | 256100 | 0 |
| 05 | 0 | 0.00 | 0.00KB | 0.00 | 240374 | 0 |
| 06 | 0 | 0.00 | 0.00KB | 0.00 | 243628 | 0 |
| 07 | 0 | 0.00 | 0.00KB | 0.00 | 249250 | 0 |
| 08 | 0 | 0.00 | 0.00KB | 0.00 | 251493 | 0 |
| 09 | 0 | 0.00 | 0.00KB | 0.00 | 245926 | 0 |
| 10 | 0 | 0.00 | 0.00KB | 0.00 | 248170 | 0 |
| 11 | 0 | 0.00 | 0.00KB | 0.00 | 245762 | 0 |
| 12 | 0 | 0.00 | 0.00KB | 0.00 | 245816 | 0 |
| 13 | 0 | 0.00 | 0.00KB | 0.00 | 242211 | 0 |
| 14 | 0 | 0.00 | 0.00KB | 0.00 | 255125 | 0 |
| 15 | 0 | 0.00 | 0.00KB | 0.00 | 249410 | 0 |
| 16 | 0 | 0.00 | 0.00KB | 0.00 | 246017 | 0 |
| 17 | 0 | 0.00 | 0.00KB | 0.00 | 252696 | 0 |
| 18 | 0 | 0.00 | 0.00KB | 0.00 | 245162 | 0 |
| 19 | 0 | 0.00 | 0.00KB | 0.00 | 250269 | 0 |
| 20 | 0 | 0.00 | 0.00KB | 0.00 | 232857 | 0 |
| 21 | 0 | 0.00 | 0.00KB | 0.00 | 236217 | 0 |
| 22 | 0 | 0.00 | 0.00KB | 0.00 | 239689 | 0 |
| 23 | 0 | 0.00 | 0.00KB | 0.00 | 242677 | 0 |
| Total | 0 | 0.00 | 0.00KB | 0.00 | 5894064 | 0 |
 |
| >= 20% Full | >= 35% Full | >= 50% Full | >= 65% Full | >= 80% Full | >= 95% Full |
| Outgoing Feed | Batch Seq | Batch Num | Batch Max | %Full | Av. Pending |
|---|---|---|---|---|---|
| nbr.elbracht.net-o | 986047-986128 | 81 | 500 | 16 | 0.0 |
| text-spool-out | 0-0 | 0 | 500 | 0 | 0.0 |
| 1st Time | Last Time | # Msgs | Message |
|---|