| |
DIABLO statistics for newsfeed.yoursite.com on Tue 10 Sep 2024 |
Generated on 20240910 2358 by feeder-stats v4.006. Copyright © 2002 The Diablo Project.
Diablo running processes:  81    Dnewslink running processes:  0


11:59PM  up 205 days,  7:18, 0 users, load averages: 1.58, 1.29, 0.98

Filesystem     Size    Used   Avail Capacity  Mounted on
/dev/da0s1g     94G    1.2G     85G     1%    /news
/dev/da1       7.3T    5.7T    985G    86%    /news2/spool/news/00
/dev/da2       7.3T    5.7T    986G    86%    /news2/spool/news/01
/dev/da3       3.7T    3.3T     63G    98%    /news2/spool/news/02
/dev/da4       5.5T    2.9T    2.2T    57%    /news2/spool/news/03
/dev/da8       7.3T    5.7T    986G    86%    /news2/spool/news/04
/dev/da9       7.3T    5.7T    986G    86%    /news2/spool/news/05
/dev/da10      7.3T    5.7T    986G    86%    /news2/spool/news/06
/dev/da11      5.5T      5T     66G    99%    /news2/spool/news/07
/dev/da12      5.5T    4.3T    775G    85%    /news2/spool/news/08
/dev/da13      7.3T    5.7T    987G    86%    /news2/spool/news/09
/dev/da14      7.3T    5.7T    986G    86%    /news2/spool/news/10
/dev/da15      7.3T    5.7T    985G    86%    /news2/spool/news/11
/dev/da16      7.3T    5.7T    983G    86%    /news2/spool/news/12
/dev/da17      7.3T    5.7T    986G    86%    /news2/spool/news/13
/dev/da18      7.3T    5.7T    987G    86%    /news2/spool/news/14
/dev/da19      7.3T    5.7T    982G    86%    /news2/spool/news/15
/dev/da20      7.3T    5.7T    986G    86%    /news2/spool/news/16
/dev/da21      7.3T    5.7T    985G    86%    /news2/spool/news/17
/dev/da22      7.3T    5.7T    995G    85%    /news2/spool/news/18
/dev/da23      7.3T    5.7T    988G    86%    /news2/spool/news/19
/dev/da24      7.3T    5.7T    985G    86%    /news2/spool/news/20
/dev/da25      7.3T    5.7T    984G    86%    /news2/spool/news/21
/dev/da26      7.3T    5.7T    984G    86%    /news2/spool/news/22
/dev/da5       221G     34G    169G    17%    /news1
/dev/md0        40G     12G     23G    35%    /news3
| Incoming Feed (+ Top1000 #) | Accepted | %Acc | %Tot | Art/sec | Volume | %Vol | KB/art | Check | Ihave | Spam | TooOld | Rejs | Errs | ||
|---|---|---|---|---|---|---|---|---|---|---|---|---|---|---|---|
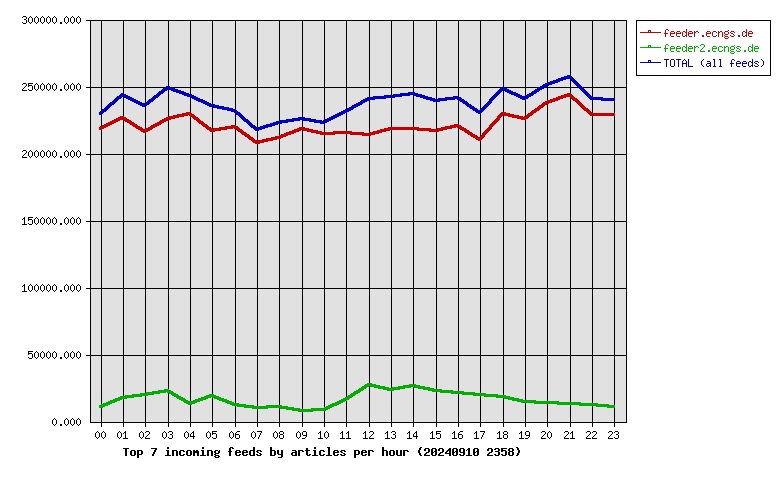
| 1 | feeder.ecngs.de | 5310472 | 92.62 | 93.14 | 61.46 | 3.59TB | 99.92 | 726.49 | 5733599 | 0 | 0 | 0 | 233 | 0 | |
| 2 | feeder2.ecngs.de | 391357 | 90.74 | 6.86 | 4.53 | 2.94GB | 0.08 | 7.88 | 431035 | 0 | 0 | 0 | 239 | 0 | |
| Total | 5701829 | 0.00 | 100.00 | 66.00 | 3.60TB | 100.00 | 677.17 | 6164634 | 0 | 0 | 0 | 472 | 0 | ||
 |
| Incoming Feed (+ Top1000 #) | Volume | %Vol | Kbps | Accepted | %Acc | %Tot | KB/art | Check | Ihave | Spam | TooOld | Rejs | Errs | ||
|---|---|---|---|---|---|---|---|---|---|---|---|---|---|---|---|
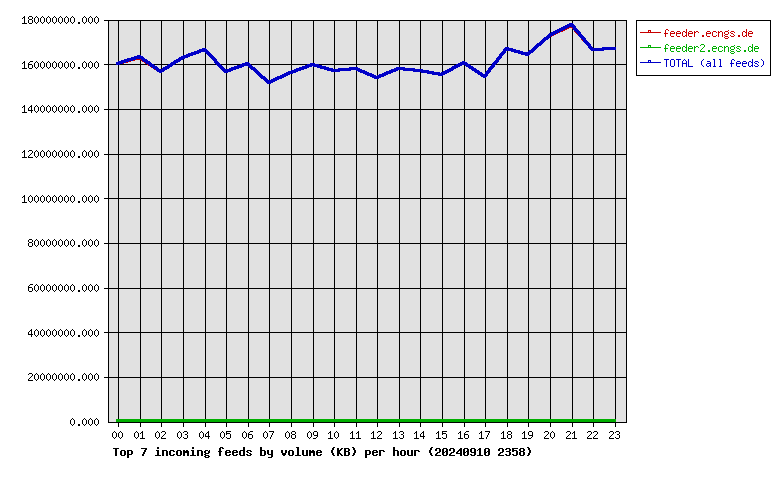
| 1 | feeder.ecngs.de | 3.59TB | 99.92 | 357221.69 | 5310472 | 92.62 | 93.14 | 726.49 | 5733599 | 0 | 0 | 0 | 233 | 0 | |
| 2 | feeder2.ecngs.de | 2.94GB | 0.08 | 285.90 | 391357 | 90.74 | 6.86 | 7.88 | 431035 | 0 | 0 | 0 | 239 | 0 | |
| Total | 3.60TB | 100.00 | 357507.58 | 5701829 | 0.00 | 100.00 | 677.17 | 6164634 | 0 | 0 | 0 | 472 | 0 | ||
 |
| Incoming Feed (+ Top1000 #) | Rej. Vol. | %Vol | Kbps | Accepted | %Acc | %Tot | KB/art | Check | Ihave | Spam | TooOld | Rejs | Errs | ||
|---|---|---|---|---|---|---|---|---|---|---|---|---|---|---|---|
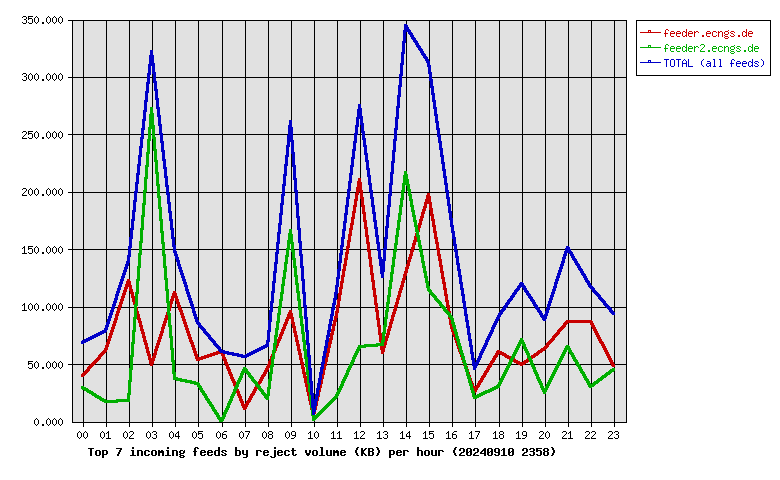
| 1 | feeder.ecngs.de | 1.80MB | 55.22 | 0.17 | 5310472 | 92.62 | 93.14 | 726.49 | 5733599 | 0 | 0 | 0 | 233 | 0 | |
| 2 | feeder2.ecngs.de | 1.46MB | 44.78 | 0.14 | 391357 | 90.74 | 6.86 | 7.88 | 431035 | 0 | 0 | 0 | 239 | 0 | |
| Total | 3.27MB | 100.00 | 0.31 | 5701829 | 0.00 | 100.00 | 677.17 | 6164634 | 0 | 0 | 0 | 472 | 0 | ||
 |
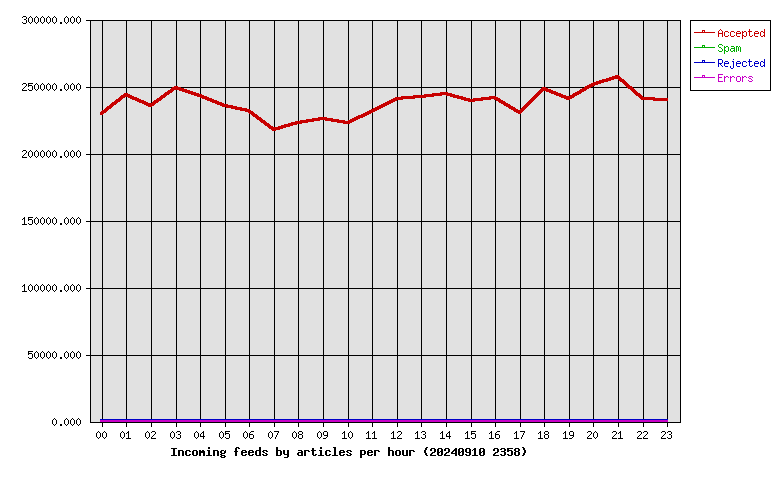
| Hour | Accepted | %Acc | Volume | %Vol | Check | Ihave | Spam | Rejs | Errs |
|---|---|---|---|---|---|---|---|---|---|
| 00 | 229546 | 4.03 | 152.59GB | 4.14 | 243871 | 0 | 0 | 18 | 0 |
| 01 | 243331 | 4.27 | 155.54GB | 4.22 | 261983 | 0 | 0 | 13 | 0 |
| 02 | 235463 | 4.13 | 149.40GB | 4.06 | 258227 | 0 | 0 | 14 | 0 |
| 03 | 248592 | 4.36 | 155.17GB | 4.21 | 273792 | 0 | 0 | 56 | 0 |
| 04 | 242565 | 4.25 | 158.70GB | 4.31 | 258119 | 0 | 0 | 15 | 0 |
| 05 | 235174 | 4.12 | 149.32GB | 4.06 | 267806 | 0 | 0 | 27 | 0 |
| 06 | 231837 | 4.07 | 152.61GB | 4.14 | 245587 | 0 | 0 | 6 | 0 |
| 07 | 217554 | 3.82 | 144.66GB | 3.93 | 229381 | 0 | 0 | 11 | 0 |
| 08 | 222427 | 3.90 | 148.99GB | 4.05 | 234064 | 0 | 0 | 10 | 0 |
| 09 | 225926 | 3.96 | 152.16GB | 4.13 | 234359 | 0 | 0 | 17 | 0 |
| 10 | 222759 | 3.91 | 149.68GB | 4.07 | 232266 | 0 | 0 | 4 | 0 |
| 11 | 231195 | 4.05 | 150.73GB | 4.09 | 249456 | 0 | 0 | 15 | 0 |
| 12 | 241038 | 4.23 | 146.77GB | 3.99 | 272949 | 0 | 0 | 32 | 0 |
| 13 | 241904 | 4.24 | 150.54GB | 4.09 | 266795 | 0 | 0 | 20 | 0 |
| 14 | 244627 | 4.29 | 149.80GB | 4.07 | 277667 | 0 | 0 | 60 | 0 |
| 15 | 239102 | 4.19 | 147.90GB | 4.02 | 266247 | 0 | 0 | 50 | 0 |
| 16 | 241594 | 4.24 | 153.08GB | 4.16 | 266049 | 0 | 0 | 20 | 0 |
| 17 | 229991 | 4.03 | 147.29GB | 4.00 | 252655 | 0 | 0 | 10 | 0 |
| 18 | 248050 | 4.35 | 159.18GB | 4.32 | 268832 | 0 | 0 | 5 | 0 |
| 19 | 240518 | 4.22 | 156.67GB | 4.25 | 257709 | 0 | 0 | 9 | 0 |
| 20 | 251006 | 4.40 | 164.77GB | 4.47 | 266461 | 0 | 0 | 8 | 0 |
| 21 | 257128 | 4.51 | 169.12GB | 4.59 | 272265 | 0 | 0 | 14 | 0 |
| 22 | 240878 | 4.22 | 158.56GB | 4.31 | 255378 | 0 | 0 | 21 | 0 |
| 23 | 239624 | 4.20 | 158.98GB | 4.32 | 252716 | 0 | 0 | 17 | 0 |
| Total | 5701829 | 100.00 | 3.60TB | 100.00 | 6164634 | 0 | 0 | 472 | 0 |
 |
| Outgoing Feed (+ Top1000 #) | Accepted | %Acc | %Tot | Art/sec | Volume | %Vol | KB/art | Dups | Rejs | % Ratio (Out/In) | ||
|---|---|---|---|---|---|---|---|---|---|---|---|---|
| 1 | 217.73.144.40 | 0 | 0.00 | 0.00 | 0.00 | 0.00KB | 0.00 | 0.00 | 5738710 | 0 | … | |
| Total | 0 | 0.00 | 0.00 | 0.00 | 0.00KB | 0.00 | 0.00 | 5738710 | 0 | |||
 |
| Outgoing Feed (+ Top1000 #) | Volume | %Vol | Kbps | Accepted | %Acc | %Tot | KB/art | Dups | Rejs | % Ratio (Out/In) | ||
|---|---|---|---|---|---|---|---|---|---|---|---|---|
| 1 | 217.73.144.40 | 0.00KB | 0.00 | 0.00 | 0 | 0.00 | 0.00 | 0.00 | 5738710 | 0 | … | |
| Total | 0.00KB | 0.00 | 0.00 | 0 | 0.00 | 0.00 | 0.00 | 5738710 | 0 | |||
 |
| Outgoing Feed (+ Top1000 #) | Rej. Vol. | %Vol | Kbps | Accepted | %Acc | %Tot | KB/art | Dups | Rejs | % Ratio (Out/In) | ||
|---|---|---|---|---|---|---|---|---|---|---|---|---|
| 1 | 217.73.144.40 | 0.00KB | 0.00 | 0.00 | 0 | 0.00 | 0.00 | 0.00 | 5738710 | 0 | … | |
| Total | 0.00KB | 0.00 | 0.00 | 0 | 0.00 | 0.00 | 0.00 | 5738710 | 0 | |||
 |
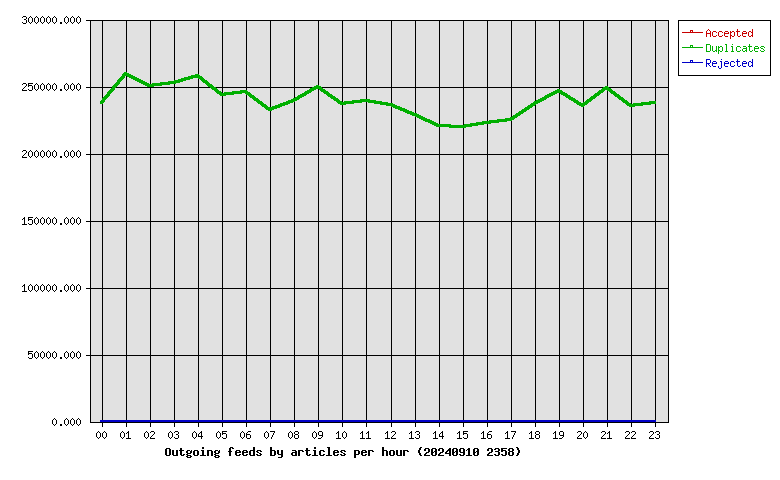
| Hour | Accepted | %Acc | Volume | %Vol | dups | Rejs |
|---|---|---|---|---|---|---|
| 00 | 0 | 0.00 | 0.00KB | 0.00 | 237501 | 0 |
| 01 | 0 | 0.00 | 0.00KB | 0.00 | 259346 | 0 |
| 02 | 0 | 0.00 | 0.00KB | 0.00 | 250416 | 0 |
| 03 | 0 | 0.00 | 0.00KB | 0.00 | 252944 | 0 |
| 04 | 0 | 0.00 | 0.00KB | 0.00 | 257619 | 0 |
| 05 | 0 | 0.00 | 0.00KB | 0.00 | 243372 | 0 |
| 06 | 0 | 0.00 | 0.00KB | 0.00 | 246120 | 0 |
| 07 | 0 | 0.00 | 0.00KB | 0.00 | 232428 | 0 |
| 08 | 0 | 0.00 | 0.00KB | 0.00 | 238978 | 0 |
| 09 | 0 | 0.00 | 0.00KB | 0.00 | 249640 | 0 |
| 10 | 0 | 0.00 | 0.00KB | 0.00 | 237186 | 0 |
| 11 | 0 | 0.00 | 0.00KB | 0.00 | 239024 | 0 |
| 12 | 0 | 0.00 | 0.00KB | 0.00 | 236161 | 0 |
| 13 | 0 | 0.00 | 0.00KB | 0.00 | 228846 | 0 |
| 14 | 0 | 0.00 | 0.00KB | 0.00 | 220716 | 0 |
| 15 | 0 | 0.00 | 0.00KB | 0.00 | 219500 | 0 |
| 16 | 0 | 0.00 | 0.00KB | 0.00 | 222678 | 0 |
| 17 | 0 | 0.00 | 0.00KB | 0.00 | 225289 | 0 |
| 18 | 0 | 0.00 | 0.00KB | 0.00 | 237216 | 0 |
| 19 | 0 | 0.00 | 0.00KB | 0.00 | 246679 | 0 |
| 20 | 0 | 0.00 | 0.00KB | 0.00 | 235088 | 0 |
| 21 | 0 | 0.00 | 0.00KB | 0.00 | 248917 | 0 |
| 22 | 0 | 0.00 | 0.00KB | 0.00 | 235323 | 0 |
| 23 | 0 | 0.00 | 0.00KB | 0.00 | 237723 | 0 |
| Total | 0 | 0.00 | 0.00KB | 0.00 | 5738710 | 0 |
 |
| >= 20% Full | >= 35% Full | >= 50% Full | >= 65% Full | >= 80% Full | >= 95% Full |
| Outgoing Feed | Batch Seq | Batch Num | Batch Max | %Full | Av. Pending |
|---|---|---|---|---|---|
| nbr.elbracht.net-o | 985759-985840 | 81 | 500 | 16 | 0.0 |
| text-spool-out | 0-0 | 0 | 500 | 0 | 0.0 |
| 1st Time | Last Time | # Msgs | Message |
|---|---|---|---|
| 20:13:51 | 1 | DNS Fwd/Rev mismatch: lookup of scanner-25.ch1.censys-scanner.com failed |