| |
DIABLO statistics for newsfeed.yoursite.com on Mon 09 Sep 2024 |
Generated on 20240909 2358 by feeder-stats v4.006. Copyright © 2002 The Diablo Project.
Diablo running processes:  81    Dnewslink running processes:  0


11:59PM  up 204 days,  7:18, 0 users, load averages: 1.19, 0.67, 0.59

Filesystem     Size    Used   Avail Capacity  Mounted on
/dev/da0s1g     94G    1.2G     85G     1%    /news
/dev/da1       7.3T    5.7T    989G    86%    /news2/spool/news/00
/dev/da2       7.3T    5.7T    991G    86%    /news2/spool/news/01
/dev/da3       3.7T    3.3T     62G    98%    /news2/spool/news/02
/dev/da4       5.5T    2.9T    2.2T    57%    /news2/spool/news/03
/dev/da8       7.3T    5.7T    990G    86%    /news2/spool/news/04
/dev/da9       7.3T    5.7T    990G    86%    /news2/spool/news/05
/dev/da10      7.3T    5.7T    990G    86%    /news2/spool/news/06
/dev/da11      5.5T      5T     64G    99%    /news2/spool/news/07
/dev/da12      5.5T    4.3T    778G    85%    /news2/spool/news/08
/dev/da13      7.3T    5.7T    991G    86%    /news2/spool/news/09
/dev/da14      7.3T    5.7T    990G    86%    /news2/spool/news/10
/dev/da15      7.3T    5.7T    990G    86%    /news2/spool/news/11
/dev/da16      7.3T    5.7T    986G    86%    /news2/spool/news/12
/dev/da17      7.3T    5.7T    990G    86%    /news2/spool/news/13
/dev/da18      7.3T    5.7T    997G    85%    /news2/spool/news/14
/dev/da19      7.3T    5.7T    986G    86%    /news2/spool/news/15
/dev/da20      7.3T    5.7T    991G    86%    /news2/spool/news/16
/dev/da21      7.3T    5.7T    990G    86%    /news2/spool/news/17
/dev/da22      7.3T    5.7T    993G    86%    /news2/spool/news/18
/dev/da23      7.3T    5.7T    991G    86%    /news2/spool/news/19
/dev/da24      7.3T    5.7T    988G    86%    /news2/spool/news/20
/dev/da25      7.3T    5.7T    988G    86%    /news2/spool/news/21
/dev/da26      7.3T    5.7T    989G    86%    /news2/spool/news/22
/dev/da5       221G     34G    169G    17%    /news1
/dev/md0        40G     12G     23G    35%    /news3
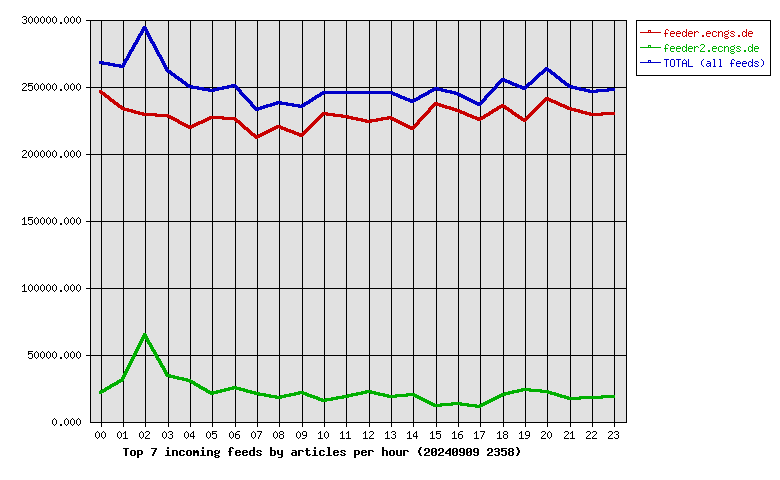
| Incoming Feed (+ Top1000 #) | Accepted | %Acc | %Tot | Art/sec | Volume | %Vol | KB/art | Check | Ihave | Spam | TooOld | Rejs | Errs | ||
|---|---|---|---|---|---|---|---|---|---|---|---|---|---|---|---|
| 1 | feeder.ecngs.de | 5462135 | 89.37 | 91.10 | 63.22 | 3.68TB | 99.92 | 722.91 | 6111442 | 0 | 0 | 0 | 275 | 0 | |
| 2 | feeder2.ecngs.de | 533479 | 81.57 | 8.90 | 6.20 | 3.08GB | 0.08 | 6.06 | 653597 | 0 | 0 | 0 | 433 | 0 | |
| Total | 5995614 | 0.00 | 100.00 | 69.42 | 3.68TB | 100.00 | 659.13 | 6765039 | 0 | 0 | 0 | 708 | 0 | ||
 |
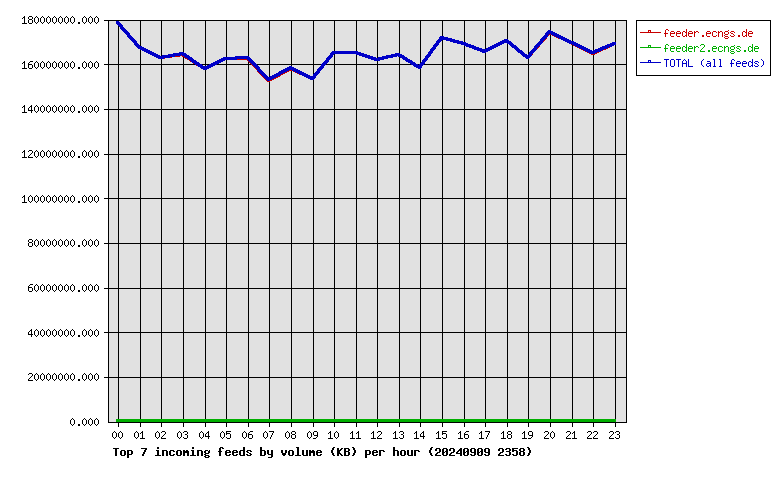
| Incoming Feed (+ Top1000 #) | Volume | %Vol | Kbps | Accepted | %Acc | %Tot | KB/art | Check | Ihave | Spam | TooOld | Rejs | Errs | ||
|---|---|---|---|---|---|---|---|---|---|---|---|---|---|---|---|
| 1 | feeder.ecngs.de | 3.68TB | 99.92 | 365614.14 | 5462135 | 89.37 | 91.10 | 722.91 | 6111442 | 0 | 0 | 0 | 275 | 0 | |
| 2 | feeder2.ecngs.de | 3.08GB | 0.08 | 300.87 | 533479 | 81.57 | 8.90 | 6.06 | 653597 | 0 | 0 | 0 | 433 | 0 | |
| Total | 3.68TB | 100.00 | 365915.01 | 5995614 | 0.00 | 100.00 | 659.13 | 6765039 | 0 | 0 | 0 | 708 | 0 | ||
 |
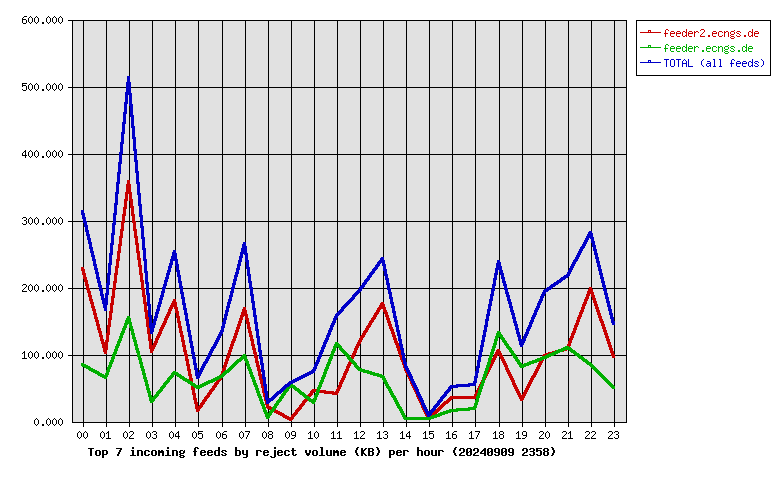
| Incoming Feed (+ Top1000 #) | Rej. Vol. | %Vol | Kbps | Accepted | %Acc | %Tot | KB/art | Check | Ihave | Spam | TooOld | Rejs | Errs | ||
|---|---|---|---|---|---|---|---|---|---|---|---|---|---|---|---|
| 1 | feeder2.ecngs.de | 2.36MB | 60.77 | 0.22 | 533479 | 81.57 | 8.90 | 6.06 | 653597 | 0 | 0 | 0 | 433 | 0 | |
| 2 | feeder.ecngs.de | 1.52MB | 39.23 | 0.14 | 5462135 | 89.37 | 91.10 | 722.91 | 6111442 | 0 | 0 | 0 | 275 | 0 | |
| Total | 3.88MB | 100.00 | 0.37 | 5995614 | 0.00 | 100.00 | 659.13 | 6765039 | 0 | 0 | 0 | 708 | 0 | ||
 |
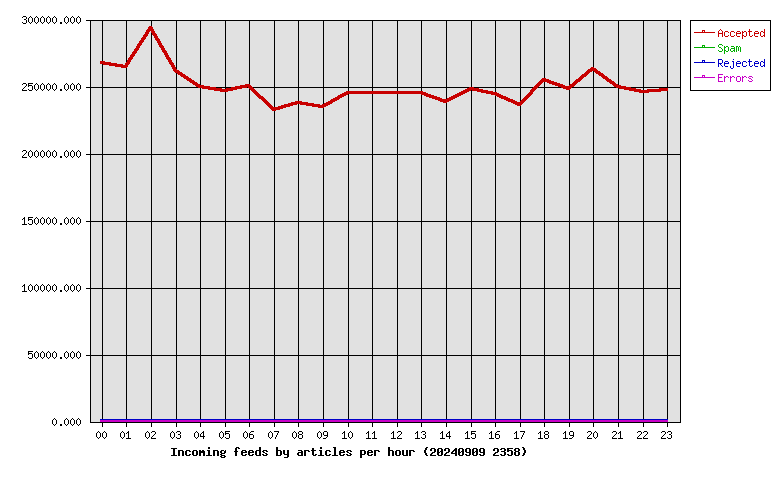
| Hour | Accepted | %Acc | Volume | %Vol | Check | Ihave | Spam | Rejs | Errs |
|---|---|---|---|---|---|---|---|---|---|
| 00 | 267366 | 4.46 | 170.09GB | 4.51 | 289787 | 0 | 0 | 49 | 0 |
| 01 | 264442 | 4.41 | 159.49GB | 4.23 | 302164 | 0 | 0 | 43 | 0 |
| 02 | 293341 | 4.89 | 155.43GB | 4.12 | 366046 | 0 | 0 | 130 | 0 |
| 03 | 261812 | 4.37 | 156.72GB | 4.16 | 322482 | 0 | 0 | 40 | 0 |
| 04 | 249458 | 4.16 | 150.63GB | 4.00 | 323809 | 0 | 0 | 52 | 0 |
| 05 | 246735 | 4.12 | 154.75GB | 4.11 | 348467 | 0 | 0 | 8 | 0 |
| 06 | 250558 | 4.18 | 155.13GB | 4.12 | 286765 | 0 | 0 | 19 | 0 |
| 07 | 232668 | 3.88 | 145.74GB | 3.87 | 262686 | 0 | 0 | 27 | 0 |
| 08 | 237667 | 3.96 | 150.79GB | 4.00 | 259815 | 0 | 0 | 13 | 0 |
| 09 | 234713 | 3.91 | 146.19GB | 3.88 | 259170 | 0 | 0 | 12 | 0 |
| 10 | 245010 | 4.09 | 157.38GB | 4.18 | 262118 | 0 | 0 | 8 | 0 |
| 11 | 245321 | 4.09 | 157.39GB | 4.18 | 266018 | 0 | 0 | 17 | 0 |
| 12 | 245174 | 4.09 | 154.43GB | 4.10 | 270979 | 0 | 0 | 28 | 0 |
| 13 | 245170 | 4.09 | 156.41GB | 4.15 | 266835 | 0 | 0 | 27 | 0 |
| 14 | 238097 | 3.97 | 151.10GB | 4.01 | 260802 | 0 | 0 | 12 | 0 |
| 15 | 247945 | 4.14 | 163.97GB | 4.35 | 262086 | 0 | 0 | 3 | 0 |
| 16 | 244716 | 4.08 | 161.07GB | 4.27 | 258551 | 0 | 0 | 13 | 0 |
| 17 | 236044 | 3.94 | 157.71GB | 4.18 | 249331 | 0 | 0 | 17 | 0 |
| 18 | 255165 | 4.26 | 162.53GB | 4.31 | 277643 | 0 | 0 | 43 | 0 |
| 19 | 247945 | 4.14 | 155.28GB | 4.12 | 275911 | 0 | 0 | 19 | 0 |
| 20 | 262702 | 4.38 | 166.15GB | 4.41 | 288375 | 0 | 0 | 41 | 0 |
| 21 | 249608 | 4.16 | 161.73GB | 4.29 | 267191 | 0 | 0 | 19 | 0 |
| 22 | 246212 | 4.11 | 157.28GB | 4.17 | 268742 | 0 | 0 | 41 | 0 |
| 23 | 247745 | 4.13 | 161.40GB | 4.28 | 269266 | 0 | 0 | 27 | 0 |
| Total | 5995614 | 100.00 | 3.68TB | 100.00 | 6765039 | 0 | 0 | 708 | 0 |
 |
| Outgoing Feed (+ Top1000 #) | Accepted | %Acc | %Tot | Art/sec | Volume | %Vol | KB/art | Dups | Rejs | % Ratio (Out/In) | ||
|---|---|---|---|---|---|---|---|---|---|---|---|---|
| 1 | 217.73.144.40 | 0 | 0.00 | 0.00 | 0.00 | 0.00KB | 0.00 | 0.00 | 5990670 | 0 | … | |
| Total | 0 | 0.00 | 0.00 | 0.00 | 0.00KB | 0.00 | 0.00 | 5990670 | 0 | |||
 |
| Outgoing Feed (+ Top1000 #) | Volume | %Vol | Kbps | Accepted | %Acc | %Tot | KB/art | Dups | Rejs | % Ratio (Out/In) | ||
|---|---|---|---|---|---|---|---|---|---|---|---|---|
| 1 | 217.73.144.40 | 0.00KB | 0.00 | 0.00 | 0 | 0.00 | 0.00 | 0.00 | 5990670 | 0 | … | |
| Total | 0.00KB | 0.00 | 0.00 | 0 | 0.00 | 0.00 | 0.00 | 5990670 | 0 | |||
 |
| Outgoing Feed (+ Top1000 #) | Rej. Vol. | %Vol | Kbps | Accepted | %Acc | %Tot | KB/art | Dups | Rejs | % Ratio (Out/In) | ||
|---|---|---|---|---|---|---|---|---|---|---|---|---|
| 1 | 217.73.144.40 | 0.00KB | 0.00 | 0.00 | 0 | 0.00 | 0.00 | 0.00 | 5990670 | 0 | … | |
| Total | 0.00KB | 0.00 | 0.00 | 0 | 0.00 | 0.00 | 0.00 | 5990670 | 0 | |||
 |
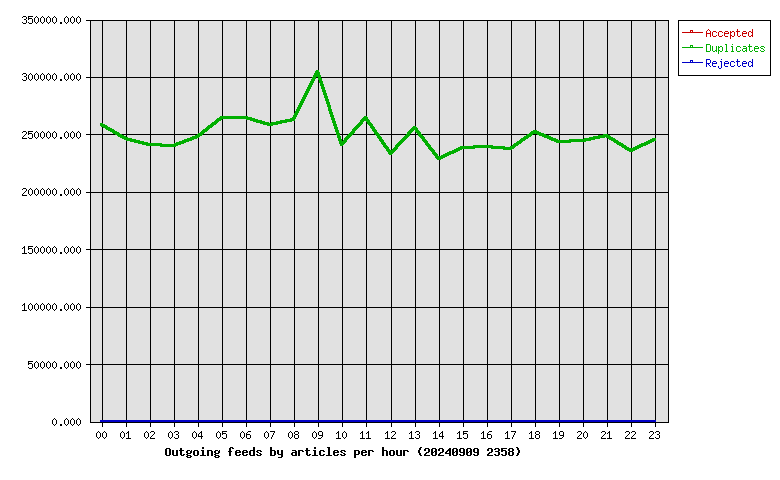
| Hour | Accepted | %Acc | Volume | %Vol | dups | Rejs |
|---|---|---|---|---|---|---|
| 00 | 0 | 0.00 | 0.00KB | 0.00 | 257802 | 0 |
| 01 | 0 | 0.00 | 0.00KB | 0.00 | 246053 | 0 |
| 02 | 0 | 0.00 | 0.00KB | 0.00 | 240566 | 0 |
| 03 | 0 | 0.00 | 0.00KB | 0.00 | 239604 | 0 |
| 04 | 0 | 0.00 | 0.00KB | 0.00 | 248128 | 0 |
| 05 | 0 | 0.00 | 0.00KB | 0.00 | 264596 | 0 |
| 06 | 0 | 0.00 | 0.00KB | 0.00 | 264419 | 0 |
| 07 | 0 | 0.00 | 0.00KB | 0.00 | 257829 | 0 |
| 08 | 0 | 0.00 | 0.00KB | 0.00 | 262229 | 0 |
| 09 | 0 | 0.00 | 0.00KB | 0.00 | 304465 | 0 |
| 10 | 0 | 0.00 | 0.00KB | 0.00 | 240682 | 0 |
| 11 | 0 | 0.00 | 0.00KB | 0.00 | 264010 | 0 |
| 12 | 0 | 0.00 | 0.00KB | 0.00 | 232852 | 0 |
| 13 | 0 | 0.00 | 0.00KB | 0.00 | 255694 | 0 |
| 14 | 0 | 0.00 | 0.00KB | 0.00 | 228752 | 0 |
| 15 | 0 | 0.00 | 0.00KB | 0.00 | 237898 | 0 |
| 16 | 0 | 0.00 | 0.00KB | 0.00 | 239039 | 0 |
| 17 | 0 | 0.00 | 0.00KB | 0.00 | 236997 | 0 |
| 18 | 0 | 0.00 | 0.00KB | 0.00 | 252071 | 0 |
| 19 | 0 | 0.00 | 0.00KB | 0.00 | 243333 | 0 |
| 20 | 0 | 0.00 | 0.00KB | 0.00 | 244395 | 0 |
| 21 | 0 | 0.00 | 0.00KB | 0.00 | 248768 | 0 |
| 22 | 0 | 0.00 | 0.00KB | 0.00 | 235434 | 0 |
| 23 | 0 | 0.00 | 0.00KB | 0.00 | 245054 | 0 |
| Total | 0 | 0.00 | 0.00KB | 0.00 | 5990670 | 0 |
 |
| >= 20% Full | >= 35% Full | >= 50% Full | >= 65% Full | >= 80% Full | >= 95% Full |
| Outgoing Feed | Batch Seq | Batch Num | Batch Max | %Full | Av. Pending |
|---|---|---|---|---|---|
| nbr.elbracht.net-o | 985471-985552 | 81 | 500 | 16 | 0.0 |
| text-spool-out | 0-0 | 0 | 500 | 0 | 0.0 |
| 1st Time | Last Time | # Msgs | Message |
|---|---|---|---|
| 13:26:52 | 1 | DNS Fwd/Rev mismatch: lookup of scanner-06.ch1.censys-scanner.com failed |