| |
DIABLO statistics for newsfeed.yoursite.com on Sun 08 Sep 2024 |
Generated on 20240908 2358 by feeder-stats v4.006. Copyright © 2002 The Diablo Project.
Diablo running processes:  81    Dnewslink running processes:  0


11:59PM  up 203 days,  7:18, 0 users, load averages: 1.22, 0.79, 0.68

Filesystem     Size    Used   Avail Capacity  Mounted on
/dev/da0s1g     94G    1.2G     85G     1%    /news
/dev/da1       7.3T    5.7T    996G    85%    /news2/spool/news/00
/dev/da2       7.3T    5.7T    997G    85%    /news2/spool/news/01
/dev/da3       3.7T    3.3T     64G    98%    /news2/spool/news/02
/dev/da4       5.5T    2.9T    2.2T    57%    /news2/spool/news/03
/dev/da8       7.3T    5.7T    996G    85%    /news2/spool/news/04
/dev/da9       7.3T    5.7T    996G    85%    /news2/spool/news/05
/dev/da10      7.3T    5.7T    997G    85%    /news2/spool/news/06
/dev/da11      5.5T      5T     65G    99%    /news2/spool/news/07
/dev/da12      5.5T    4.3T    783G    85%    /news2/spool/news/08
/dev/da13      7.3T    5.7T    998G    85%    /news2/spool/news/09
/dev/da14      7.3T    5.7T    995G    85%    /news2/spool/news/10
/dev/da15      7.3T    5.7T    996G    85%    /news2/spool/news/11
/dev/da16      7.3T    5.7T    992G    86%    /news2/spool/news/12
/dev/da17      7.3T    5.7T    997G    85%    /news2/spool/news/13
/dev/da18      7.3T    5.7T    997G    85%    /news2/spool/news/14
/dev/da19      7.3T    5.7T    993G    86%    /news2/spool/news/15
/dev/da20      7.3T    5.7T    997G    85%    /news2/spool/news/16
/dev/da21      7.3T    5.7T    996G    85%    /news2/spool/news/17
/dev/da22      7.3T    5.7T    998G    85%    /news2/spool/news/18
/dev/da23      7.3T    5.7T    998G    85%    /news2/spool/news/19
/dev/da24      7.3T    5.7T    995G    85%    /news2/spool/news/20
/dev/da25      7.3T    5.7T    995G    85%    /news2/spool/news/21
/dev/da26      7.3T    5.7T    996G    85%    /news2/spool/news/22
/dev/da5       221G     34G    169G    17%    /news1
/dev/md0        40G     12G     23G    36%    /news3
| Incoming Feed (+ Top1000 #) | Accepted | %Acc | %Tot | Art/sec | Volume | %Vol | KB/art | Check | Ihave | Spam | TooOld | Rejs | Errs | ||
|---|---|---|---|---|---|---|---|---|---|---|---|---|---|---|---|
| 1 | feeder.ecngs.de | 5522133 | 89.52 | 93.42 | 63.91 | 3.74TB | 99.93 | 727.96 | 6168660 | 0 | 0 | 0 | 197 | 0 | |
| 2 | feeder2.ecngs.de | 388936 | 61.14 | 6.58 | 4.53 | 2.69GB | 0.07 | 7.25 | 635981 | 0 | 0 | 0 | 195 | 0 | |
| Total | 5911069 | 0.00 | 100.00 | 68.44 | 3.75TB | 100.00 | 680.54 | 6804641 | 0 | 0 | 0 | 392 | 0 | ||
 |
| Incoming Feed (+ Top1000 #) | Volume | %Vol | Kbps | Accepted | %Acc | %Tot | KB/art | Check | Ihave | Spam | TooOld | Rejs | Errs | ||
|---|---|---|---|---|---|---|---|---|---|---|---|---|---|---|---|
| 1 | feeder.ecngs.de | 3.74TB | 99.93 | 372213.33 | 5522133 | 89.52 | 93.42 | 727.96 | 6168660 | 0 | 0 | 0 | 197 | 0 | |
| 2 | feeder2.ecngs.de | 2.69GB | 0.07 | 262.54 | 388936 | 61.14 | 6.58 | 7.25 | 635981 | 0 | 0 | 0 | 195 | 0 | |
| Total | 3.75TB | 100.00 | 372475.87 | 5911069 | 0.00 | 100.00 | 680.54 | 6804641 | 0 | 0 | 0 | 392 | 0 | ||
 |
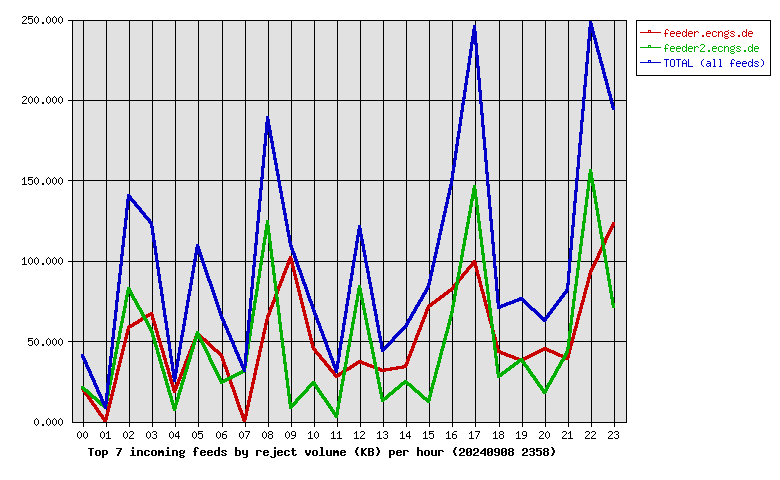
| Incoming Feed (+ Top1000 #) | Rej. Vol. | %Vol | Kbps | Accepted | %Acc | %Tot | KB/art | Check | Ihave | Spam | TooOld | Rejs | Errs | ||
|---|---|---|---|---|---|---|---|---|---|---|---|---|---|---|---|
| 1 | feeder.ecngs.de | 1.20MB | 51.83 | 0.11 | 5522133 | 89.52 | 93.42 | 727.96 | 6168660 | 0 | 0 | 0 | 197 | 0 | |
| 2 | feeder2.ecngs.de | 1.12MB | 48.17 | 0.11 | 388936 | 61.14 | 6.58 | 7.25 | 635981 | 0 | 0 | 0 | 195 | 0 | |
| Total | 2.32MB | 100.00 | 0.22 | 5911069 | 0.00 | 100.00 | 680.54 | 6804641 | 0 | 0 | 0 | 392 | 0 | ||
 |
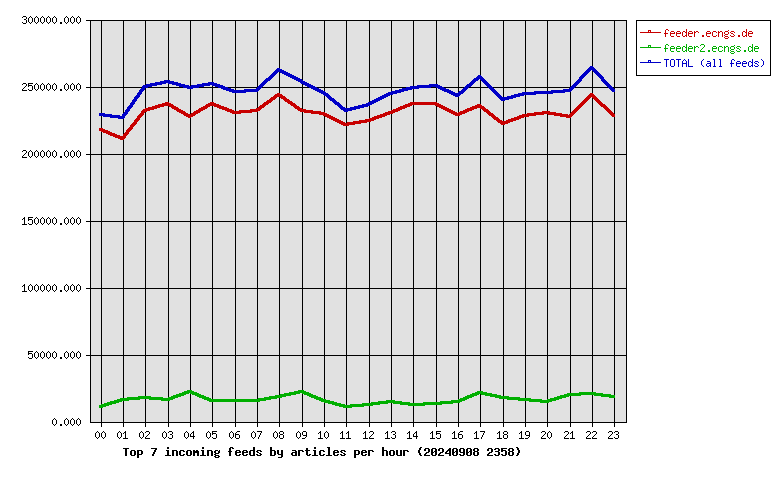
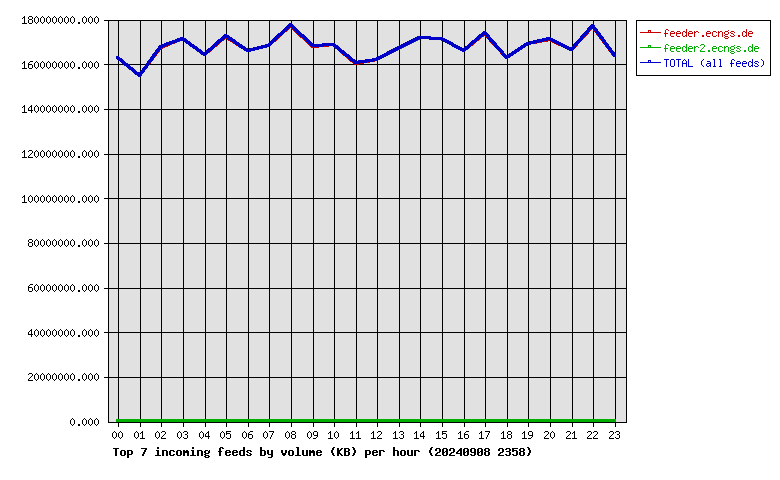
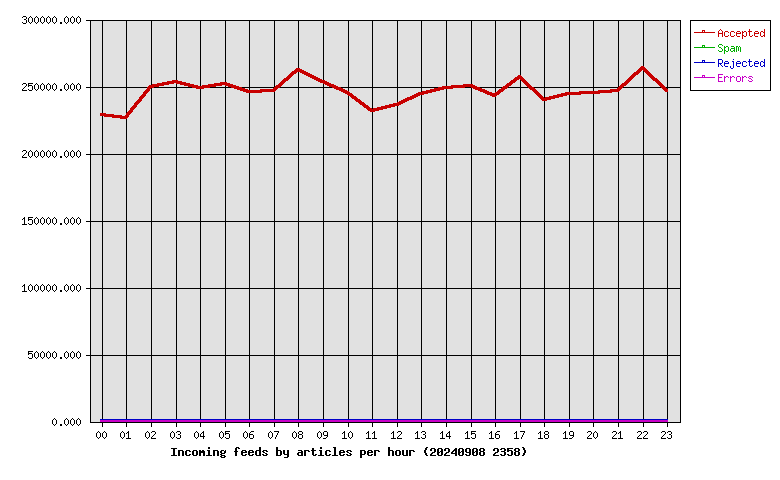
| Hour | Accepted | %Acc | Volume | %Vol | Check | Ihave | Spam | Rejs | Errs |
|---|---|---|---|---|---|---|---|---|---|
| 00 | 228377 | 3.86 | 155.11GB | 4.04 | 282365 | 0 | 0 | 4 | 0 |
| 01 | 226740 | 3.84 | 147.61GB | 3.85 | 278635 | 0 | 0 | 4 | 0 |
| 02 | 249526 | 4.22 | 159.77GB | 4.16 | 303417 | 0 | 0 | 21 | 0 |
| 03 | 253136 | 4.28 | 163.35GB | 4.26 | 300106 | 0 | 0 | 15 | 0 |
| 04 | 249171 | 4.22 | 156.47GB | 4.08 | 302585 | 0 | 0 | 5 | 0 |
| 05 | 251775 | 4.26 | 164.45GB | 4.29 | 328427 | 0 | 0 | 11 | 0 |
| 06 | 245858 | 4.16 | 158.39GB | 4.13 | 303721 | 0 | 0 | 17 | 0 |
| 07 | 246915 | 4.18 | 160.25GB | 4.18 | 308176 | 0 | 0 | 5 | 0 |
| 08 | 262336 | 4.44 | 169.14GB | 4.41 | 313950 | 0 | 0 | 38 | 0 |
| 09 | 253532 | 4.29 | 160.14GB | 4.17 | 309225 | 0 | 0 | 13 | 0 |
| 10 | 244860 | 4.14 | 160.68GB | 4.19 | 296818 | 0 | 0 | 18 | 0 |
| 11 | 232038 | 3.93 | 152.91GB | 3.99 | 269304 | 0 | 0 | 2 | 0 |
| 12 | 236316 | 4.00 | 154.38GB | 4.02 | 252371 | 0 | 0 | 16 | 0 |
| 13 | 244294 | 4.13 | 159.37GB | 4.15 | 260702 | 0 | 0 | 9 | 0 |
| 14 | 249220 | 4.22 | 163.72GB | 4.27 | 263338 | 0 | 0 | 17 | 0 |
| 15 | 250037 | 4.23 | 163.22GB | 4.25 | 264672 | 0 | 0 | 11 | 0 |
| 16 | 243187 | 4.11 | 158.28GB | 4.13 | 260709 | 0 | 0 | 25 | 0 |
| 17 | 256902 | 4.35 | 165.81GB | 4.32 | 288188 | 0 | 0 | 40 | 0 |
| 18 | 239648 | 4.05 | 155.13GB | 4.04 | 265348 | 0 | 0 | 10 | 0 |
| 19 | 244567 | 4.14 | 161.23GB | 4.20 | 264703 | 0 | 0 | 19 | 0 |
| 20 | 245094 | 4.15 | 163.13GB | 4.25 | 261666 | 0 | 0 | 13 | 0 |
| 21 | 246970 | 4.18 | 158.80GB | 4.14 | 268535 | 0 | 0 | 16 | 0 |
| 22 | 264168 | 4.47 | 168.77GB | 4.40 | 287990 | 0 | 0 | 35 | 0 |
| 23 | 246402 | 4.17 | 156.24GB | 4.07 | 269690 | 0 | 0 | 28 | 0 |
| Total | 5911069 | 100.00 | 3.75TB | 100.00 | 6804641 | 0 | 0 | 392 | 0 |
 |
| Outgoing Feed (+ Top1000 #) | Accepted | %Acc | %Tot | Art/sec | Volume | %Vol | KB/art | Dups | Rejs | % Ratio (Out/In) | ||
|---|---|---|---|---|---|---|---|---|---|---|---|---|
| 1 | 217.73.144.40 | 0 | 0.00 | 0.00 | 0.00 | 0.00KB | 0.00 | 0.00 | 5871947 | 0 | … | |
| Total | 0 | 0.00 | 0.00 | 0.00 | 0.00KB | 0.00 | 0.00 | 5871947 | 0 | |||
 |
| Outgoing Feed (+ Top1000 #) | Volume | %Vol | Kbps | Accepted | %Acc | %Tot | KB/art | Dups | Rejs | % Ratio (Out/In) | ||
|---|---|---|---|---|---|---|---|---|---|---|---|---|
| 1 | 217.73.144.40 | 0.00KB | 0.00 | 0.00 | 0 | 0.00 | 0.00 | 0.00 | 5871947 | 0 | … | |
| Total | 0.00KB | 0.00 | 0.00 | 0 | 0.00 | 0.00 | 0.00 | 5871947 | 0 | |||
 |
| Outgoing Feed (+ Top1000 #) | Rej. Vol. | %Vol | Kbps | Accepted | %Acc | %Tot | KB/art | Dups | Rejs | % Ratio (Out/In) | ||
|---|---|---|---|---|---|---|---|---|---|---|---|---|
| 1 | 217.73.144.40 | 0.00KB | 0.00 | 0.00 | 0 | 0.00 | 0.00 | 0.00 | 5871947 | 0 | … | |
| Total | 0.00KB | 0.00 | 0.00 | 0 | 0.00 | 0.00 | 0.00 | 5871947 | 0 | |||
 |
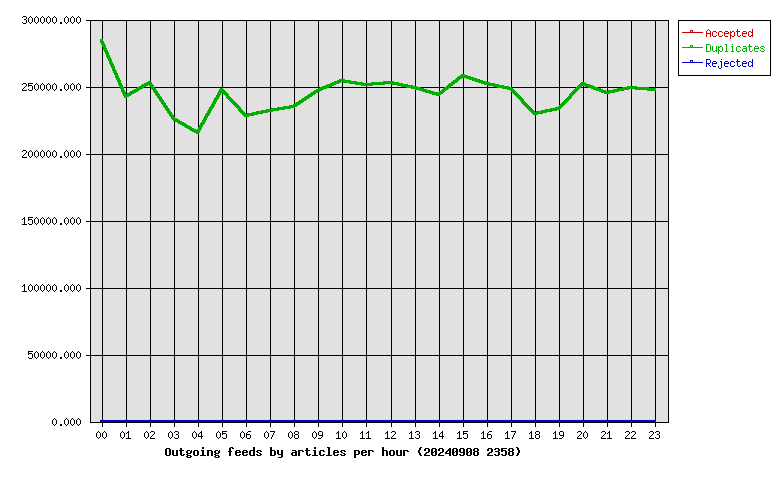
| Hour | Accepted | %Acc | Volume | %Vol | dups | Rejs |
|---|---|---|---|---|---|---|
| 00 | 0 | 0.00 | 0.00KB | 0.00 | 284154 | 0 |
| 01 | 0 | 0.00 | 0.00KB | 0.00 | 241910 | 0 |
| 02 | 0 | 0.00 | 0.00KB | 0.00 | 252745 | 0 |
| 03 | 0 | 0.00 | 0.00KB | 0.00 | 225640 | 0 |
| 04 | 0 | 0.00 | 0.00KB | 0.00 | 215453 | 0 |
| 05 | 0 | 0.00 | 0.00KB | 0.00 | 247314 | 0 |
| 06 | 0 | 0.00 | 0.00KB | 0.00 | 227926 | 0 |
| 07 | 0 | 0.00 | 0.00KB | 0.00 | 231776 | 0 |
| 08 | 0 | 0.00 | 0.00KB | 0.00 | 234565 | 0 |
| 09 | 0 | 0.00 | 0.00KB | 0.00 | 246398 | 0 |
| 10 | 0 | 0.00 | 0.00KB | 0.00 | 253734 | 0 |
| 11 | 0 | 0.00 | 0.00KB | 0.00 | 251034 | 0 |
| 12 | 0 | 0.00 | 0.00KB | 0.00 | 252692 | 0 |
| 13 | 0 | 0.00 | 0.00KB | 0.00 | 248937 | 0 |
| 14 | 0 | 0.00 | 0.00KB | 0.00 | 243921 | 0 |
| 15 | 0 | 0.00 | 0.00KB | 0.00 | 257730 | 0 |
| 16 | 0 | 0.00 | 0.00KB | 0.00 | 251724 | 0 |
| 17 | 0 | 0.00 | 0.00KB | 0.00 | 247873 | 0 |
| 18 | 0 | 0.00 | 0.00KB | 0.00 | 229718 | 0 |
| 19 | 0 | 0.00 | 0.00KB | 0.00 | 233238 | 0 |
| 20 | 0 | 0.00 | 0.00KB | 0.00 | 251771 | 0 |
| 21 | 0 | 0.00 | 0.00KB | 0.00 | 245025 | 0 |
| 22 | 0 | 0.00 | 0.00KB | 0.00 | 249066 | 0 |
| 23 | 0 | 0.00 | 0.00KB | 0.00 | 247603 | 0 |
| Total | 0 | 0.00 | 0.00KB | 0.00 | 5871947 | 0 |
 |
| >= 20% Full | >= 35% Full | >= 50% Full | >= 65% Full | >= 80% Full | >= 95% Full |
| Outgoing Feed | Batch Seq | Batch Num | Batch Max | %Full | Av. Pending |
|---|---|---|---|---|---|
| nbr.elbracht.net-o | 985183-985264 | 81 | 500 | 16 | 0.0 |
| text-spool-out | 0-0 | 0 | 500 | 0 | 0.0 |
| 1st Time | Last Time | # Msgs | Message |
|---|