| |
DIABLO statistics for newsfeed.yoursite.com on Sat 07 Sep 2024 |
Generated on 20240907 2358 by feeder-stats v4.006. Copyright © 2002 The Diablo Project.
Diablo running processes:  81    Dnewslink running processes:  0


11:59PM  up 202 days,  7:18, 0 users, load averages: 1.11, 0.62, 0.55

Filesystem     Size    Used   Avail Capacity  Mounted on
/dev/da0s1g     94G    1.2G     85G     1%    /news
/dev/da1       7.3T    5.7T      1T    85%    /news2/spool/news/00
/dev/da2       7.3T    5.7T      1T    85%    /news2/spool/news/01
/dev/da3       3.7T    3.3T     65G    98%    /news2/spool/news/02
/dev/da4       5.5T    2.9T    2.2T    57%    /news2/spool/news/03
/dev/da8       7.3T    5.7T      1T    85%    /news2/spool/news/04
/dev/da9       7.3T    5.7T      1T    85%    /news2/spool/news/05
/dev/da10      7.3T    5.7T      1T    85%    /news2/spool/news/06
/dev/da11      5.5T      5T     64G    99%    /news2/spool/news/07
/dev/da12      5.5T    4.3T    792G    85%    /news2/spool/news/08
/dev/da13      7.3T    5.7T      1T    85%    /news2/spool/news/09
/dev/da14      7.3T    5.7T      1T    85%    /news2/spool/news/10
/dev/da15      7.3T    5.7T      1T    85%    /news2/spool/news/11
/dev/da16      7.3T    5.7T      1T    85%    /news2/spool/news/12
/dev/da17      7.3T    5.7T      1T    85%    /news2/spool/news/13
/dev/da18      7.3T    5.7T      1T    85%    /news2/spool/news/14
/dev/da19      7.3T    5.7T      1T    85%    /news2/spool/news/15
/dev/da20      7.3T    5.7T      1T    85%    /news2/spool/news/16
/dev/da21      7.3T    5.7T      1T    85%    /news2/spool/news/17
/dev/da22      7.3T    5.7T      1T    85%    /news2/spool/news/18
/dev/da23      7.3T    5.7T      1T    85%    /news2/spool/news/19
/dev/da24      7.3T    5.7T      1T    85%    /news2/spool/news/20
/dev/da25      7.3T    5.7T      1T    85%    /news2/spool/news/21
/dev/da26      7.3T    5.7T      1T    85%    /news2/spool/news/22
/dev/da5       221G     34G    169G    17%    /news1
/dev/md0        40G     12G     23G    36%    /news3
| Incoming Feed (+ Top1000 #) | Accepted | %Acc | %Tot | Art/sec | Volume | %Vol | KB/art | Check | Ihave | Spam | TooOld | Rejs | Errs | ||
|---|---|---|---|---|---|---|---|---|---|---|---|---|---|---|---|
| 1 | feeder.ecngs.de | 5442135 | 85.66 | 93.91 | 62.99 | 3.69TB | 99.94 | 727.54 | 6352907 | 0 | 0 | 0 | 128 | 0 | |
| 2 | feeder2.ecngs.de | 352692 | 39.20 | 6.09 | 4.10 | 2.42GB | 0.06 | 7.19 | 899489 | 0 | 0 | 0 | 121 | 0 | |
| Total | 5794827 | 0.00 | 100.00 | 67.09 | 3.69TB | 100.00 | 683.70 | 7252396 | 0 | 0 | 0 | 249 | 0 | ||
 |
| Incoming Feed (+ Top1000 #) | Volume | %Vol | Kbps | Accepted | %Acc | %Tot | KB/art | Check | Ihave | Spam | TooOld | Rejs | Errs | ||
|---|---|---|---|---|---|---|---|---|---|---|---|---|---|---|---|
| 1 | feeder.ecngs.de | 3.69TB | 99.94 | 366610.15 | 5442135 | 85.66 | 93.91 | 727.54 | 6352907 | 0 | 0 | 0 | 128 | 0 | |
| 2 | feeder2.ecngs.de | 2.42GB | 0.06 | 235.62 | 352692 | 39.20 | 6.09 | 7.19 | 899489 | 0 | 0 | 0 | 121 | 0 | |
| Total | 3.69TB | 100.00 | 366845.78 | 5794827 | 0.00 | 100.00 | 683.70 | 7252396 | 0 | 0 | 0 | 249 | 0 | ||
 |
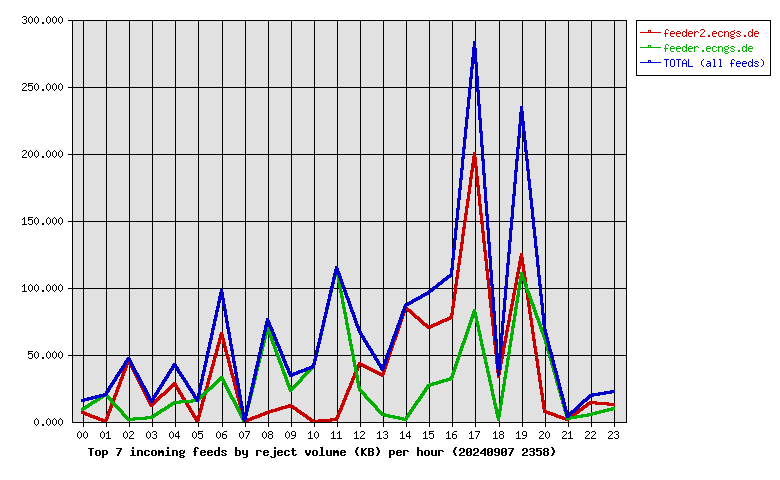
| Incoming Feed (+ Top1000 #) | Rej. Vol. | %Vol | Kbps | Accepted | %Acc | %Tot | KB/art | Check | Ihave | Spam | TooOld | Rejs | Errs | ||
|---|---|---|---|---|---|---|---|---|---|---|---|---|---|---|---|
| 1 | feeder2.ecngs.de | 875.49KB | 55.55 | 0.08 | 352692 | 39.20 | 6.09 | 7.19 | 899489 | 0 | 0 | 0 | 121 | 0 | |
| 2 | feeder.ecngs.de | 700.69KB | 44.45 | 0.06 | 5442135 | 85.66 | 93.91 | 727.54 | 6352907 | 0 | 0 | 0 | 128 | 0 | |
| Total | 1.54MB | 100.00 | 0.15 | 5794827 | 0.00 | 100.00 | 683.70 | 7252396 | 0 | 0 | 0 | 249 | 0 | ||
 |
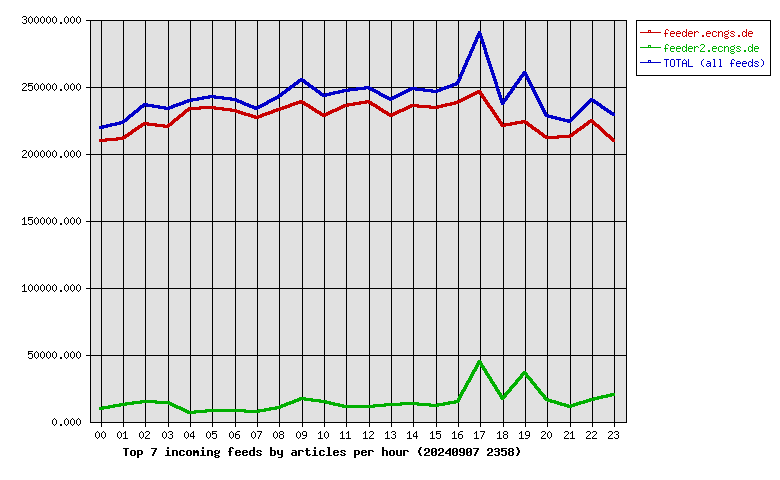
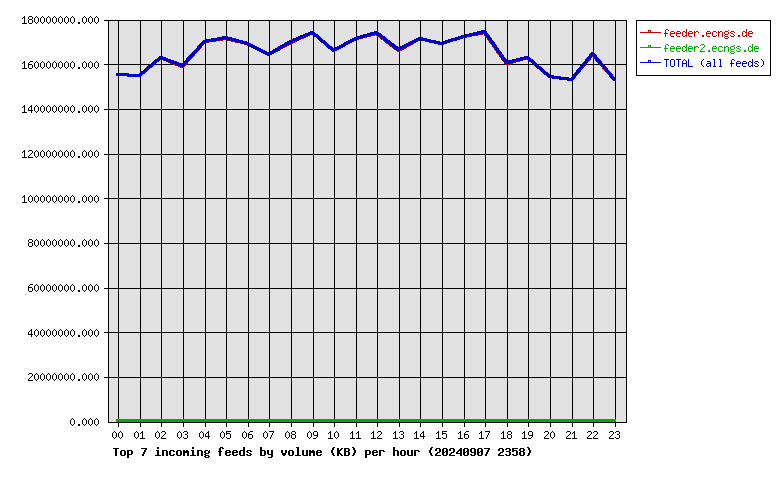
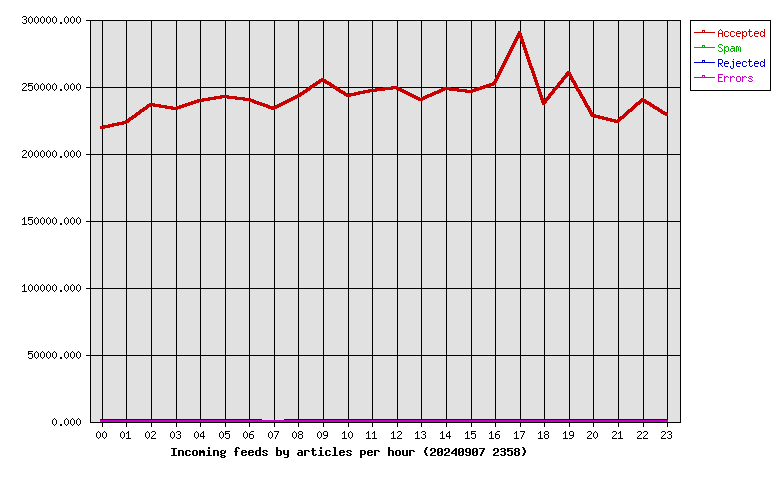
| Hour | Accepted | %Acc | Volume | %Vol | Check | Ihave | Spam | Rejs | Errs |
|---|---|---|---|---|---|---|---|---|---|
| 00 | 219051 | 3.78 | 148.03GB | 3.92 | 268398 | 0 | 0 | 9 | 0 |
| 01 | 223001 | 3.85 | 147.43GB | 3.90 | 264448 | 0 | 0 | 9 | 0 |
| 02 | 236032 | 4.07 | 155.19GB | 4.11 | 288408 | 0 | 0 | 10 | 0 |
| 03 | 233317 | 4.03 | 151.60GB | 4.01 | 289081 | 0 | 0 | 6 | 0 |
| 04 | 239289 | 4.13 | 162.16GB | 4.29 | 290231 | 0 | 0 | 4 | 0 |
| 05 | 241836 | 4.17 | 163.57GB | 4.33 | 324381 | 0 | 0 | 1 | 0 |
| 06 | 239591 | 4.13 | 161.22GB | 4.27 | 291218 | 0 | 0 | 11 | 0 |
| 07 | 233305 | 4.03 | 156.39GB | 4.14 | 286739 | 0 | 0 | 0 | 0 |
| 08 | 242459 | 4.18 | 161.86GB | 4.28 | 297336 | 0 | 0 | 22 | 0 |
| 09 | 255174 | 4.40 | 165.96GB | 4.39 | 322167 | 0 | 0 | 7 | 0 |
| 10 | 242653 | 4.19 | 158.24GB | 4.19 | 314783 | 0 | 0 | 6 | 0 |
| 11 | 246288 | 4.25 | 163.34GB | 4.32 | 307889 | 0 | 0 | 11 | 0 |
| 12 | 249225 | 4.30 | 165.70GB | 4.39 | 298496 | 0 | 0 | 10 | 0 |
| 13 | 240160 | 4.14 | 158.44GB | 4.19 | 288289 | 0 | 0 | 6 | 0 |
| 14 | 248310 | 4.29 | 163.25GB | 4.32 | 299494 | 0 | 0 | 7 | 0 |
| 15 | 245771 | 4.24 | 161.23GB | 4.27 | 296557 | 0 | 0 | 8 | 0 |
| 16 | 252103 | 4.35 | 164.31GB | 4.35 | 319289 | 0 | 0 | 15 | 0 |
| 17 | 290252 | 5.01 | 166.40GB | 4.40 | 387322 | 0 | 0 | 45 | 0 |
| 18 | 236870 | 4.09 | 152.93GB | 4.05 | 303794 | 0 | 0 | 6 | 0 |
| 19 | 259738 | 4.48 | 155.33GB | 4.11 | 339455 | 0 | 0 | 24 | 0 |
| 20 | 228036 | 3.94 | 147.22GB | 3.90 | 279104 | 0 | 0 | 14 | 0 |
| 21 | 223159 | 3.85 | 145.92GB | 3.86 | 263695 | 0 | 0 | 2 | 0 |
| 22 | 240286 | 4.15 | 156.72GB | 4.15 | 328004 | 0 | 0 | 9 | 0 |
| 23 | 228921 | 3.95 | 145.96GB | 3.86 | 303818 | 0 | 0 | 7 | 0 |
| Total | 5794827 | 100.00 | 3.69TB | 100.00 | 7252396 | 0 | 0 | 249 | 0 |
 |
| Outgoing Feed (+ Top1000 #) | Accepted | %Acc | %Tot | Art/sec | Volume | %Vol | KB/art | Dups | Rejs | % Ratio (Out/In) | ||
|---|---|---|---|---|---|---|---|---|---|---|---|---|
| 1 | 217.73.144.40 | 0 | 0.00 | 0.00 | 0.00 | 0.00KB | 0.00 | 0.00 | 5705497 | 0 | … | |
| Total | 0 | 0.00 | 0.00 | 0.00 | 0.00KB | 0.00 | 0.00 | 5705497 | 0 | |||
 |
| Outgoing Feed (+ Top1000 #) | Volume | %Vol | Kbps | Accepted | %Acc | %Tot | KB/art | Dups | Rejs | % Ratio (Out/In) | ||
|---|---|---|---|---|---|---|---|---|---|---|---|---|
| 1 | 217.73.144.40 | 0.00KB | 0.00 | 0.00 | 0 | 0.00 | 0.00 | 0.00 | 5705497 | 0 | … | |
| Total | 0.00KB | 0.00 | 0.00 | 0 | 0.00 | 0.00 | 0.00 | 5705497 | 0 | |||
 |
| Outgoing Feed (+ Top1000 #) | Rej. Vol. | %Vol | Kbps | Accepted | %Acc | %Tot | KB/art | Dups | Rejs | % Ratio (Out/In) | ||
|---|---|---|---|---|---|---|---|---|---|---|---|---|
| 1 | 217.73.144.40 | 0.00KB | 0.00 | 0.00 | 0 | 0.00 | 0.00 | 0.00 | 5705497 | 0 | … | |
| Total | 0.00KB | 0.00 | 0.00 | 0 | 0.00 | 0.00 | 0.00 | 5705497 | 0 | |||
 |
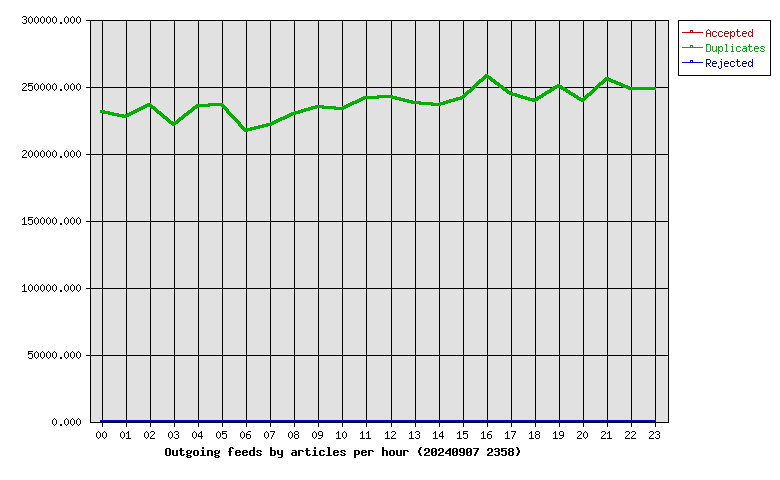
| Hour | Accepted | %Acc | Volume | %Vol | dups | Rejs |
|---|---|---|---|---|---|---|
| 00 | 0 | 0.00 | 0.00KB | 0.00 | 230908 | 0 |
| 01 | 0 | 0.00 | 0.00KB | 0.00 | 227449 | 0 |
| 02 | 0 | 0.00 | 0.00KB | 0.00 | 236147 | 0 |
| 03 | 0 | 0.00 | 0.00KB | 0.00 | 221017 | 0 |
| 04 | 0 | 0.00 | 0.00KB | 0.00 | 235574 | 0 |
| 05 | 0 | 0.00 | 0.00KB | 0.00 | 235880 | 0 |
| 06 | 0 | 0.00 | 0.00KB | 0.00 | 216680 | 0 |
| 07 | 0 | 0.00 | 0.00KB | 0.00 | 221108 | 0 |
| 08 | 0 | 0.00 | 0.00KB | 0.00 | 229792 | 0 |
| 09 | 0 | 0.00 | 0.00KB | 0.00 | 234547 | 0 |
| 10 | 0 | 0.00 | 0.00KB | 0.00 | 232996 | 0 |
| 11 | 0 | 0.00 | 0.00KB | 0.00 | 241743 | 0 |
| 12 | 0 | 0.00 | 0.00KB | 0.00 | 242089 | 0 |
| 13 | 0 | 0.00 | 0.00KB | 0.00 | 237856 | 0 |
| 14 | 0 | 0.00 | 0.00KB | 0.00 | 235822 | 0 |
| 15 | 0 | 0.00 | 0.00KB | 0.00 | 241367 | 0 |
| 16 | 0 | 0.00 | 0.00KB | 0.00 | 258129 | 0 |
| 17 | 0 | 0.00 | 0.00KB | 0.00 | 244706 | 0 |
| 18 | 0 | 0.00 | 0.00KB | 0.00 | 239157 | 0 |
| 19 | 0 | 0.00 | 0.00KB | 0.00 | 250744 | 0 |
| 20 | 0 | 0.00 | 0.00KB | 0.00 | 239036 | 0 |
| 21 | 0 | 0.00 | 0.00KB | 0.00 | 255955 | 0 |
| 22 | 0 | 0.00 | 0.00KB | 0.00 | 248485 | 0 |
| 23 | 0 | 0.00 | 0.00KB | 0.00 | 248310 | 0 |
| Total | 0 | 0.00 | 0.00KB | 0.00 | 5705497 | 0 |
 |
| >= 20% Full | >= 35% Full | >= 50% Full | >= 65% Full | >= 80% Full | >= 95% Full |
| Outgoing Feed | Batch Seq | Batch Num | Batch Max | %Full | Av. Pending |
|---|---|---|---|---|---|
| nbr.elbracht.net-o | 984895-984976 | 81 | 500 | 16 | 0.0 |
| text-spool-out | 0-0 | 0 | 500 | 0 | 0.0 |
| 1st Time | Last Time | # Msgs | Message |
|---|---|---|---|
| 04:55:37 | 1 | DNS Fwd/Rev mismatch: lookup of scanner-25.ch1.censys-scanner.com failed |