| |
DIABLO statistics for newsfeed.yoursite.com on Fri 06 Sep 2024 |
Generated on 20240906 2358 by feeder-stats v4.006. Copyright © 2002 The Diablo Project.
Diablo running processes:  81    Dnewslink running processes:  0


11:59PM  up 201 days,  7:18, 0 users, load averages: 1.42, 1.16, 0.86

Filesystem     Size    Used   Avail Capacity  Mounted on
/dev/da0s1g     94G    1.2G     85G     1%    /news
/dev/da1       7.3T    5.7T      1T    85%    /news2/spool/news/00
/dev/da2       7.3T    5.7T      1T    85%    /news2/spool/news/01
/dev/da3       3.7T    3.3T     63G    98%    /news2/spool/news/02
/dev/da4       5.5T    2.9T    2.2T    57%    /news2/spool/news/03
/dev/da8       7.3T    5.7T      1T    85%    /news2/spool/news/04
/dev/da9       7.3T    5.7T      1T    85%    /news2/spool/news/05
/dev/da10      7.3T    5.7T      1T    85%    /news2/spool/news/06
/dev/da11      5.5T      5T     66G    99%    /news2/spool/news/07
/dev/da12      5.5T    4.2T    796G    85%    /news2/spool/news/08
/dev/da13      7.3T    5.7T      1T    85%    /news2/spool/news/09
/dev/da14      7.3T    5.7T      1T    85%    /news2/spool/news/10
/dev/da15      7.3T    5.7T      1T    85%    /news2/spool/news/11
/dev/da16      7.3T    5.7T      1T    85%    /news2/spool/news/12
/dev/da17      7.3T    5.7T      1T    85%    /news2/spool/news/13
/dev/da18      7.3T    5.7T      1T    85%    /news2/spool/news/14
/dev/da19      7.3T    5.7T      1T    85%    /news2/spool/news/15
/dev/da20      7.3T    5.7T      1T    85%    /news2/spool/news/16
/dev/da21      7.3T    5.7T      1T    85%    /news2/spool/news/17
/dev/da22      7.3T    5.7T      1T    85%    /news2/spool/news/18
/dev/da23      7.3T    5.7T      1T    85%    /news2/spool/news/19
/dev/da24      7.3T    5.7T      1T    85%    /news2/spool/news/20
/dev/da25      7.3T    5.7T      1T    85%    /news2/spool/news/21
/dev/da26      7.3T    5.7T      1T    85%    /news2/spool/news/22
/dev/da5       221G     34G    169G    17%    /news1
/dev/md0        40G     12G     23G    36%    /news3
| Incoming Feed (+ Top1000 #) | Accepted | %Acc | %Tot | Art/sec | Volume | %Vol | KB/art | Check | Ihave | Spam | TooOld | Rejs | Errs | ||
|---|---|---|---|---|---|---|---|---|---|---|---|---|---|---|---|
| 1 | feeder.ecngs.de | 5388611 | 88.04 | 95.11 | 62.37 | 3.66TB | 99.94 | 729.47 | 6120280 | 0 | 0 | 0 | 91 | 0 | |
| 2 | feeder2.ecngs.de | 277168 | 37.40 | 4.89 | 3.22 | 2.15GB | 0.06 | 8.13 | 740939 | 0 | 0 | 0 | 95 | 0 | |
| Total | 5665779 | 0.00 | 100.00 | 65.59 | 3.66TB | 100.00 | 694.18 | 6861219 | 0 | 0 | 0 | 186 | 0 | ||
 |
| Incoming Feed (+ Top1000 #) | Volume | %Vol | Kbps | Accepted | %Acc | %Tot | KB/art | Check | Ihave | Spam | TooOld | Rejs | Errs | ||
|---|---|---|---|---|---|---|---|---|---|---|---|---|---|---|---|
| 1 | feeder.ecngs.de | 3.66TB | 99.94 | 363963.78 | 5388611 | 88.04 | 95.11 | 729.47 | 6120280 | 0 | 0 | 0 | 91 | 0 | |
| 2 | feeder2.ecngs.de | 2.15GB | 0.06 | 209.33 | 277168 | 37.40 | 4.89 | 8.13 | 740939 | 0 | 0 | 0 | 95 | 0 | |
| Total | 3.66TB | 100.00 | 364173.11 | 5665779 | 0.00 | 100.00 | 694.18 | 6861219 | 0 | 0 | 0 | 186 | 0 | ||
 |
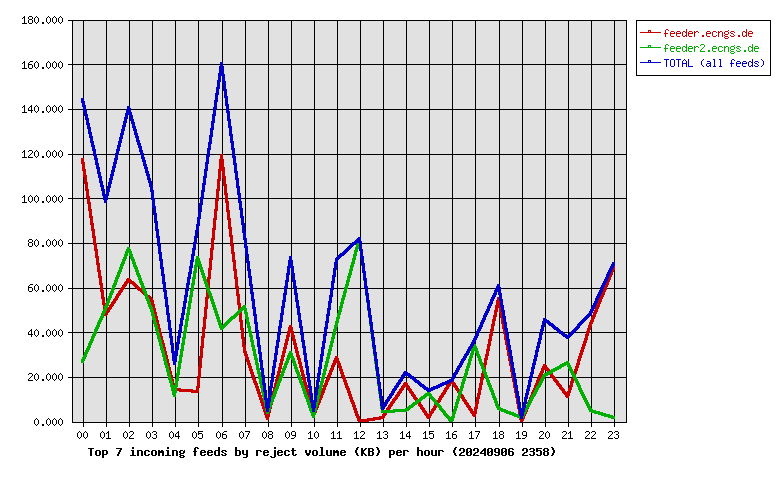
| Incoming Feed (+ Top1000 #) | Rej. Vol. | %Vol | Kbps | Accepted | %Acc | %Tot | KB/art | Check | Ihave | Spam | TooOld | Rejs | Errs | ||
|---|---|---|---|---|---|---|---|---|---|---|---|---|---|---|---|
| 1 | feeder.ecngs.de | 779.19KB | 54.22 | 0.07 | 5388611 | 88.04 | 95.11 | 729.47 | 6120280 | 0 | 0 | 0 | 91 | 0 | |
| 2 | feeder2.ecngs.de | 657.84KB | 45.78 | 0.06 | 277168 | 37.40 | 4.89 | 8.13 | 740939 | 0 | 0 | 0 | 95 | 0 | |
| Total | 1.40MB | 100.00 | 0.13 | 5665779 | 0.00 | 100.00 | 694.18 | 6861219 | 0 | 0 | 0 | 186 | 0 | ||
 |
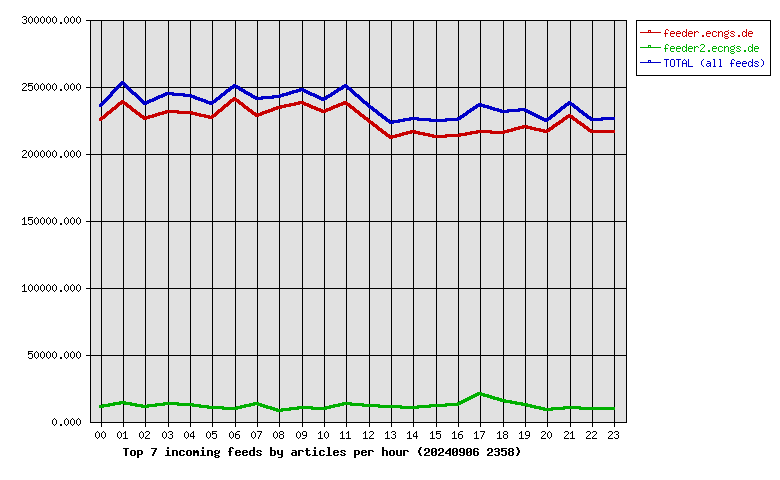
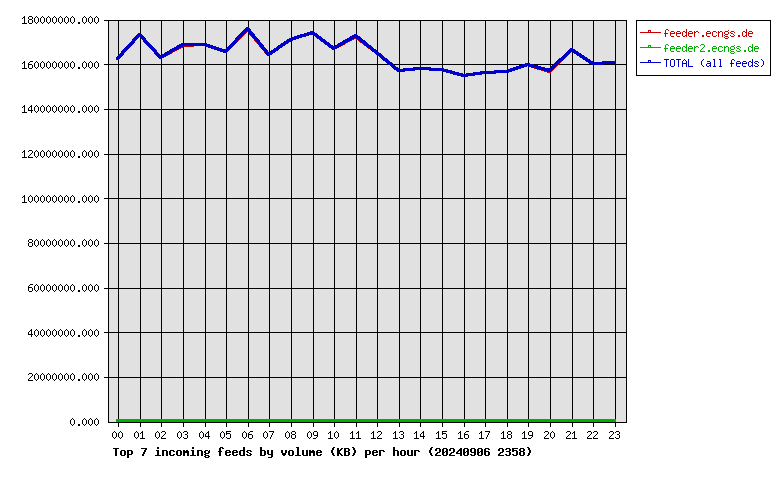
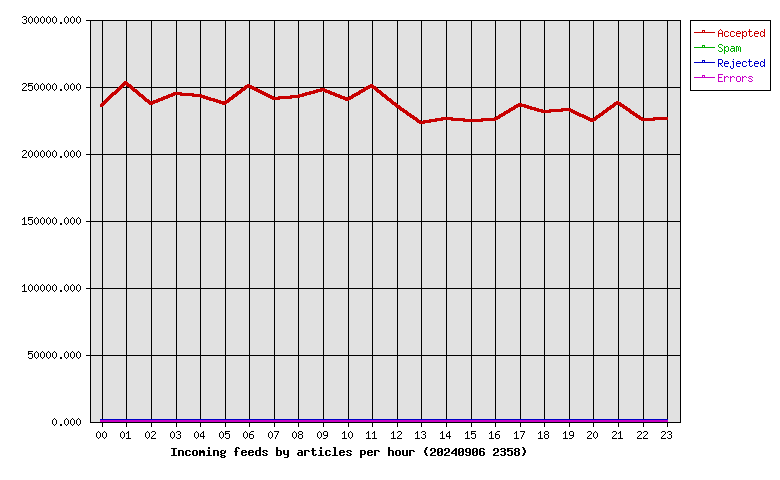
| Hour | Accepted | %Acc | Volume | %Vol | Check | Ihave | Spam | Rejs | Errs |
|---|---|---|---|---|---|---|---|---|---|
| 00 | 235557 | 4.16 | 154.87GB | 4.13 | 261798 | 0 | 0 | 16 | 0 |
| 01 | 252518 | 4.46 | 165.07GB | 4.40 | 268423 | 0 | 0 | 11 | 0 |
| 02 | 236870 | 4.18 | 155.15GB | 4.14 | 250256 | 0 | 0 | 9 | 0 |
| 03 | 244379 | 4.31 | 160.60GB | 4.28 | 259963 | 0 | 0 | 19 | 0 |
| 04 | 242543 | 4.28 | 160.63GB | 4.28 | 255703 | 0 | 0 | 9 | 0 |
| 05 | 237163 | 4.19 | 157.96GB | 4.21 | 249241 | 0 | 0 | 15 | 0 |
| 06 | 250107 | 4.41 | 167.51GB | 4.47 | 290973 | 0 | 0 | 15 | 0 |
| 07 | 240809 | 4.25 | 156.43GB | 4.17 | 321965 | 0 | 0 | 14 | 0 |
| 08 | 241966 | 4.27 | 162.95GB | 4.34 | 313639 | 0 | 0 | 2 | 0 |
| 09 | 247615 | 4.37 | 165.88GB | 4.42 | 319191 | 0 | 0 | 6 | 0 |
| 10 | 239845 | 4.23 | 159.09GB | 4.24 | 305405 | 0 | 0 | 3 | 0 |
| 11 | 250643 | 4.42 | 164.43GB | 4.38 | 316977 | 0 | 0 | 8 | 0 |
| 12 | 235544 | 4.16 | 157.51GB | 4.20 | 296719 | 0 | 0 | 9 | 0 |
| 13 | 222654 | 3.93 | 149.65GB | 3.99 | 289630 | 0 | 0 | 3 | 0 |
| 14 | 225668 | 3.98 | 150.74GB | 4.02 | 291871 | 0 | 0 | 3 | 0 |
| 15 | 224035 | 3.95 | 150.26GB | 4.01 | 287433 | 0 | 0 | 2 | 0 |
| 16 | 225039 | 3.97 | 147.57GB | 3.93 | 280517 | 0 | 0 | 2 | 0 |
| 17 | 236511 | 4.17 | 148.98GB | 3.97 | 304075 | 0 | 0 | 7 | 0 |
| 18 | 230656 | 4.07 | 149.34GB | 3.98 | 295964 | 0 | 0 | 10 | 0 |
| 19 | 232416 | 4.10 | 152.21GB | 4.06 | 292866 | 0 | 0 | 1 | 0 |
| 20 | 224508 | 3.96 | 149.52GB | 3.99 | 272372 | 0 | 0 | 4 | 0 |
| 21 | 237959 | 4.20 | 158.54GB | 4.23 | 287213 | 0 | 0 | 8 | 0 |
| 22 | 224857 | 3.97 | 152.73GB | 4.07 | 275043 | 0 | 0 | 6 | 0 |
| 23 | 225917 | 3.99 | 153.27GB | 4.09 | 273982 | 0 | 0 | 4 | 0 |
| Total | 5665779 | 100.00 | 3.66TB | 100.00 | 6861219 | 0 | 0 | 186 | 0 |
 |
| Outgoing Feed (+ Top1000 #) | Accepted | %Acc | %Tot | Art/sec | Volume | %Vol | KB/art | Dups | Rejs | % Ratio (Out/In) | ||
|---|---|---|---|---|---|---|---|---|---|---|---|---|
| 1 | 217.73.144.40 | 0 | 0.00 | 0.00 | 0.00 | 0.00KB | 0.00 | 0.00 | 5691648 | 0 | … | |
| Total | 0 | 0.00 | 0.00 | 0.00 | 0.00KB | 0.00 | 0.00 | 5691648 | 0 | |||
 |
| Outgoing Feed (+ Top1000 #) | Volume | %Vol | Kbps | Accepted | %Acc | %Tot | KB/art | Dups | Rejs | % Ratio (Out/In) | ||
|---|---|---|---|---|---|---|---|---|---|---|---|---|
| 1 | 217.73.144.40 | 0.00KB | 0.00 | 0.00 | 0 | 0.00 | 0.00 | 0.00 | 5691648 | 0 | … | |
| Total | 0.00KB | 0.00 | 0.00 | 0 | 0.00 | 0.00 | 0.00 | 5691648 | 0 | |||
 |
| Outgoing Feed (+ Top1000 #) | Rej. Vol. | %Vol | Kbps | Accepted | %Acc | %Tot | KB/art | Dups | Rejs | % Ratio (Out/In) | ||
|---|---|---|---|---|---|---|---|---|---|---|---|---|
| 1 | 217.73.144.40 | 0.00KB | 0.00 | 0.00 | 0 | 0.00 | 0.00 | 0.00 | 5691648 | 0 | … | |
| Total | 0.00KB | 0.00 | 0.00 | 0 | 0.00 | 0.00 | 0.00 | 5691648 | 0 | |||
 |
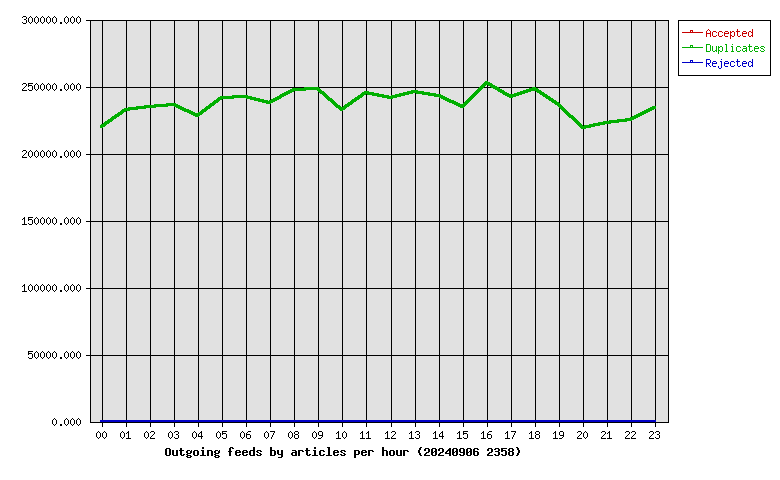
| Hour | Accepted | %Acc | Volume | %Vol | dups | Rejs |
|---|---|---|---|---|---|---|
| 00 | 0 | 0.00 | 0.00KB | 0.00 | 219794 | 0 |
| 01 | 0 | 0.00 | 0.00KB | 0.00 | 232828 | 0 |
| 02 | 0 | 0.00 | 0.00KB | 0.00 | 234872 | 0 |
| 03 | 0 | 0.00 | 0.00KB | 0.00 | 236409 | 0 |
| 04 | 0 | 0.00 | 0.00KB | 0.00 | 227999 | 0 |
| 05 | 0 | 0.00 | 0.00KB | 0.00 | 241675 | 0 |
| 06 | 0 | 0.00 | 0.00KB | 0.00 | 242155 | 0 |
| 07 | 0 | 0.00 | 0.00KB | 0.00 | 238025 | 0 |
| 08 | 0 | 0.00 | 0.00KB | 0.00 | 247569 | 0 |
| 09 | 0 | 0.00 | 0.00KB | 0.00 | 248204 | 0 |
| 10 | 0 | 0.00 | 0.00KB | 0.00 | 232364 | 0 |
| 11 | 0 | 0.00 | 0.00KB | 0.00 | 245319 | 0 |
| 12 | 0 | 0.00 | 0.00KB | 0.00 | 241198 | 0 |
| 13 | 0 | 0.00 | 0.00KB | 0.00 | 245681 | 0 |
| 14 | 0 | 0.00 | 0.00KB | 0.00 | 243174 | 0 |
| 15 | 0 | 0.00 | 0.00KB | 0.00 | 234568 | 0 |
| 16 | 0 | 0.00 | 0.00KB | 0.00 | 252513 | 0 |
| 17 | 0 | 0.00 | 0.00KB | 0.00 | 242214 | 0 |
| 18 | 0 | 0.00 | 0.00KB | 0.00 | 248211 | 0 |
| 19 | 0 | 0.00 | 0.00KB | 0.00 | 236153 | 0 |
| 20 | 0 | 0.00 | 0.00KB | 0.00 | 219343 | 0 |
| 21 | 0 | 0.00 | 0.00KB | 0.00 | 222673 | 0 |
| 22 | 0 | 0.00 | 0.00KB | 0.00 | 224850 | 0 |
| 23 | 0 | 0.00 | 0.00KB | 0.00 | 233857 | 0 |
| Total | 0 | 0.00 | 0.00KB | 0.00 | 5691648 | 0 |
 |
| >= 20% Full | >= 35% Full | >= 50% Full | >= 65% Full | >= 80% Full | >= 95% Full |
| Outgoing Feed | Batch Seq | Batch Num | Batch Max | %Full | Av. Pending |
|---|---|---|---|---|---|
| nbr.elbracht.net-o | 984607-984688 | 81 | 500 | 16 | 0.0 |
| text-spool-out | 0-0 | 0 | 500 | 0 | 0.0 |
| 1st Time | Last Time | # Msgs | Message |
|---|