| |
DIABLO statistics for newsfeed.yoursite.com on Thu 05 Sep 2024 |
Generated on 20240905 2358 by feeder-stats v4.006. Copyright © 2002 The Diablo Project.
Diablo running processes:  81    Dnewslink running processes:  0


11:59PM  up 200 days,  7:18, 0 users, load averages: 1.32, 0.77, 0.64

Filesystem     Size    Used   Avail Capacity  Mounted on
/dev/da0s1g     94G    1.2G     85G     1%    /news
/dev/da1       7.3T    5.7T      1T    85%    /news2/spool/news/00
/dev/da2       7.3T    5.7T      1T    85%    /news2/spool/news/01
/dev/da3       3.7T    3.3T     65G    98%    /news2/spool/news/02
/dev/da4       5.5T    2.9T    2.2T    57%    /news2/spool/news/03
/dev/da8       7.3T    5.7T      1T    85%    /news2/spool/news/04
/dev/da9       7.3T    5.7T    1.0T    85%    /news2/spool/news/05
/dev/da10      7.3T    5.7T      1T    85%    /news2/spool/news/06
/dev/da11      5.5T      5T     67G    99%    /news2/spool/news/07
/dev/da12      5.5T    4.2T    800G    84%    /news2/spool/news/08
/dev/da13      7.3T    5.7T      1T    85%    /news2/spool/news/09
/dev/da14      7.3T    5.7T      1T    85%    /news2/spool/news/10
/dev/da15      7.3T    5.7T      1T    85%    /news2/spool/news/11
/dev/da16      7.3T    5.7T      1T    85%    /news2/spool/news/12
/dev/da17      7.3T    5.7T      1T    85%    /news2/spool/news/13
/dev/da18      7.3T    5.7T      1T    85%    /news2/spool/news/14
/dev/da19      7.3T    5.7T      1T    85%    /news2/spool/news/15
/dev/da20      7.3T    5.7T      1T    85%    /news2/spool/news/16
/dev/da21      7.3T    5.7T      1T    85%    /news2/spool/news/17
/dev/da22      7.3T    5.7T      1T    85%    /news2/spool/news/18
/dev/da23      7.3T    5.7T      1T    85%    /news2/spool/news/19
/dev/da24      7.3T    5.7T      1T    85%    /news2/spool/news/20
/dev/da25      7.3T    5.7T      1T    85%    /news2/spool/news/21
/dev/da26      7.3T    5.7T      1T    85%    /news2/spool/news/22
/dev/da5       221G     34G    169G    17%    /news1
/dev/md0        40G     12G     23G    36%    /news3
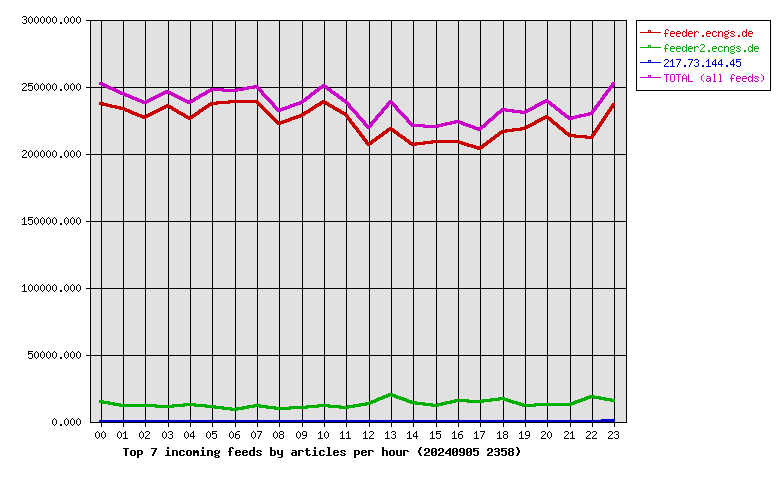
| Incoming Feed (+ Top1000 #) | Accepted | %Acc | %Tot | Art/sec | Volume | %Vol | KB/art | Check | Ihave | Spam | TooOld | Rejs | Errs | ||
|---|---|---|---|---|---|---|---|---|---|---|---|---|---|---|---|
| 1 | feeder.ecngs.de | 5361390 | 93.37 | 94.59 | 62.05 | 3.63TB | 99.92 | 726.68 | 5741954 | 0 | 0 | 0 | 152 | 0 | |
| 2 | feeder2.ecngs.de | 306807 | 76.59 | 5.41 | 3.55 | 3.02GB | 0.08 | 10.33 | 400467 | 0 | 0 | 0 | 118 | 0 | |
| 3 | 217.73.144.45 | 23 | 95.83 | 0.00 | 0.03 | 1.82MB | 0.00 | 80.94 | 24 | 0 | 0 | 0 | 0 | 0 | |
| Total | 5668220 | 0.00 | 100.00 | 65.63 | 3.63TB | 100.00 | 687.90 | 6142445 | 0 | 0 | 0 | 270 | 0 | ||
 |
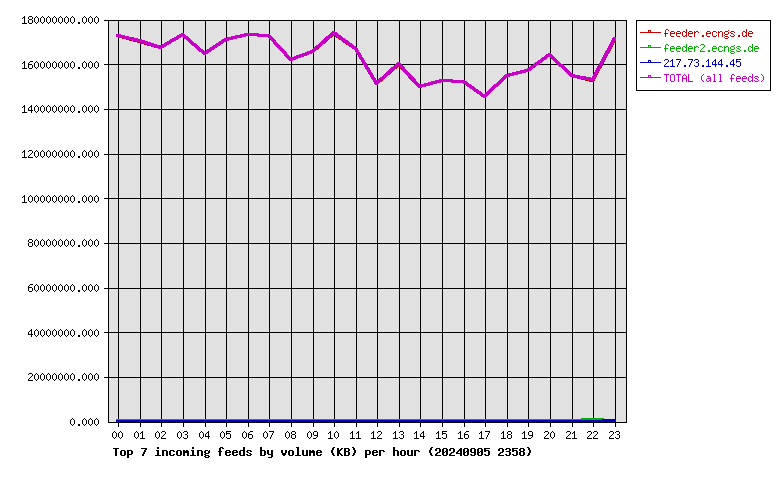
| Incoming Feed (+ Top1000 #) | Volume | %Vol | Kbps | Accepted | %Acc | %Tot | KB/art | Check | Ihave | Spam | TooOld | Rejs | Errs | ||
|---|---|---|---|---|---|---|---|---|---|---|---|---|---|---|---|
| 1 | feeder.ecngs.de | 3.63TB | 99.92 | 360741.83 | 5361390 | 93.37 | 94.59 | 726.68 | 5741954 | 0 | 0 | 0 | 152 | 0 | |
| 2 | feeder2.ecngs.de | 3.02GB | 0.08 | 293.38 | 306807 | 76.59 | 5.41 | 10.33 | 400467 | 0 | 0 | 0 | 118 | 0 | |
| 3 | 217.73.144.45 | 1.82MB | 0.00 | 18.69 | 23 | 95.83 | 0.00 | 80.94 | 24 | 0 | 0 | 0 | 0 | 0 | |
| Total | 3.63TB | 100.00 | 361053.90 | 5668220 | 0.00 | 100.00 | 687.90 | 6142445 | 0 | 0 | 0 | 270 | 0 | ||
 |
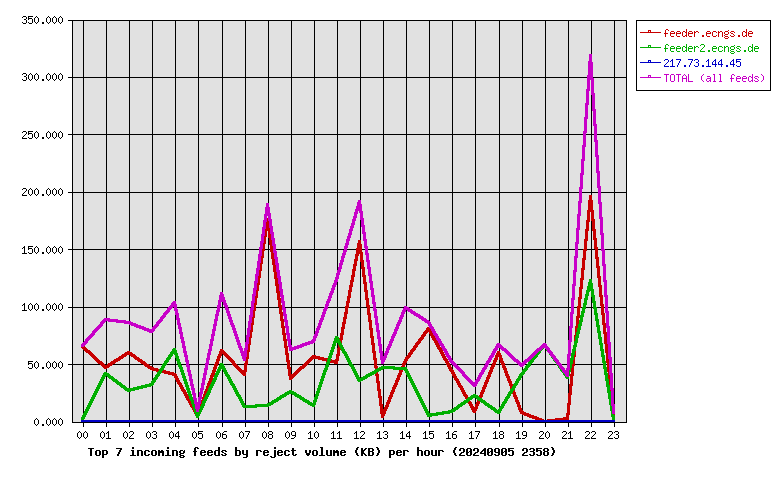
| Incoming Feed (+ Top1000 #) | Rej. Vol. | %Vol | Kbps | Accepted | %Acc | %Tot | KB/art | Check | Ihave | Spam | TooOld | Rejs | Errs | ||
|---|---|---|---|---|---|---|---|---|---|---|---|---|---|---|---|
| 1 | feeder.ecngs.de | 1.27MB | 62.09 | 0.12 | 5361390 | 93.37 | 94.59 | 726.68 | 5741954 | 0 | 0 | 0 | 152 | 0 | |
| 2 | feeder2.ecngs.de | 793.50KB | 37.91 | 0.07 | 306807 | 76.59 | 5.41 | 10.33 | 400467 | 0 | 0 | 0 | 118 | 0 | |
| 3 | 217.73.144.45 | 0.00KB | 0.00 | 0.00 | 23 | 95.83 | 0.00 | 80.94 | 24 | 0 | 0 | 0 | 0 | 0 | |
| Total | 2.04MB | 100.00 | 0.19 | 5668220 | 0.00 | 100.00 | 687.90 | 6142445 | 0 | 0 | 0 | 270 | 0 | ||
 |
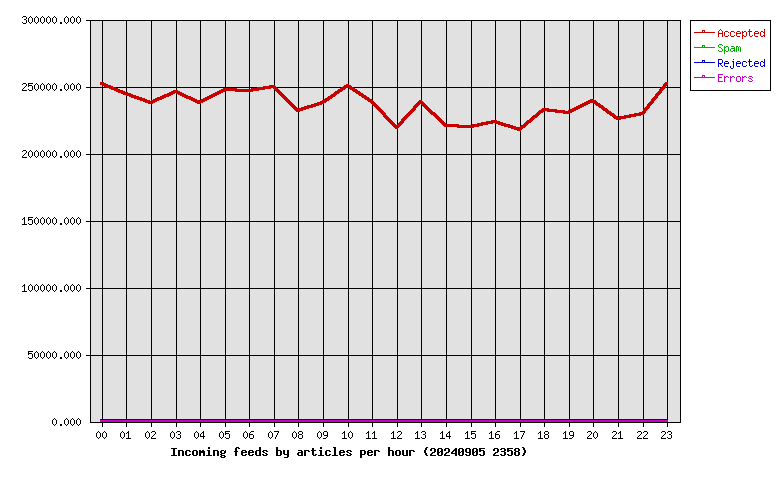
| Hour | Accepted | %Acc | Volume | %Vol | Check | Ihave | Spam | Rejs | Errs |
|---|---|---|---|---|---|---|---|---|---|
| 00 | 251677 | 4.44 | 164.57GB | 4.43 | 267771 | 0 | 0 | 9 | 0 |
| 01 | 244710 | 4.32 | 162.35GB | 4.37 | 261176 | 0 | 0 | 9 | 0 |
| 02 | 237911 | 4.20 | 159.63GB | 4.29 | 251892 | 0 | 0 | 9 | 0 |
| 03 | 245975 | 4.34 | 165.19GB | 4.44 | 260569 | 0 | 0 | 10 | 0 |
| 04 | 237592 | 4.19 | 156.94GB | 4.22 | 253627 | 0 | 0 | 18 | 0 |
| 05 | 247485 | 4.37 | 162.93GB | 4.38 | 265182 | 0 | 0 | 5 | 0 |
| 06 | 246758 | 4.35 | 165.07GB | 4.44 | 256755 | 0 | 0 | 14 | 0 |
| 07 | 249986 | 4.41 | 164.73GB | 4.43 | 263204 | 0 | 0 | 9 | 0 |
| 08 | 231778 | 4.09 | 154.54GB | 4.16 | 242590 | 0 | 0 | 16 | 0 |
| 09 | 237771 | 4.19 | 157.84GB | 4.24 | 249892 | 0 | 0 | 14 | 0 |
| 10 | 250240 | 4.41 | 165.78GB | 4.46 | 263433 | 0 | 0 | 14 | 0 |
| 11 | 238273 | 4.20 | 159.01GB | 4.28 | 249694 | 0 | 0 | 19 | 0 |
| 12 | 219256 | 3.87 | 144.11GB | 3.88 | 232390 | 0 | 0 | 20 | 0 |
| 13 | 238286 | 4.20 | 152.49GB | 4.10 | 260372 | 0 | 0 | 15 | 0 |
| 14 | 220378 | 3.89 | 142.98GB | 3.85 | 237566 | 0 | 0 | 7 | 0 |
| 15 | 219828 | 3.88 | 145.55GB | 3.91 | 232726 | 0 | 0 | 10 | 0 |
| 16 | 223774 | 3.95 | 144.92GB | 3.90 | 241310 | 0 | 0 | 7 | 0 |
| 17 | 217561 | 3.84 | 138.72GB | 3.73 | 234322 | 0 | 0 | 8 | 0 |
| 18 | 232322 | 4.10 | 147.73GB | 3.97 | 255607 | 0 | 0 | 14 | 0 |
| 19 | 230133 | 4.06 | 149.83GB | 4.03 | 252517 | 0 | 0 | 7 | 0 |
| 20 | 239435 | 4.22 | 156.71GB | 4.21 | 269649 | 0 | 0 | 9 | 0 |
| 21 | 225846 | 3.98 | 147.58GB | 3.97 | 265759 | 0 | 0 | 5 | 0 |
| 22 | 229627 | 4.05 | 146.03GB | 3.93 | 274416 | 0 | 0 | 19 | 0 |
| 23 | 251618 | 4.44 | 163.32GB | 4.39 | 300026 | 0 | 0 | 3 | 0 |
| Total | 5668220 | 100.00 | 3.63TB | 100.00 | 6142445 | 0 | 0 | 270 | 0 |
 |
| Outgoing Feed (+ Top1000 #) | Accepted | %Acc | %Tot | Art/sec | Volume | %Vol | KB/art | Dups | Rejs | % Ratio (Out/In) | ||
|---|---|---|---|---|---|---|---|---|---|---|---|---|
| 1 | 217.73.144.40 | 0 | 0.00 | 0.00 | 0.00 | 0.00KB | 0.00 | 0.00 | 5681012 | 0 | … | |
| Total | 0 | 0.00 | 0.00 | 0.00 | 0.00KB | 0.00 | 0.00 | 5681012 | 0 | |||
 |
| Outgoing Feed (+ Top1000 #) | Volume | %Vol | Kbps | Accepted | %Acc | %Tot | KB/art | Dups | Rejs | % Ratio (Out/In) | ||
|---|---|---|---|---|---|---|---|---|---|---|---|---|
| 1 | 217.73.144.40 | 0.00KB | 0.00 | 0.00 | 0 | 0.00 | 0.00 | 0.00 | 5681012 | 0 | … | |
| Total | 0.00KB | 0.00 | 0.00 | 0 | 0.00 | 0.00 | 0.00 | 5681012 | 0 | |||
 |
| Outgoing Feed (+ Top1000 #) | Rej. Vol. | %Vol | Kbps | Accepted | %Acc | %Tot | KB/art | Dups | Rejs | % Ratio (Out/In) | ||
|---|---|---|---|---|---|---|---|---|---|---|---|---|
| 1 | 217.73.144.40 | 0.00KB | 0.00 | 0.00 | 0 | 0.00 | 0.00 | 0.00 | 5681012 | 0 | … | |
| Total | 0.00KB | 0.00 | 0.00 | 0 | 0.00 | 0.00 | 0.00 | 5681012 | 0 | |||
 |
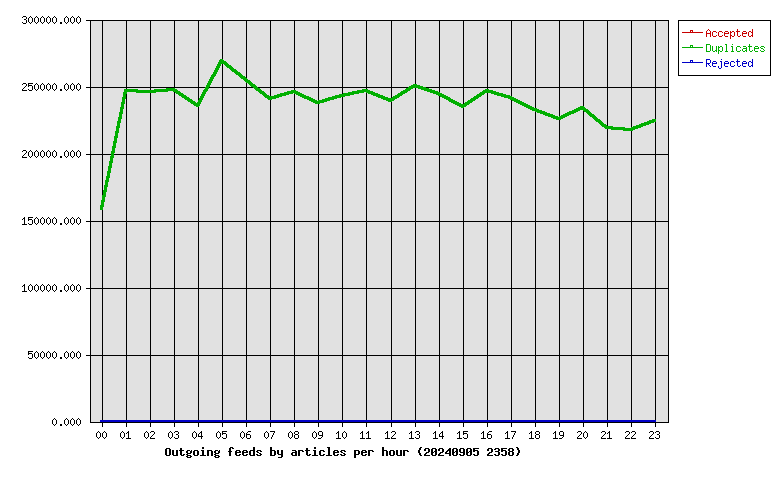
| Hour | Accepted | %Acc | Volume | %Vol | dups | Rejs |
|---|---|---|---|---|---|---|
| 00 | 0 | 0.00 | 0.00KB | 0.00 | 158479 | 0 |
| 01 | 0 | 0.00 | 0.00KB | 0.00 | 246582 | 0 |
| 02 | 0 | 0.00 | 0.00KB | 0.00 | 246114 | 0 |
| 03 | 0 | 0.00 | 0.00KB | 0.00 | 247288 | 0 |
| 04 | 0 | 0.00 | 0.00KB | 0.00 | 235099 | 0 |
| 05 | 0 | 0.00 | 0.00KB | 0.00 | 268997 | 0 |
| 06 | 0 | 0.00 | 0.00KB | 0.00 | 254528 | 0 |
| 07 | 0 | 0.00 | 0.00KB | 0.00 | 240786 | 0 |
| 08 | 0 | 0.00 | 0.00KB | 0.00 | 246202 | 0 |
| 09 | 0 | 0.00 | 0.00KB | 0.00 | 237598 | 0 |
| 10 | 0 | 0.00 | 0.00KB | 0.00 | 243202 | 0 |
| 11 | 0 | 0.00 | 0.00KB | 0.00 | 246307 | 0 |
| 12 | 0 | 0.00 | 0.00KB | 0.00 | 239364 | 0 |
| 13 | 0 | 0.00 | 0.00KB | 0.00 | 250539 | 0 |
| 14 | 0 | 0.00 | 0.00KB | 0.00 | 244089 | 0 |
| 15 | 0 | 0.00 | 0.00KB | 0.00 | 234534 | 0 |
| 16 | 0 | 0.00 | 0.00KB | 0.00 | 246626 | 0 |
| 17 | 0 | 0.00 | 0.00KB | 0.00 | 241517 | 0 |
| 18 | 0 | 0.00 | 0.00KB | 0.00 | 232235 | 0 |
| 19 | 0 | 0.00 | 0.00KB | 0.00 | 226079 | 0 |
| 20 | 0 | 0.00 | 0.00KB | 0.00 | 233826 | 0 |
| 21 | 0 | 0.00 | 0.00KB | 0.00 | 219119 | 0 |
| 22 | 0 | 0.00 | 0.00KB | 0.00 | 217325 | 0 |
| 23 | 0 | 0.00 | 0.00KB | 0.00 | 224577 | 0 |
| Total | 0 | 0.00 | 0.00KB | 0.00 | 5681012 | 0 |
 |
| >= 20% Full | >= 35% Full | >= 50% Full | >= 65% Full | >= 80% Full | >= 95% Full |
| Outgoing Feed | Batch Seq | Batch Num | Batch Max | %Full | Av. Pending |
|---|---|---|---|---|---|
| nbr.elbracht.net-o | 984319-984400 | 81 | 500 | 16 | 0.0 |
| text-spool-out | 0-0 | 0 | 500 | 0 | 0.0 |
| 1st Time | Last Time | # Msgs | Message |
|---|---|---|---|
| 10:18:49 | 10:19:00 | 3 | DNS Fwd/Rev mismatch: lookup of scanner-06.ch1.censys-scanner.com failed |