| |
DIABLO statistics for newsfeed.yoursite.com on Wed 04 Sep 2024 |
Generated on 20240904 2358 by feeder-stats v4.006. Copyright © 2002 The Diablo Project.
Diablo running processes:  81    Dnewslink running processes:  0


11:59PM  up 199 days,  7:18, 0 users, load averages: 1.31, 0.65, 0.53

Filesystem     Size    Used   Avail Capacity  Mounted on
/dev/da0s1g     94G    1.2G     85G     1%    /news
/dev/da1       7.3T    5.7T      1T    85%    /news2/spool/news/00
/dev/da2       7.3T    5.7T      1T    85%    /news2/spool/news/01
/dev/da3       3.7T    3.3T     67G    98%    /news2/spool/news/02
/dev/da4       5.5T    2.9T    2.2T    57%    /news2/spool/news/03
/dev/da8       7.3T    5.7T      1T    85%    /news2/spool/news/04
/dev/da9       7.3T    5.7T      1T    85%    /news2/spool/news/05
/dev/da10      7.3T    5.7T      1T    85%    /news2/spool/news/06
/dev/da11      5.5T      5T     67G    99%    /news2/spool/news/07
/dev/da12      5.5T    4.2T    795G    85%    /news2/spool/news/08
/dev/da13      7.3T    5.7T      1T    85%    /news2/spool/news/09
/dev/da14      7.3T    5.7T      1T    85%    /news2/spool/news/10
/dev/da15      7.3T    5.7T      1T    85%    /news2/spool/news/11
/dev/da16      7.3T    5.7T      1T    85%    /news2/spool/news/12
/dev/da17      7.3T    5.7T      1T    85%    /news2/spool/news/13
/dev/da18      7.3T    5.7T      1T    85%    /news2/spool/news/14
/dev/da19      7.3T    5.7T      1T    85%    /news2/spool/news/15
/dev/da20      7.3T    5.7T      1T    85%    /news2/spool/news/16
/dev/da21      7.3T    5.7T      1T    85%    /news2/spool/news/17
/dev/da22      7.3T    5.7T      1T    85%    /news2/spool/news/18
/dev/da23      7.3T    5.7T      1T    85%    /news2/spool/news/19
/dev/da24      7.3T    5.7T      1T    85%    /news2/spool/news/20
/dev/da25      7.3T    5.7T      1T    85%    /news2/spool/news/21
/dev/da26      7.3T    5.7T      1T    85%    /news2/spool/news/22
/dev/da5       221G     34G    169G    17%    /news1
/dev/md0        40G     12G     23G    36%    /news3
| Incoming Feed (+ Top1000 #) | Accepted | %Acc | %Tot | Art/sec | Volume | %Vol | KB/art | Check | Ihave | Spam | TooOld | Rejs | Errs | ||
|---|---|---|---|---|---|---|---|---|---|---|---|---|---|---|---|
| 1 | feeder.ecngs.de | 4431880 | 89.29 | 93.69 | 51.29 | 3.00TB | 99.91 | 727.31 | 4963228 | 0 | 0 | 0 | 149 | 0 | |
| 2 | feeder2.ecngs.de | 298720 | 54.73 | 6.31 | 3.46 | 2.71GB | 0.09 | 9.51 | 545658 | 0 | 0 | 0 | 111 | 0 | |
| Total | 4730600 | 0.00 | 100.00 | 54.75 | 3.00TB | 100.00 | 681.98 | 5508886 | 0 | 0 | 0 | 260 | 0 | ||
 |
| Incoming Feed (+ Top1000 #) | Volume | %Vol | Kbps | Accepted | %Acc | %Tot | KB/art | Check | Ihave | Spam | TooOld | Rejs | Errs | ||
|---|---|---|---|---|---|---|---|---|---|---|---|---|---|---|---|
| 1 | feeder.ecngs.de | 3.00TB | 99.91 | 298457.14 | 4431880 | 89.29 | 93.69 | 727.31 | 4963228 | 0 | 0 | 0 | 149 | 0 | |
| 2 | feeder2.ecngs.de | 2.71GB | 0.09 | 263.08 | 298720 | 54.73 | 6.31 | 9.51 | 545658 | 0 | 0 | 0 | 111 | 0 | |
| Total | 3.00TB | 100.00 | 298720.22 | 4730600 | 0.00 | 100.00 | 681.98 | 5508886 | 0 | 0 | 0 | 260 | 0 | ||
 |
| Incoming Feed (+ Top1000 #) | Rej. Vol. | %Vol | Kbps | Accepted | %Acc | %Tot | KB/art | Check | Ihave | Spam | TooOld | Rejs | Errs | ||
|---|---|---|---|---|---|---|---|---|---|---|---|---|---|---|---|
| 1 | feeder.ecngs.de | 1.13MB | 63.36 | 0.11 | 4431880 | 89.29 | 93.69 | 727.31 | 4963228 | 0 | 0 | 0 | 149 | 0 | |
| 2 | feeder2.ecngs.de | 666.81KB | 36.64 | 0.06 | 298720 | 54.73 | 6.31 | 9.51 | 545658 | 0 | 0 | 0 | 111 | 0 | |
| Total | 1.78MB | 100.00 | 0.17 | 4730600 | 0.00 | 100.00 | 681.98 | 5508886 | 0 | 0 | 0 | 260 | 0 | ||
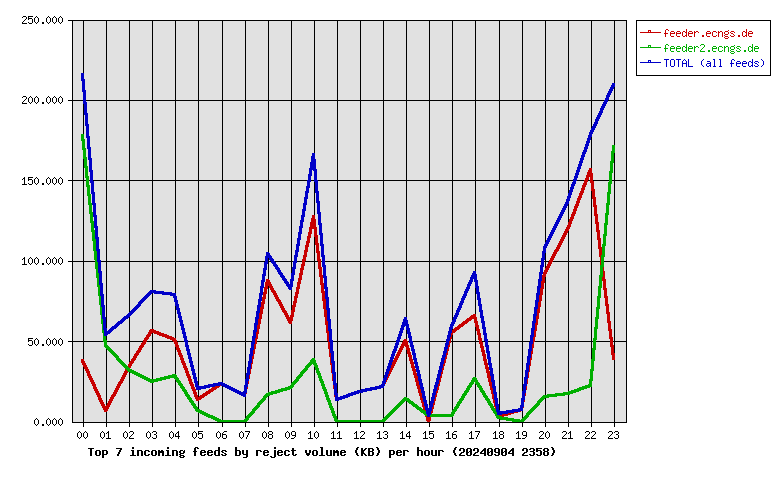 |
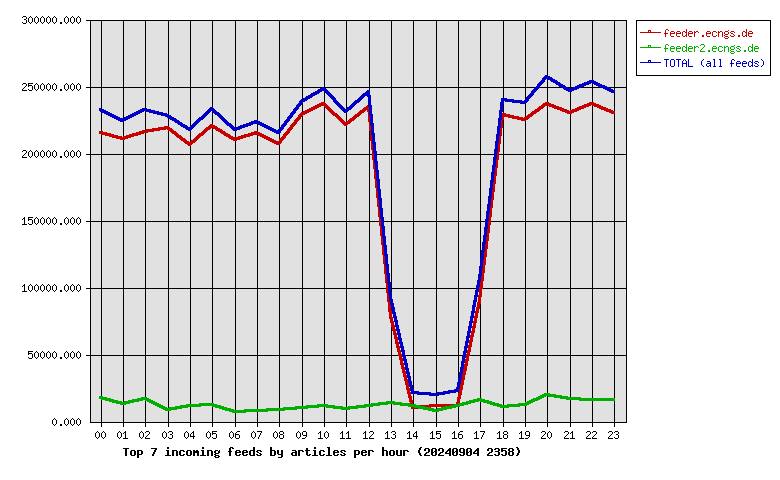
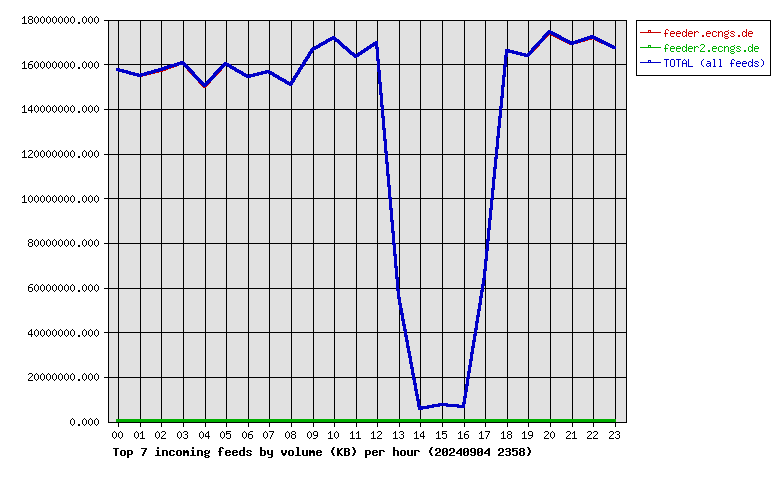
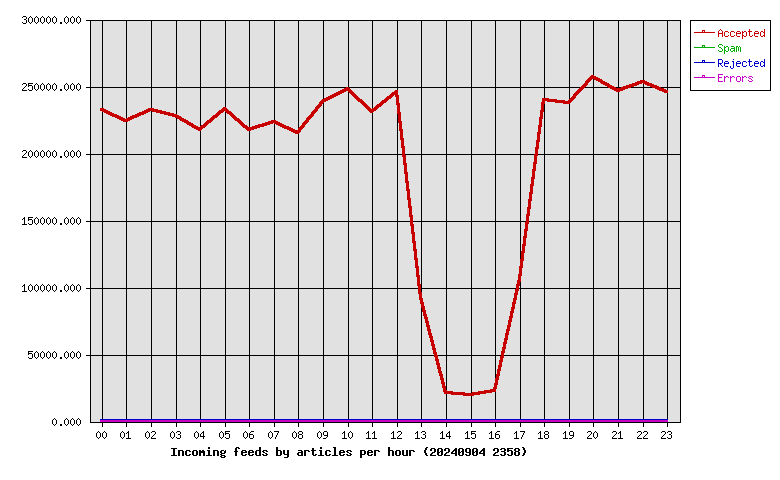
| Hour | Accepted | %Acc | Volume | %Vol | Check | Ihave | Spam | Rejs | Errs |
|---|---|---|---|---|---|---|---|---|---|
| 00 | 232768 | 4.92 | 150.07GB | 4.88 | 253033 | 0 | 0 | 17 | 0 |
| 01 | 223954 | 4.73 | 147.67GB | 4.80 | 245015 | 0 | 0 | 13 | 0 |
| 02 | 232681 | 4.92 | 149.91GB | 4.87 | 263885 | 0 | 0 | 11 | 0 |
| 03 | 227922 | 4.82 | 153.15GB | 4.98 | 262577 | 0 | 0 | 13 | 0 |
| 04 | 217826 | 4.60 | 143.11GB | 4.65 | 264293 | 0 | 0 | 11 | 0 |
| 05 | 232995 | 4.93 | 152.56GB | 4.96 | 267130 | 0 | 0 | 5 | 0 |
| 06 | 217453 | 4.60 | 147.26GB | 4.79 | 245003 | 0 | 0 | 1 | 0 |
| 07 | 223528 | 4.73 | 149.34GB | 4.85 | 250647 | 0 | 0 | 5 | 0 |
| 08 | 215237 | 4.55 | 143.62GB | 4.67 | 244597 | 0 | 0 | 11 | 0 |
| 09 | 238699 | 5.05 | 158.78GB | 5.16 | 268803 | 0 | 0 | 7 | 0 |
| 10 | 247964 | 5.24 | 163.82GB | 5.32 | 280472 | 0 | 0 | 18 | 0 |
| 11 | 230990 | 4.88 | 155.62GB | 5.06 | 262010 | 0 | 0 | 3 | 0 |
| 12 | 246159 | 5.20 | 161.73GB | 5.26 | 279007 | 0 | 0 | 3 | 0 |
| 13 | 91931 | 1.94 | 53.71GB | 1.75 | 129115 | 0 | 0 | 1 | 0 |
| 14 | 21281 | 0.45 | 5.28GB | 0.17 | 57920 | 0 | 0 | 8 | 0 |
| 15 | 19708 | 0.42 | 7.14GB | 0.23 | 53780 | 0 | 0 | 1 | 0 |
| 16 | 22642 | 0.48 | 6.31GB | 0.21 | 59114 | 0 | 0 | 9 | 0 |
| 17 | 106236 | 2.25 | 62.16GB | 2.02 | 146588 | 0 | 0 | 20 | 0 |
| 18 | 239778 | 5.07 | 158.18GB | 5.14 | 275848 | 0 | 0 | 3 | 0 |
| 19 | 237862 | 5.03 | 156.28GB | 5.08 | 266268 | 0 | 0 | 1 | 0 |
| 20 | 257031 | 5.43 | 166.25GB | 5.40 | 310177 | 0 | 0 | 13 | 0 |
| 21 | 246885 | 5.22 | 161.16GB | 5.24 | 284770 | 0 | 0 | 15 | 0 |
| 22 | 253174 | 5.35 | 163.99GB | 5.33 | 272187 | 0 | 0 | 36 | 0 |
| 23 | 245896 | 5.20 | 159.63GB | 5.19 | 266647 | 0 | 0 | 35 | 0 |
| Total | 4730600 | 100.00 | 3.00TB | 100.00 | 5508886 | 0 | 0 | 260 | 0 |
 |
| Outgoing Feed (+ Top1000 #) | Accepted | %Acc | %Tot | Art/sec | Volume | %Vol | KB/art | Dups | Rejs | % Ratio (Out/In) | ||
|---|---|---|---|---|---|---|---|---|---|---|---|---|
| 1 | 217.73.144.40 | 0 | 0.00 | 0.00 | 0.00 | 0.00KB | 0.00 | 0.00 | 4669011 | 0 | … | |
| Total | 0 | 0.00 | 0.00 | 0.00 | 0.00KB | 0.00 | 0.00 | 4669011 | 0 | |||
 |
| Outgoing Feed (+ Top1000 #) | Volume | %Vol | Kbps | Accepted | %Acc | %Tot | KB/art | Dups | Rejs | % Ratio (Out/In) | ||
|---|---|---|---|---|---|---|---|---|---|---|---|---|
| 1 | 217.73.144.40 | 0.00KB | 0.00 | 0.00 | 0 | 0.00 | 0.00 | 0.00 | 4669011 | 0 | … | |
| Total | 0.00KB | 0.00 | 0.00 | 0 | 0.00 | 0.00 | 0.00 | 4669011 | 0 | |||
 |
| Outgoing Feed (+ Top1000 #) | Rej. Vol. | %Vol | Kbps | Accepted | %Acc | %Tot | KB/art | Dups | Rejs | % Ratio (Out/In) | ||
|---|---|---|---|---|---|---|---|---|---|---|---|---|
| 1 | 217.73.144.40 | 0.00KB | 0.00 | 0.00 | 0 | 0.00 | 0.00 | 0.00 | 4669011 | 0 | … | |
| Total | 0.00KB | 0.00 | 0.00 | 0 | 0.00 | 0.00 | 0.00 | 4669011 | 0 | |||
 |
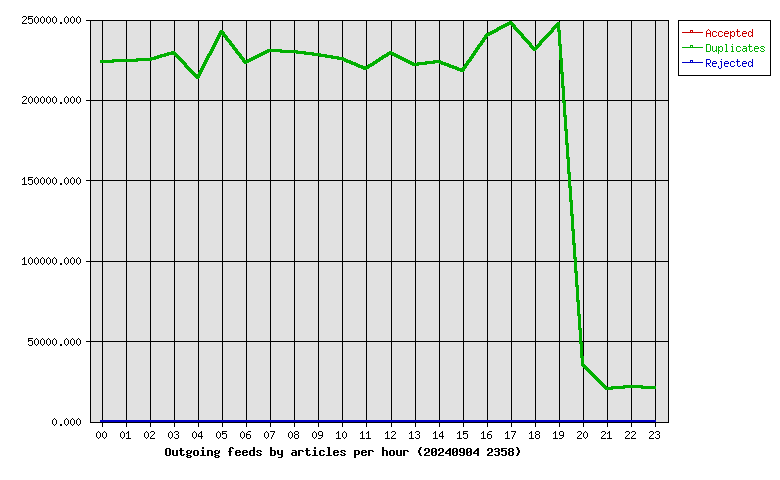
| Hour | Accepted | %Acc | Volume | %Vol | dups | Rejs |
|---|---|---|---|---|---|---|
| 00 | 0 | 0.00 | 0.00KB | 0.00 | 223762 | 0 |
| 01 | 0 | 0.00 | 0.00KB | 0.00 | 223960 | 0 |
| 02 | 0 | 0.00 | 0.00KB | 0.00 | 224587 | 0 |
| 03 | 0 | 0.00 | 0.00KB | 0.00 | 229270 | 0 |
| 04 | 0 | 0.00 | 0.00KB | 0.00 | 213855 | 0 |
| 05 | 0 | 0.00 | 0.00KB | 0.00 | 242221 | 0 |
| 06 | 0 | 0.00 | 0.00KB | 0.00 | 223158 | 0 |
| 07 | 0 | 0.00 | 0.00KB | 0.00 | 230574 | 0 |
| 08 | 0 | 0.00 | 0.00KB | 0.00 | 229661 | 0 |
| 09 | 0 | 0.00 | 0.00KB | 0.00 | 227888 | 0 |
| 10 | 0 | 0.00 | 0.00KB | 0.00 | 225249 | 0 |
| 11 | 0 | 0.00 | 0.00KB | 0.00 | 219039 | 0 |
| 12 | 0 | 0.00 | 0.00KB | 0.00 | 229446 | 0 |
| 13 | 0 | 0.00 | 0.00KB | 0.00 | 221848 | 0 |
| 14 | 0 | 0.00 | 0.00KB | 0.00 | 223510 | 0 |
| 15 | 0 | 0.00 | 0.00KB | 0.00 | 218013 | 0 |
| 16 | 0 | 0.00 | 0.00KB | 0.00 | 239691 | 0 |
| 17 | 0 | 0.00 | 0.00KB | 0.00 | 247517 | 0 |
| 18 | 0 | 0.00 | 0.00KB | 0.00 | 230778 | 0 |
| 19 | 0 | 0.00 | 0.00KB | 0.00 | 247358 | 0 |
| 20 | 0 | 0.00 | 0.00KB | 0.00 | 34904 | 0 |
| 21 | 0 | 0.00 | 0.00KB | 0.00 | 20476 | 0 |
| 22 | 0 | 0.00 | 0.00KB | 0.00 | 21517 | 0 |
| 23 | 0 | 0.00 | 0.00KB | 0.00 | 20729 | 0 |
| Total | 0 | 0.00 | 0.00KB | 0.00 | 4669011 | 0 |
 |
| >= 20% Full | >= 35% Full | >= 50% Full | >= 65% Full | >= 80% Full | >= 95% Full |
| Outgoing Feed | Batch Seq | Batch Num | Batch Max | %Full | Av. Pending |
|---|---|---|---|---|---|
| nbr.elbracht.net-o | 984031-984112 | 81 | 500 | 16 | 0.0 |
| text-spool-out | 0-0 | 0 | 500 | 0 | 0.0 |
| 1st Time | Last Time | # Msgs | Message |
|---|---|---|---|
| 14:01:55 | 14:02:04 | 3 | DNS Fwd/Rev mismatch: lookup of scanner-205.hk2.censys-scanner.com failed |