| |
DIABLO statistics for newsfeed.yoursite.com on Tue 03 Sep 2024 |
Generated on 20240903 2358 by feeder-stats v4.006. Copyright © 2002 The Diablo Project.
Diablo running processes:  81    Dnewslink running processes:  0


11:59PM  up 198 days,  7:18, 0 users, load averages: 2.38, 1.94, 1.42

Filesystem     Size    Used   Avail Capacity  Mounted on
/dev/da0s1g     94G    1.2G     85G     1%    /news
/dev/da1       7.3T    5.7T    989G    86%    /news2/spool/news/00
/dev/da2       7.3T    5.7T    990G    86%    /news2/spool/news/01
/dev/da3       3.7T    3.3T     65G    98%    /news2/spool/news/02
/dev/da4       5.5T    2.9T    2.2T    57%    /news2/spool/news/03
/dev/da8       7.3T    5.7T    989G    86%    /news2/spool/news/04
/dev/da9       7.3T    5.7T    988G    86%    /news2/spool/news/05
/dev/da10      7.3T    5.7T    991G    86%    /news2/spool/news/06
/dev/da11      5.5T      5T     63G    99%    /news2/spool/news/07
/dev/da12      5.5T    4.3T    778G    85%    /news2/spool/news/08
/dev/da13      7.3T    5.7T    991G    86%    /news2/spool/news/09
/dev/da14      7.3T    5.7T    990G    86%    /news2/spool/news/10
/dev/da15      7.3T    5.7T    991G    86%    /news2/spool/news/11
/dev/da16      7.3T    5.7T    985G    86%    /news2/spool/news/12
/dev/da17      7.3T    5.7T    989G    86%    /news2/spool/news/13
/dev/da18      7.3T    5.7T    990G    86%    /news2/spool/news/14
/dev/da19      7.3T    5.7T    986G    86%    /news2/spool/news/15
/dev/da20      7.3T    5.7T    998G    85%    /news2/spool/news/16
/dev/da21      7.3T    5.7T    989G    86%    /news2/spool/news/17
/dev/da22      7.3T    5.7T    991G    86%    /news2/spool/news/18
/dev/da23      7.3T    5.7T    992G    86%    /news2/spool/news/19
/dev/da24      7.3T    5.7T    988G    86%    /news2/spool/news/20
/dev/da25      7.3T    5.7T    988G    86%    /news2/spool/news/21
/dev/da26      7.3T    5.7T    989G    86%    /news2/spool/news/22
/dev/da5       221G     34G    169G    17%    /news1
/dev/md0        40G     13G     23G    36%    /news3
| Incoming Feed (+ Top1000 #) | Accepted | %Acc | %Tot | Art/sec | Volume | %Vol | KB/art | Check | Ihave | Spam | TooOld | Rejs | Errs | ||
|---|---|---|---|---|---|---|---|---|---|---|---|---|---|---|---|
| 1 | feeder.ecngs.de | 5316068 | 88.72 | 93.89 | 61.53 | 3.59TB | 99.93 | 725.97 | 5991665 | 0 | 0 | 0 | 165 | 0 | |
| 2 | feeder2.ecngs.de | 346175 | 50.39 | 6.11 | 4.01 | 2.69GB | 0.07 | 8.16 | 686794 | 0 | 0 | 0 | 134 | 0 | |
| Total | 5662243 | 0.00 | 100.00 | 65.54 | 3.60TB | 100.00 | 682.09 | 6678459 | 0 | 0 | 0 | 299 | 0 | ||
 |
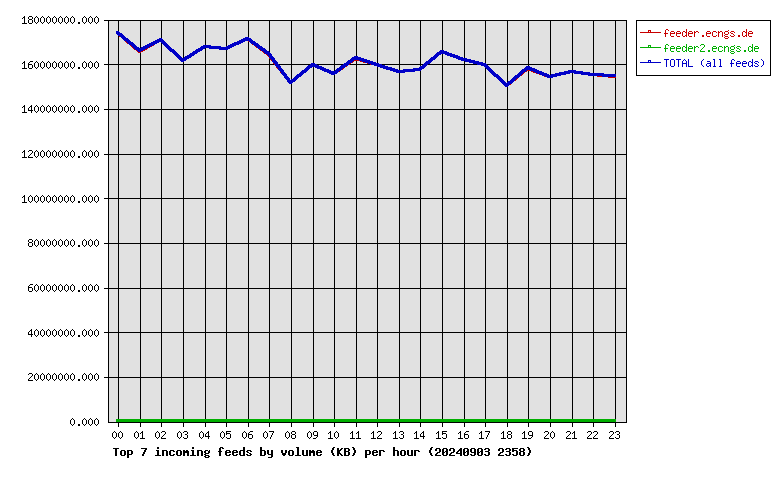
| Incoming Feed (+ Top1000 #) | Volume | %Vol | Kbps | Accepted | %Acc | %Tot | KB/art | Check | Ihave | Spam | TooOld | Rejs | Errs | ||
|---|---|---|---|---|---|---|---|---|---|---|---|---|---|---|---|
| 1 | feeder.ecngs.de | 3.59TB | 99.93 | 357345.29 | 5316068 | 88.72 | 93.89 | 725.97 | 5991665 | 0 | 0 | 0 | 165 | 0 | |
| 2 | feeder2.ecngs.de | 2.69GB | 0.07 | 261.49 | 346175 | 50.39 | 6.11 | 8.16 | 686794 | 0 | 0 | 0 | 134 | 0 | |
| Total | 3.60TB | 100.00 | 357606.78 | 5662243 | 0.00 | 100.00 | 682.09 | 6678459 | 0 | 0 | 0 | 299 | 0 | ||
 |
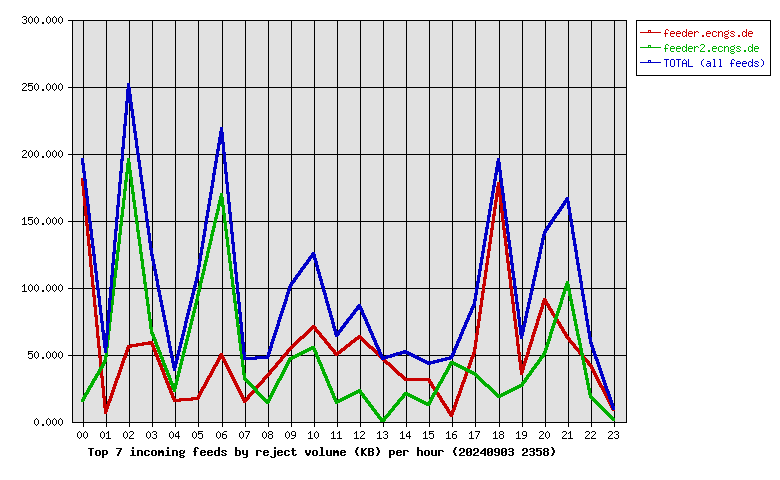
| Incoming Feed (+ Top1000 #) | Rej. Vol. | %Vol | Kbps | Accepted | %Acc | %Tot | KB/art | Check | Ihave | Spam | TooOld | Rejs | Errs | ||
|---|---|---|---|---|---|---|---|---|---|---|---|---|---|---|---|
| 1 | feeder.ecngs.de | 1.22MB | 52.68 | 0.12 | 5316068 | 88.72 | 93.89 | 725.97 | 5991665 | 0 | 0 | 0 | 165 | 0 | |
| 2 | feeder2.ecngs.de | 1.09MB | 47.32 | 0.10 | 346175 | 50.39 | 6.11 | 8.16 | 686794 | 0 | 0 | 0 | 134 | 0 | |
| Total | 2.31MB | 100.00 | 0.22 | 5662243 | 0.00 | 100.00 | 682.09 | 6678459 | 0 | 0 | 0 | 299 | 0 | ||
 |
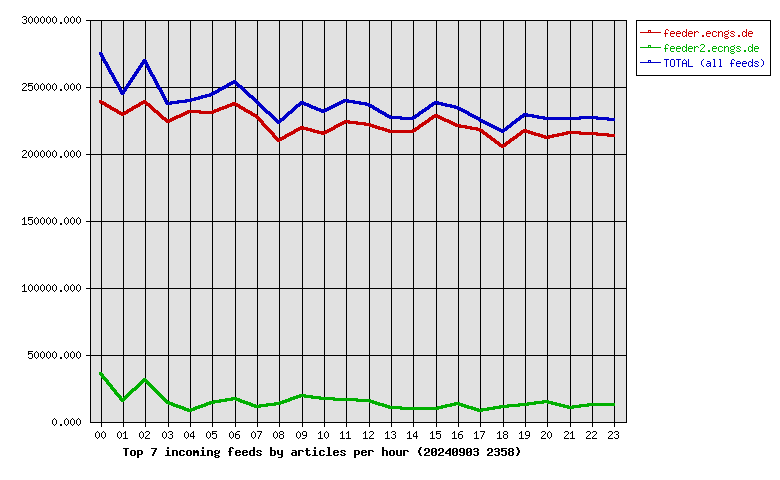
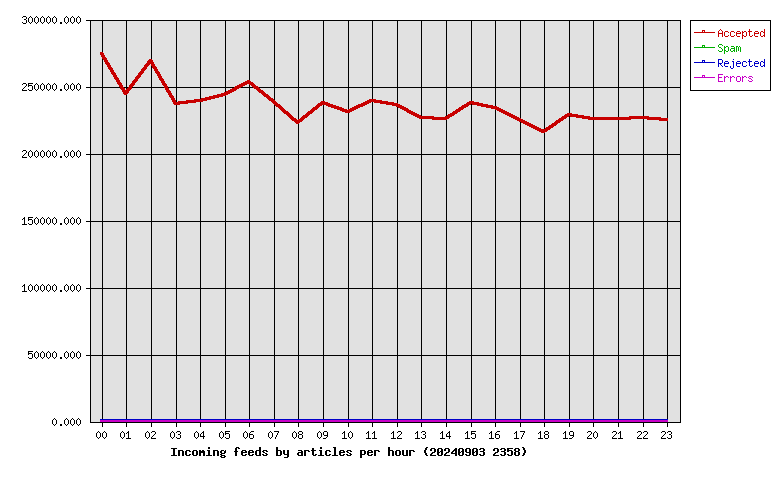
| Hour | Accepted | %Acc | Volume | %Vol | Check | Ihave | Spam | Rejs | Errs |
|---|---|---|---|---|---|---|---|---|---|
| 00 | 273883 | 4.84 | 165.99GB | 4.51 | 315976 | 0 | 0 | 38 | 0 |
| 01 | 244294 | 4.31 | 158.03GB | 4.29 | 264284 | 0 | 0 | 7 | 0 |
| 02 | 268770 | 4.75 | 163.11GB | 4.43 | 336668 | 0 | 0 | 28 | 0 |
| 03 | 236880 | 4.18 | 154.00GB | 4.18 | 318649 | 0 | 0 | 11 | 0 |
| 04 | 239093 | 4.22 | 160.02GB | 4.34 | 278675 | 0 | 0 | 9 | 0 |
| 05 | 243645 | 4.30 | 159.21GB | 4.32 | 293993 | 0 | 0 | 15 | 0 |
| 06 | 253342 | 4.47 | 163.41GB | 4.44 | 312867 | 0 | 0 | 17 | 0 |
| 07 | 238504 | 4.21 | 156.80GB | 4.26 | 293552 | 0 | 0 | 5 | 0 |
| 08 | 222422 | 3.93 | 144.63GB | 3.93 | 276729 | 0 | 0 | 6 | 0 |
| 09 | 237688 | 4.20 | 152.41GB | 4.14 | 300295 | 0 | 0 | 10 | 0 |
| 10 | 231271 | 4.08 | 148.51GB | 4.03 | 292741 | 0 | 0 | 16 | 0 |
| 11 | 239084 | 4.22 | 155.03GB | 4.21 | 291935 | 0 | 0 | 9 | 0 |
| 12 | 236094 | 4.17 | 152.40GB | 4.14 | 293157 | 0 | 0 | 12 | 0 |
| 13 | 226240 | 4.00 | 149.14GB | 4.05 | 272563 | 0 | 0 | 6 | 0 |
| 14 | 225510 | 3.98 | 150.23GB | 4.08 | 263498 | 0 | 0 | 4 | 0 |
| 15 | 237841 | 4.20 | 157.93GB | 4.29 | 294153 | 0 | 0 | 9 | 0 |
| 16 | 233773 | 4.13 | 154.25GB | 4.19 | 299477 | 0 | 0 | 10 | 0 |
| 17 | 225195 | 3.98 | 152.39GB | 4.14 | 245276 | 0 | 0 | 8 | 0 |
| 18 | 216207 | 3.82 | 143.25GB | 3.89 | 228721 | 0 | 0 | 16 | 0 |
| 19 | 229068 | 4.05 | 150.80GB | 4.09 | 242267 | 0 | 0 | 10 | 0 |
| 20 | 226045 | 3.99 | 147.12GB | 3.99 | 242610 | 0 | 0 | 22 | 0 |
| 21 | 225691 | 3.99 | 149.17GB | 4.05 | 237426 | 0 | 0 | 16 | 0 |
| 22 | 226685 | 4.00 | 148.01GB | 4.02 | 241645 | 0 | 0 | 12 | 0 |
| 23 | 225018 | 3.97 | 147.39GB | 4.00 | 241302 | 0 | 0 | 3 | 0 |
| Total | 5662243 | 100.00 | 3.60TB | 100.00 | 6678459 | 0 | 0 | 299 | 0 |
 |
| Outgoing Feed (+ Top1000 #) | Accepted | %Acc | %Tot | Art/sec | Volume | %Vol | KB/art | Dups | Rejs | % Ratio (Out/In) | ||
|---|---|---|---|---|---|---|---|---|---|---|---|---|
| 1 | 217.73.144.40 | 0 | 0.00 | 0.00 | 0.00 | 0.00KB | 0.00 | 0.00 | 5882929 | 0 | … | |
| Total | 0 | 0.00 | 0.00 | 0.00 | 0.00KB | 0.00 | 0.00 | 5882929 | 0 | |||
 |
| Outgoing Feed (+ Top1000 #) | Volume | %Vol | Kbps | Accepted | %Acc | %Tot | KB/art | Dups | Rejs | % Ratio (Out/In) | ||
|---|---|---|---|---|---|---|---|---|---|---|---|---|
| 1 | 217.73.144.40 | 0.00KB | 0.00 | 0.00 | 0 | 0.00 | 0.00 | 0.00 | 5882929 | 0 | … | |
| Total | 0.00KB | 0.00 | 0.00 | 0 | 0.00 | 0.00 | 0.00 | 5882929 | 0 | |||
 |
| Outgoing Feed (+ Top1000 #) | Rej. Vol. | %Vol | Kbps | Accepted | %Acc | %Tot | KB/art | Dups | Rejs | % Ratio (Out/In) | ||
|---|---|---|---|---|---|---|---|---|---|---|---|---|
| 1 | 217.73.144.40 | 0.00KB | 0.00 | 0.00 | 0 | 0.00 | 0.00 | 0.00 | 5882929 | 0 | … | |
| Total | 0.00KB | 0.00 | 0.00 | 0 | 0.00 | 0.00 | 0.00 | 5882929 | 0 | |||
 |
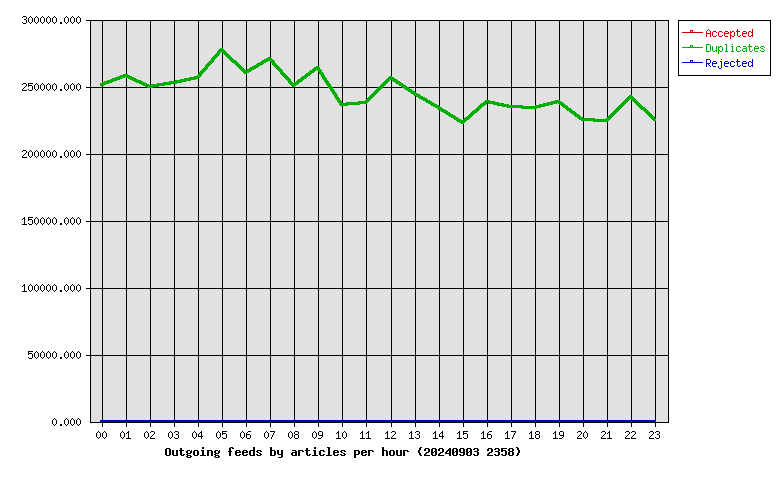
| Hour | Accepted | %Acc | Volume | %Vol | dups | Rejs |
|---|---|---|---|---|---|---|
| 00 | 0 | 0.00 | 0.00KB | 0.00 | 251119 | 0 |
| 01 | 0 | 0.00 | 0.00KB | 0.00 | 257751 | 0 |
| 02 | 0 | 0.00 | 0.00KB | 0.00 | 249558 | 0 |
| 03 | 0 | 0.00 | 0.00KB | 0.00 | 252385 | 0 |
| 04 | 0 | 0.00 | 0.00KB | 0.00 | 256085 | 0 |
| 05 | 0 | 0.00 | 0.00KB | 0.00 | 277557 | 0 |
| 06 | 0 | 0.00 | 0.00KB | 0.00 | 260236 | 0 |
| 07 | 0 | 0.00 | 0.00KB | 0.00 | 270673 | 0 |
| 08 | 0 | 0.00 | 0.00KB | 0.00 | 250684 | 0 |
| 09 | 0 | 0.00 | 0.00KB | 0.00 | 263897 | 0 |
| 10 | 0 | 0.00 | 0.00KB | 0.00 | 236389 | 0 |
| 11 | 0 | 0.00 | 0.00KB | 0.00 | 237702 | 0 |
| 12 | 0 | 0.00 | 0.00KB | 0.00 | 256415 | 0 |
| 13 | 0 | 0.00 | 0.00KB | 0.00 | 244223 | 0 |
| 14 | 0 | 0.00 | 0.00KB | 0.00 | 233775 | 0 |
| 15 | 0 | 0.00 | 0.00KB | 0.00 | 222484 | 0 |
| 16 | 0 | 0.00 | 0.00KB | 0.00 | 238591 | 0 |
| 17 | 0 | 0.00 | 0.00KB | 0.00 | 234851 | 0 |
| 18 | 0 | 0.00 | 0.00KB | 0.00 | 233856 | 0 |
| 19 | 0 | 0.00 | 0.00KB | 0.00 | 238221 | 0 |
| 20 | 0 | 0.00 | 0.00KB | 0.00 | 225148 | 0 |
| 21 | 0 | 0.00 | 0.00KB | 0.00 | 224397 | 0 |
| 22 | 0 | 0.00 | 0.00KB | 0.00 | 242051 | 0 |
| 23 | 0 | 0.00 | 0.00KB | 0.00 | 224881 | 0 |
| Total | 0 | 0.00 | 0.00KB | 0.00 | 5882929 | 0 |
 |
| >= 20% Full | >= 35% Full | >= 50% Full | >= 65% Full | >= 80% Full | >= 95% Full |
| Outgoing Feed | Batch Seq | Batch Num | Batch Max | %Full | Av. Pending |
|---|---|---|---|---|---|
| nbr.elbracht.net-o | 983743-983824 | 81 | 500 | 16 | 0.0 |
| text-spool-out | 0-0 | 0 | 500 | 0 | 0.0 |
| 1st Time | Last Time | # Msgs | Message |
|---|---|---|---|
| 18:27:56 | 1 | DNS Fwd/Rev mismatch: lookup of scanner-27.ch1.censys-scanner.com failed |