| |
DIABLO statistics for newsfeed.yoursite.com on Mon 02 Sep 2024 |
Generated on 20240902 2358 by feeder-stats v4.006. Copyright © 2002 The Diablo Project.
Diablo running processes:  81    Dnewslink running processes:  0


11:59PM  up 197 days,  7:18, 0 users, load averages: 1.34, 0.77, 0.66

Filesystem     Size    Used   Avail Capacity  Mounted on
/dev/da0s1g     94G    1.2G     85G     1%    /news
/dev/da1       7.3T    5.7T    995G    85%    /news2/spool/news/00
/dev/da2       7.3T    5.7T    994G    85%    /news2/spool/news/01
/dev/da3       3.7T    3.3T     68G    98%    /news2/spool/news/02
/dev/da4       5.5T    2.9T    2.2T    57%    /news2/spool/news/03
/dev/da8       7.3T    5.7T    994G    85%    /news2/spool/news/04
/dev/da9       7.3T    5.7T    993G    85%    /news2/spool/news/05
/dev/da10      7.3T    5.7T    996G    85%    /news2/spool/news/06
/dev/da11      5.5T      5T     67G    99%    /news2/spool/news/07
/dev/da12      5.5T    4.3T    782G    85%    /news2/spool/news/08
/dev/da13      7.3T    5.7T    996G    85%    /news2/spool/news/09
/dev/da14      7.3T    5.7T    995G    85%    /news2/spool/news/10
/dev/da15      7.3T    5.7T    996G    85%    /news2/spool/news/11
/dev/da16      7.3T    5.7T    991G    86%    /news2/spool/news/12
/dev/da17      7.3T    5.7T    995G    85%    /news2/spool/news/13
/dev/da18      7.3T    5.7T    995G    85%    /news2/spool/news/14
/dev/da19      7.3T    5.7T    992G    86%    /news2/spool/news/15
/dev/da20      7.3T    5.7T    996G    85%    /news2/spool/news/16
/dev/da21      7.3T    5.7T    995G    85%    /news2/spool/news/17
/dev/da22      7.3T    5.7T    996G    85%    /news2/spool/news/18
/dev/da23      7.3T    5.7T      1T    85%    /news2/spool/news/19
/dev/da24      7.3T    5.7T    993G    85%    /news2/spool/news/20
/dev/da25      7.3T    5.7T    994G    85%    /news2/spool/news/21
/dev/da26      7.3T    5.7T    994G    85%    /news2/spool/news/22
/dev/da5       221G     34G    169G    17%    /news1
/dev/md0        40G     13G     23G    36%    /news3
| Incoming Feed (+ Top1000 #) | Accepted | %Acc | %Tot | Art/sec | Volume | %Vol | KB/art | Check | Ihave | Spam | TooOld | Rejs | Errs | ||
|---|---|---|---|---|---|---|---|---|---|---|---|---|---|---|---|
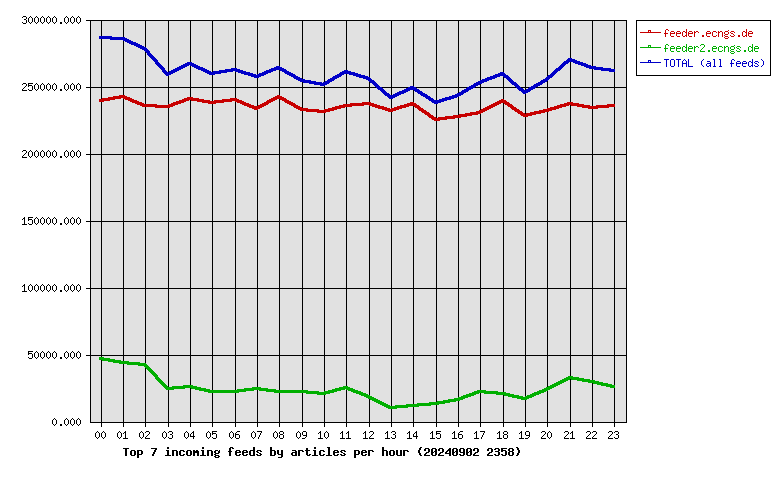
| 1 | feeder.ecngs.de | 5637179 | 90.08 | 90.68 | 65.25 | 3.78TB | 99.92 | 720.43 | 6257649 | 0 | 0 | 0 | 366 | 0 | |
| 2 | feeder2.ecngs.de | 579077 | 89.68 | 9.32 | 6.75 | 2.97GB | 0.08 | 5.38 | 645312 | 0 | 0 | 0 | 389 | 0 | |
| Total | 6216256 | 0.00 | 100.00 | 72.00 | 3.79TB | 100.00 | 653.82 | 6902961 | 0 | 0 | 0 | 755 | 0 | ||
 |
| Incoming Feed (+ Top1000 #) | Volume | %Vol | Kbps | Accepted | %Acc | %Tot | KB/art | Check | Ihave | Spam | TooOld | Rejs | Errs | ||
|---|---|---|---|---|---|---|---|---|---|---|---|---|---|---|---|
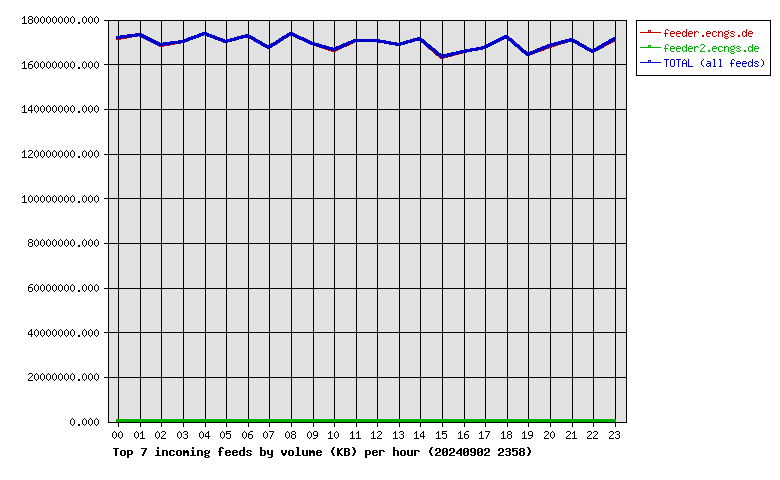
| 1 | feeder.ecngs.de | 3.78TB | 99.92 | 376038.57 | 5637179 | 90.08 | 90.68 | 720.43 | 6257649 | 0 | 0 | 0 | 366 | 0 | |
| 2 | feeder2.ecngs.de | 2.97GB | 0.08 | 290.43 | 579077 | 89.68 | 9.32 | 5.38 | 645312 | 0 | 0 | 0 | 389 | 0 | |
| Total | 3.79TB | 100.00 | 376329.00 | 6216256 | 0.00 | 100.00 | 653.82 | 6902961 | 0 | 0 | 0 | 755 | 0 | ||
 |
| Incoming Feed (+ Top1000 #) | Rej. Vol. | %Vol | Kbps | Accepted | %Acc | %Tot | KB/art | Check | Ihave | Spam | TooOld | Rejs | Errs | ||
|---|---|---|---|---|---|---|---|---|---|---|---|---|---|---|---|
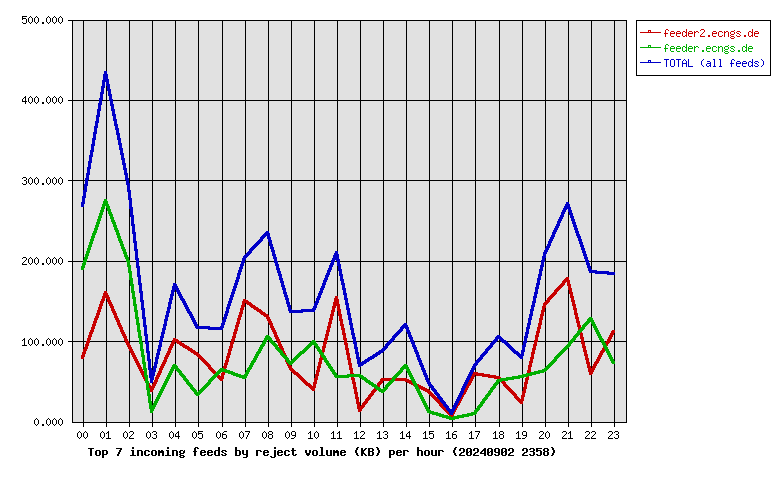
| 1 | feeder2.ecngs.de | 1.89MB | 50.82 | 0.18 | 579077 | 89.68 | 9.32 | 5.38 | 645312 | 0 | 0 | 0 | 389 | 0 | |
| 2 | feeder.ecngs.de | 1.82MB | 49.18 | 0.17 | 5637179 | 90.08 | 90.68 | 720.43 | 6257649 | 0 | 0 | 0 | 366 | 0 | |
| Total | 3.71MB | 100.00 | 0.35 | 6216256 | 0.00 | 100.00 | 653.82 | 6902961 | 0 | 0 | 0 | 755 | 0 | ||
 |
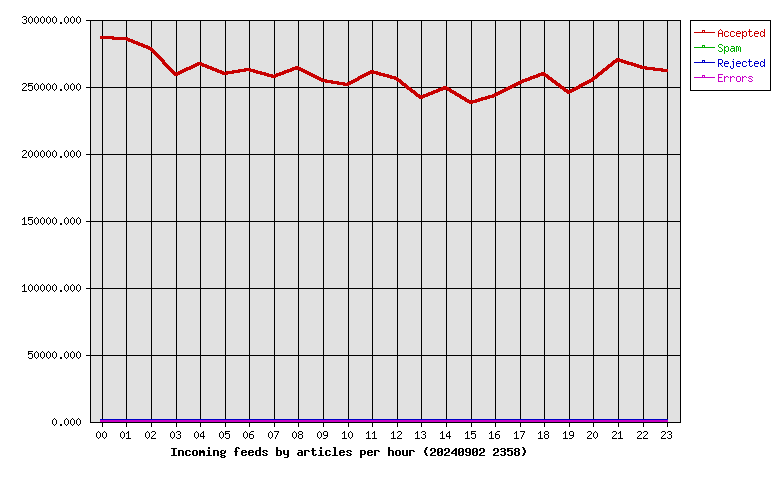
| Hour | Accepted | %Acc | Volume | %Vol | Check | Ihave | Spam | Rejs | Errs |
|---|---|---|---|---|---|---|---|---|---|
| 00 | 285876 | 4.60 | 163.72GB | 4.22 | 341506 | 0 | 0 | 76 | 0 |
| 01 | 285671 | 4.60 | 165.02GB | 4.26 | 338985 | 0 | 0 | 97 | 0 |
| 02 | 277929 | 4.47 | 160.65GB | 4.14 | 330261 | 0 | 0 | 59 | 0 |
| 03 | 258696 | 4.16 | 162.25GB | 4.19 | 286765 | 0 | 0 | 17 | 0 |
| 04 | 266844 | 4.29 | 165.40GB | 4.27 | 295524 | 0 | 0 | 33 | 0 |
| 05 | 259108 | 4.17 | 161.99GB | 4.18 | 287524 | 0 | 0 | 36 | 0 |
| 06 | 262173 | 4.22 | 164.73GB | 4.25 | 288258 | 0 | 0 | 21 | 0 |
| 07 | 257087 | 4.14 | 159.57GB | 4.12 | 283967 | 0 | 0 | 37 | 0 |
| 08 | 264040 | 4.25 | 165.55GB | 4.27 | 291580 | 0 | 0 | 34 | 0 |
| 09 | 254091 | 4.09 | 161.24GB | 4.16 | 279047 | 0 | 0 | 20 | 0 |
| 10 | 251187 | 4.04 | 158.48GB | 4.09 | 275464 | 0 | 0 | 33 | 0 |
| 11 | 260747 | 4.19 | 162.45GB | 4.19 | 288760 | 0 | 0 | 29 | 0 |
| 12 | 255408 | 4.11 | 162.65GB | 4.20 | 277934 | 0 | 0 | 19 | 0 |
| 13 | 241721 | 3.89 | 160.64GB | 4.14 | 253460 | 0 | 0 | 15 | 0 |
| 14 | 248756 | 4.00 | 163.34GB | 4.21 | 263765 | 0 | 0 | 18 | 0 |
| 15 | 237993 | 3.83 | 155.50GB | 4.01 | 252843 | 0 | 0 | 8 | 0 |
| 16 | 242602 | 3.90 | 157.91GB | 4.07 | 259392 | 0 | 0 | 3 | 0 |
| 17 | 252456 | 4.06 | 159.69GB | 4.12 | 278262 | 0 | 0 | 13 | 0 |
| 18 | 259612 | 4.18 | 164.27GB | 4.24 | 282482 | 0 | 0 | 9 | 0 |
| 19 | 244796 | 3.94 | 156.67GB | 4.04 | 265429 | 0 | 0 | 18 | 0 |
| 20 | 254994 | 4.10 | 160.18GB | 4.13 | 281180 | 0 | 0 | 47 | 0 |
| 21 | 269545 | 4.34 | 162.96GB | 4.20 | 308313 | 0 | 0 | 43 | 0 |
| 22 | 263651 | 4.24 | 157.93GB | 4.07 | 301034 | 0 | 0 | 38 | 0 |
| 23 | 261273 | 4.20 | 163.25GB | 4.21 | 291226 | 0 | 0 | 32 | 0 |
| Total | 6216256 | 100.00 | 3.79TB | 100.00 | 6902961 | 0 | 0 | 755 | 0 |
 |
| Outgoing Feed (+ Top1000 #) | Accepted | %Acc | %Tot | Art/sec | Volume | %Vol | KB/art | Dups | Rejs | % Ratio (Out/In) | ||
|---|---|---|---|---|---|---|---|---|---|---|---|---|
| 1 | 217.73.144.40 | 0 | 0.00 | 0.00 | 0.00 | 0.00KB | 0.00 | 0.00 | 6498680 | 0 | … | |
| Total | 0 | 0.00 | 0.00 | 0.00 | 0.00KB | 0.00 | 0.00 | 6498680 | 0 | |||
 |
| Outgoing Feed (+ Top1000 #) | Volume | %Vol | Kbps | Accepted | %Acc | %Tot | KB/art | Dups | Rejs | % Ratio (Out/In) | ||
|---|---|---|---|---|---|---|---|---|---|---|---|---|
| 1 | 217.73.144.40 | 0.00KB | 0.00 | 0.00 | 0 | 0.00 | 0.00 | 0.00 | 6498680 | 0 | … | |
| Total | 0.00KB | 0.00 | 0.00 | 0 | 0.00 | 0.00 | 0.00 | 6498680 | 0 | |||
 |
| Outgoing Feed (+ Top1000 #) | Rej. Vol. | %Vol | Kbps | Accepted | %Acc | %Tot | KB/art | Dups | Rejs | % Ratio (Out/In) | ||
|---|---|---|---|---|---|---|---|---|---|---|---|---|
| 1 | 217.73.144.40 | 0.00KB | 0.00 | 0.00 | 0 | 0.00 | 0.00 | 0.00 | 6498680 | 0 | … | |
| Total | 0.00KB | 0.00 | 0.00 | 0 | 0.00 | 0.00 | 0.00 | 6498680 | 0 | |||
 |
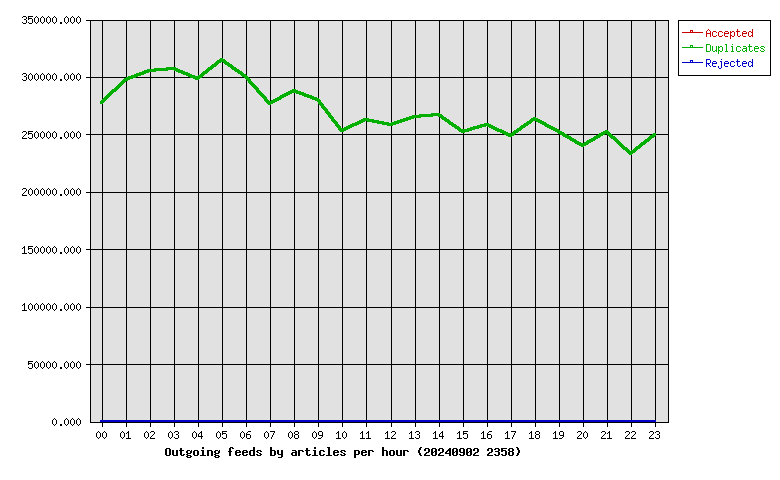
| Hour | Accepted | %Acc | Volume | %Vol | dups | Rejs |
|---|---|---|---|---|---|---|
| 00 | 0 | 0.00 | 0.00KB | 0.00 | 277715 | 0 |
| 01 | 0 | 0.00 | 0.00KB | 0.00 | 297725 | 0 |
| 02 | 0 | 0.00 | 0.00KB | 0.00 | 305437 | 0 |
| 03 | 0 | 0.00 | 0.00KB | 0.00 | 306520 | 0 |
| 04 | 0 | 0.00 | 0.00KB | 0.00 | 297969 | 0 |
| 05 | 0 | 0.00 | 0.00KB | 0.00 | 314476 | 0 |
| 06 | 0 | 0.00 | 0.00KB | 0.00 | 299793 | 0 |
| 07 | 0 | 0.00 | 0.00KB | 0.00 | 276133 | 0 |
| 08 | 0 | 0.00 | 0.00KB | 0.00 | 287770 | 0 |
| 09 | 0 | 0.00 | 0.00KB | 0.00 | 279790 | 0 |
| 10 | 0 | 0.00 | 0.00KB | 0.00 | 253202 | 0 |
| 11 | 0 | 0.00 | 0.00KB | 0.00 | 262601 | 0 |
| 12 | 0 | 0.00 | 0.00KB | 0.00 | 258569 | 0 |
| 13 | 0 | 0.00 | 0.00KB | 0.00 | 265071 | 0 |
| 14 | 0 | 0.00 | 0.00KB | 0.00 | 266821 | 0 |
| 15 | 0 | 0.00 | 0.00KB | 0.00 | 252126 | 0 |
| 16 | 0 | 0.00 | 0.00KB | 0.00 | 258318 | 0 |
| 17 | 0 | 0.00 | 0.00KB | 0.00 | 248653 | 0 |
| 18 | 0 | 0.00 | 0.00KB | 0.00 | 263766 | 0 |
| 19 | 0 | 0.00 | 0.00KB | 0.00 | 252306 | 0 |
| 20 | 0 | 0.00 | 0.00KB | 0.00 | 239744 | 0 |
| 21 | 0 | 0.00 | 0.00KB | 0.00 | 251869 | 0 |
| 22 | 0 | 0.00 | 0.00KB | 0.00 | 232768 | 0 |
| 23 | 0 | 0.00 | 0.00KB | 0.00 | 249538 | 0 |
| Total | 0 | 0.00 | 0.00KB | 0.00 | 6498680 | 0 |
 |
| >= 20% Full | >= 35% Full | >= 50% Full | >= 65% Full | >= 80% Full | >= 95% Full |
| Outgoing Feed | Batch Seq | Batch Num | Batch Max | %Full | Av. Pending |
|---|---|---|---|---|---|
| nbr.elbracht.net-o | 983455-983536 | 81 | 500 | 16 | 0.0 |
| text-spool-out | 0-0 | 0 | 500 | 0 | 0.0 |
| 1st Time | Last Time | # Msgs | Message |
|---|