| |
DIABLO statistics for newsfeed.yoursite.com on Sun 01 Sep 2024 |
Generated on 20240901 2358 by feeder-stats v4.006. Copyright © 2002 The Diablo Project.
Diablo running processes:  81    Dnewslink running processes:  0


11:59PM  up 196 days,  7:18, 0 users, load averages: 1.75, 0.86, 0.66

Filesystem     Size    Used   Avail Capacity  Mounted on
/dev/da0s1g     94G    1.2G     85G     1%    /news
/dev/da1       7.3T    5.7T      1T    85%    /news2/spool/news/00
/dev/da2       7.3T    5.7T      1T    85%    /news2/spool/news/01
/dev/da3       3.7T    3.3T     68G    98%    /news2/spool/news/02
/dev/da4       5.5T    2.9T    2.2T    57%    /news2/spool/news/03
/dev/da8       7.3T    5.7T      1T    85%    /news2/spool/news/04
/dev/da9       7.3T    5.7T      1T    85%    /news2/spool/news/05
/dev/da10      7.3T    5.7T      1T    85%    /news2/spool/news/06
/dev/da11      5.5T      5T     62G    99%    /news2/spool/news/07
/dev/da12      5.5T    4.3T    789G    85%    /news2/spool/news/08
/dev/da13      7.3T    5.7T      1T    85%    /news2/spool/news/09
/dev/da14      7.3T    5.7T      1T    85%    /news2/spool/news/10
/dev/da15      7.3T    5.7T      1T    85%    /news2/spool/news/11
/dev/da16      7.3T    5.7T      1T    85%    /news2/spool/news/12
/dev/da17      7.3T    5.7T      1T    85%    /news2/spool/news/13
/dev/da18      7.3T    5.7T      1T    85%    /news2/spool/news/14
/dev/da19      7.3T    5.7T      1T    85%    /news2/spool/news/15
/dev/da20      7.3T    5.7T      1T    85%    /news2/spool/news/16
/dev/da21      7.3T    5.7T      1T    85%    /news2/spool/news/17
/dev/da22      7.3T    5.7T      1T    85%    /news2/spool/news/18
/dev/da23      7.3T    5.7T      1T    85%    /news2/spool/news/19
/dev/da24      7.3T    5.7T      1T    85%    /news2/spool/news/20
/dev/da25      7.3T    5.7T      1T    85%    /news2/spool/news/21
/dev/da26      7.3T    5.7T      1T    85%    /news2/spool/news/22
/dev/da5       221G     34G    169G    17%    /news1
/dev/md0        40G     13G     23G    36%    /news3
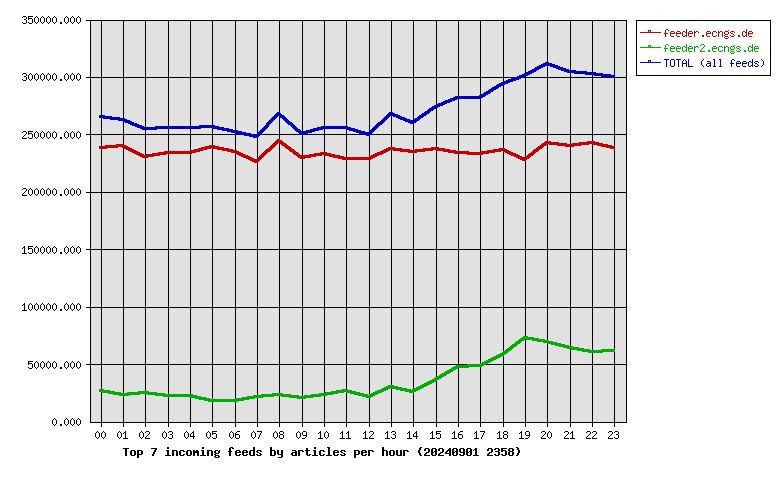
| Incoming Feed (+ Top1000 #) | Accepted | %Acc | %Tot | Art/sec | Volume | %Vol | KB/art | Check | Ihave | Spam | TooOld | Rejs | Errs | ||
|---|---|---|---|---|---|---|---|---|---|---|---|---|---|---|---|
| 1 | feeder.ecngs.de | 5642696 | 85.60 | 86.74 | 65.31 | 3.78TB | 99.88 | 718.87 | 6591032 | 0 | 0 | 0 | 645 | 0 | |
| 2 | feeder2.ecngs.de | 862940 | 87.65 | 13.26 | 9.99 | 4.57GB | 0.12 | 5.55 | 983849 | 0 | 0 | 0 | 693 | 0 | |
| Total | 6505636 | 0.00 | 100.00 | 75.30 | 3.78TB | 100.00 | 624.25 | 7574881 | 0 | 0 | 0 | 1338 | 0 | ||
 |
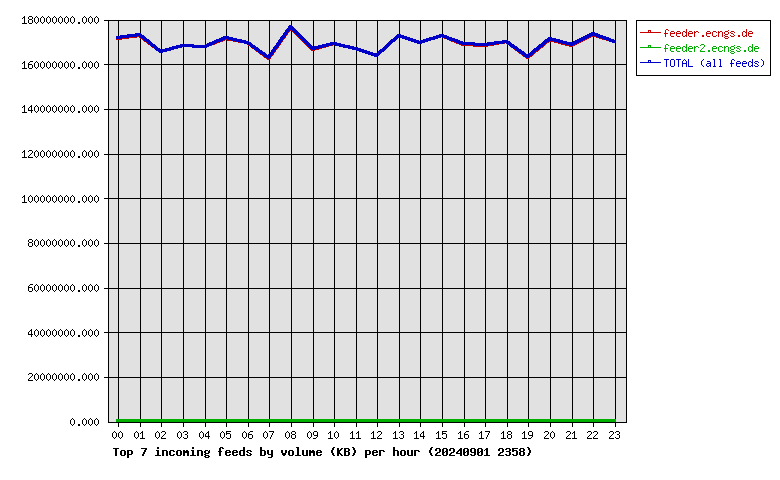
| Incoming Feed (+ Top1000 #) | Volume | %Vol | Kbps | Accepted | %Acc | %Tot | KB/art | Check | Ihave | Spam | TooOld | Rejs | Errs | ||
|---|---|---|---|---|---|---|---|---|---|---|---|---|---|---|---|
| 1 | feeder.ecngs.de | 3.78TB | 99.88 | 375590.51 | 5642696 | 85.60 | 86.74 | 718.87 | 6591032 | 0 | 0 | 0 | 645 | 0 | |
| 2 | feeder2.ecngs.de | 4.57GB | 0.12 | 443.65 | 862940 | 87.65 | 13.26 | 5.55 | 983849 | 0 | 0 | 0 | 693 | 0 | |
| Total | 3.78TB | 100.00 | 376034.16 | 6505636 | 0.00 | 100.00 | 624.25 | 7574881 | 0 | 0 | 0 | 1338 | 0 | ||
 |
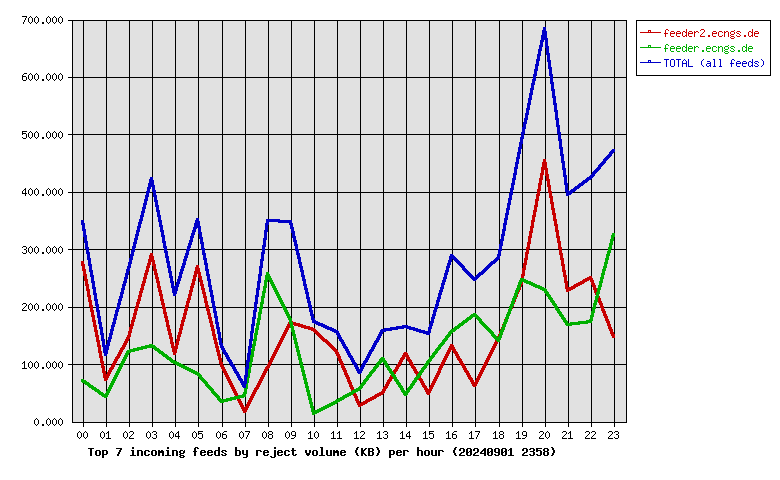
| Incoming Feed (+ Top1000 #) | Rej. Vol. | %Vol | Kbps | Accepted | %Acc | %Tot | KB/art | Check | Ihave | Spam | TooOld | Rejs | Errs | ||
|---|---|---|---|---|---|---|---|---|---|---|---|---|---|---|---|
| 1 | feeder2.ecngs.de | 3.65MB | 55.07 | 0.35 | 862940 | 87.65 | 13.26 | 5.55 | 983849 | 0 | 0 | 0 | 693 | 0 | |
| 2 | feeder.ecngs.de | 2.97MB | 44.93 | 0.28 | 5642696 | 85.60 | 86.74 | 718.87 | 6591032 | 0 | 0 | 0 | 645 | 0 | |
| Total | 6.62MB | 100.00 | 0.63 | 6505636 | 0.00 | 100.00 | 624.25 | 7574881 | 0 | 0 | 0 | 1338 | 0 | ||
 |
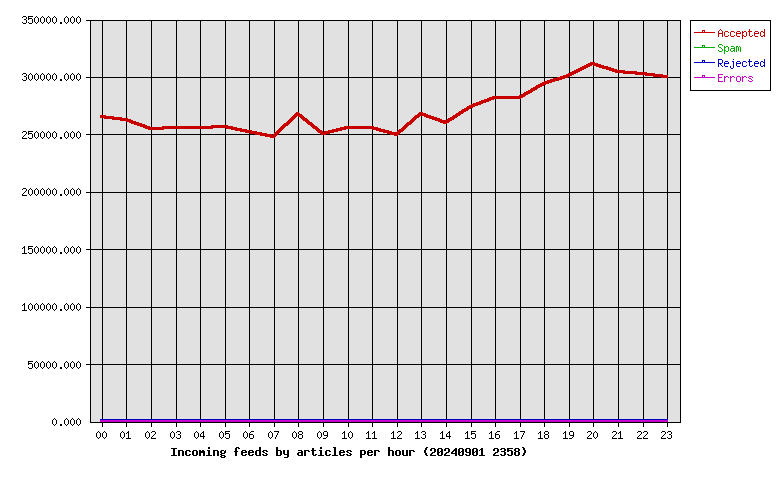
| Hour | Accepted | %Acc | Volume | %Vol | Check | Ihave | Spam | Rejs | Errs |
|---|---|---|---|---|---|---|---|---|---|
| 00 | 265486 | 4.08 | 163.68GB | 4.23 | 299345 | 0 | 0 | 40 | 0 |
| 01 | 262242 | 4.03 | 164.85GB | 4.26 | 291479 | 0 | 0 | 14 | 0 |
| 02 | 254530 | 3.91 | 157.86GB | 4.08 | 286637 | 0 | 0 | 37 | 0 |
| 03 | 255907 | 3.93 | 160.39GB | 4.14 | 285195 | 0 | 0 | 43 | 0 |
| 04 | 255468 | 3.93 | 159.89GB | 4.13 | 283972 | 0 | 0 | 38 | 0 |
| 05 | 256793 | 3.95 | 163.63GB | 4.22 | 285356 | 0 | 0 | 29 | 0 |
| 06 | 252307 | 3.88 | 161.58GB | 4.17 | 274920 | 0 | 0 | 16 | 0 |
| 07 | 247483 | 3.80 | 155.14GB | 4.01 | 275141 | 0 | 0 | 11 | 0 |
| 08 | 267874 | 4.12 | 168.41GB | 4.35 | 299575 | 0 | 0 | 47 | 0 |
| 09 | 249943 | 3.84 | 158.99GB | 4.10 | 277787 | 0 | 0 | 36 | 0 |
| 10 | 255798 | 3.93 | 161.34GB | 4.17 | 293039 | 0 | 0 | 25 | 0 |
| 11 | 255734 | 3.93 | 159.15GB | 4.11 | 286594 | 0 | 0 | 20 | 0 |
| 12 | 249255 | 3.83 | 156.29GB | 4.04 | 276175 | 0 | 0 | 25 | 0 |
| 13 | 267968 | 4.12 | 164.67GB | 4.25 | 301682 | 0 | 0 | 29 | 0 |
| 14 | 260053 | 4.00 | 161.67GB | 4.17 | 291602 | 0 | 0 | 18 | 0 |
| 15 | 273847 | 4.21 | 164.62GB | 4.25 | 315952 | 0 | 0 | 45 | 0 |
| 16 | 281444 | 4.33 | 161.14GB | 4.16 | 334970 | 0 | 0 | 74 | 0 |
| 17 | 281270 | 4.32 | 160.74GB | 4.15 | 339086 | 0 | 0 | 71 | 0 |
| 18 | 293636 | 4.51 | 162.21GB | 4.19 | 365231 | 0 | 0 | 62 | 0 |
| 19 | 300500 | 4.62 | 155.58GB | 4.02 | 376787 | 0 | 0 | 129 | 0 |
| 20 | 311570 | 4.79 | 163.27GB | 4.22 | 403887 | 0 | 0 | 187 | 0 |
| 21 | 303931 | 4.67 | 160.60GB | 4.15 | 386019 | 0 | 0 | 112 | 0 |
| 22 | 302830 | 4.65 | 165.27GB | 4.27 | 373446 | 0 | 0 | 97 | 0 |
| 23 | 299767 | 4.61 | 162.08GB | 4.18 | 371004 | 0 | 0 | 133 | 0 |
| Total | 6505636 | 100.00 | 3.78TB | 100.00 | 7574881 | 0 | 0 | 1338 | 0 |
 |
| Outgoing Feed (+ Top1000 #) | Accepted | %Acc | %Tot | Art/sec | Volume | %Vol | KB/art | Dups | Rejs | % Ratio (Out/In) | ||
|---|---|---|---|---|---|---|---|---|---|---|---|---|
| 1 | 217.73.144.40 | 0 | 0.00 | 0.00 | 0.00 | 0.00KB | 0.00 | 0.00 | 6201345 | 0 | … | |
| Total | 0 | 0.00 | 0.00 | 0.00 | 0.00KB | 0.00 | 0.00 | 6201345 | 0 | |||
 |
| Outgoing Feed (+ Top1000 #) | Volume | %Vol | Kbps | Accepted | %Acc | %Tot | KB/art | Dups | Rejs | % Ratio (Out/In) | ||
|---|---|---|---|---|---|---|---|---|---|---|---|---|
| 1 | 217.73.144.40 | 0.00KB | 0.00 | 0.00 | 0 | 0.00 | 0.00 | 0.00 | 6201345 | 0 | … | |
| Total | 0.00KB | 0.00 | 0.00 | 0 | 0.00 | 0.00 | 0.00 | 6201345 | 0 | |||
 |
| Outgoing Feed (+ Top1000 #) | Rej. Vol. | %Vol | Kbps | Accepted | %Acc | %Tot | KB/art | Dups | Rejs | % Ratio (Out/In) | ||
|---|---|---|---|---|---|---|---|---|---|---|---|---|
| 1 | 217.73.144.40 | 0.00KB | 0.00 | 0.00 | 0 | 0.00 | 0.00 | 0.00 | 6201345 | 0 | … | |
| Total | 0.00KB | 0.00 | 0.00 | 0 | 0.00 | 0.00 | 0.00 | 6201345 | 0 | |||
 |
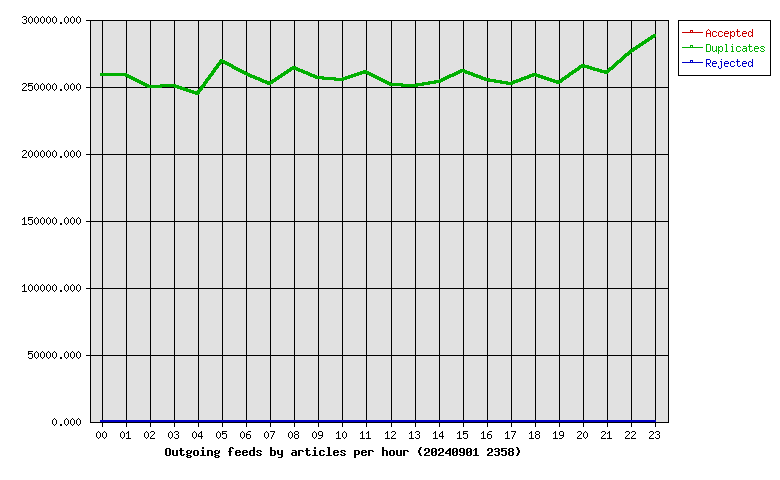
| Hour | Accepted | %Acc | Volume | %Vol | dups | Rejs |
|---|---|---|---|---|---|---|
| 00 | 0 | 0.00 | 0.00KB | 0.00 | 258506 | 0 |
| 01 | 0 | 0.00 | 0.00KB | 0.00 | 258774 | 0 |
| 02 | 0 | 0.00 | 0.00KB | 0.00 | 249722 | 0 |
| 03 | 0 | 0.00 | 0.00KB | 0.00 | 250612 | 0 |
| 04 | 0 | 0.00 | 0.00KB | 0.00 | 244058 | 0 |
| 05 | 0 | 0.00 | 0.00KB | 0.00 | 269159 | 0 |
| 06 | 0 | 0.00 | 0.00KB | 0.00 | 259547 | 0 |
| 07 | 0 | 0.00 | 0.00KB | 0.00 | 251963 | 0 |
| 08 | 0 | 0.00 | 0.00KB | 0.00 | 264047 | 0 |
| 09 | 0 | 0.00 | 0.00KB | 0.00 | 256006 | 0 |
| 10 | 0 | 0.00 | 0.00KB | 0.00 | 255117 | 0 |
| 11 | 0 | 0.00 | 0.00KB | 0.00 | 260910 | 0 |
| 12 | 0 | 0.00 | 0.00KB | 0.00 | 251171 | 0 |
| 13 | 0 | 0.00 | 0.00KB | 0.00 | 250364 | 0 |
| 14 | 0 | 0.00 | 0.00KB | 0.00 | 253128 | 0 |
| 15 | 0 | 0.00 | 0.00KB | 0.00 | 261483 | 0 |
| 16 | 0 | 0.00 | 0.00KB | 0.00 | 255089 | 0 |
| 17 | 0 | 0.00 | 0.00KB | 0.00 | 252020 | 0 |
| 18 | 0 | 0.00 | 0.00KB | 0.00 | 258638 | 0 |
| 19 | 0 | 0.00 | 0.00KB | 0.00 | 252594 | 0 |
| 20 | 0 | 0.00 | 0.00KB | 0.00 | 264969 | 0 |
| 21 | 0 | 0.00 | 0.00KB | 0.00 | 260436 | 0 |
| 22 | 0 | 0.00 | 0.00KB | 0.00 | 275473 | 0 |
| 23 | 0 | 0.00 | 0.00KB | 0.00 | 287559 | 0 |
| Total | 0 | 0.00 | 0.00KB | 0.00 | 6201345 | 0 |
 |
| >= 20% Full | >= 35% Full | >= 50% Full | >= 65% Full | >= 80% Full | >= 95% Full |
| Outgoing Feed | Batch Seq | Batch Num | Batch Max | %Full | Av. Pending |
|---|---|---|---|---|---|
| nbr.elbracht.net-o | 983167-983248 | 81 | 500 | 16 | 0.0 |
| text-spool-out | 0-0 | 0 | 500 | 0 | 0.0 |
| 1st Time | Last Time | # Msgs | Message |
|---|---|---|---|
| 22:00:19 | 22:00:26 | 3 | DNS Fwd/Rev mismatch: lookup of scanner-01.fr7.censys-scanner.com failed |