| |
DIABLO statistics for newsfeed.yoursite.com on Sat 31 Aug 2024 |
Generated on 20240831 2358 by feeder-stats v4.006. Copyright © 2002 The Diablo Project.
Diablo running processes:  81    Dnewslink running processes:  0


11:59PM  up 195 days,  7:18, 0 users, load averages: 1.02, 0.72, 0.70

Filesystem     Size    Used   Avail Capacity  Mounted on
/dev/da0s1g     94G    1.2G     85G     1%    /news
/dev/da1       7.3T    5.7T      1T    85%    /news2/spool/news/00
/dev/da2       7.3T    5.7T      1T    85%    /news2/spool/news/01
/dev/da3       3.7T    3.3T     66G    98%    /news2/spool/news/02
/dev/da4       5.5T    2.9T    2.2T    57%    /news2/spool/news/03
/dev/da8       7.3T    5.7T      1T    85%    /news2/spool/news/04
/dev/da9       7.3T    5.7T      1T    85%    /news2/spool/news/05
/dev/da10      7.3T    5.7T      1T    85%    /news2/spool/news/06
/dev/da11      5.5T      5T     63G    99%    /news2/spool/news/07
/dev/da12      5.5T    4.2T    794G    85%    /news2/spool/news/08
/dev/da13      7.3T    5.7T      1T    85%    /news2/spool/news/09
/dev/da14      7.3T    5.7T      1T    85%    /news2/spool/news/10
/dev/da15      7.3T    5.7T      1T    85%    /news2/spool/news/11
/dev/da16      7.3T    5.7T      1T    85%    /news2/spool/news/12
/dev/da17      7.3T    5.7T      1T    85%    /news2/spool/news/13
/dev/da18      7.3T    5.7T      1T    85%    /news2/spool/news/14
/dev/da19      7.3T    5.7T      1T    85%    /news2/spool/news/15
/dev/da20      7.3T    5.7T      1T    85%    /news2/spool/news/16
/dev/da21      7.3T    5.7T      1T    85%    /news2/spool/news/17
/dev/da22      7.3T    5.7T      1T    85%    /news2/spool/news/18
/dev/da23      7.3T    5.7T      1T    85%    /news2/spool/news/19
/dev/da24      7.3T    5.7T      1T    85%    /news2/spool/news/20
/dev/da25      7.3T    5.7T      1T    85%    /news2/spool/news/21
/dev/da26      7.3T    5.7T      1T    85%    /news2/spool/news/22
/dev/da5       221G     34G    169G    17%    /news1
/dev/md0        40G     13G     23G    36%    /news3
| Incoming Feed (+ Top1000 #) | Accepted | %Acc | %Tot | Art/sec | Volume | %Vol | KB/art | Check | Ihave | Spam | TooOld | Rejs | Errs | ||
|---|---|---|---|---|---|---|---|---|---|---|---|---|---|---|---|
| 1 | feeder.ecngs.de | 5565516 | 89.93 | 91.73 | 64.42 | 3.76TB | 99.88 | 725.41 | 6188747 | 0 | 0 | 0 | 278 | 0 | |
| 2 | feeder2.ecngs.de | 501462 | 78.25 | 8.27 | 5.80 | 4.61GB | 0.12 | 9.65 | 640520 | 0 | 0 | 0 | 327 | 0 | |
| Total | 6066978 | 0.00 | 100.00 | 70.22 | 3.76TB | 100.00 | 666.25 | 6829267 | 0 | 0 | 0 | 605 | 0 | ||
 |
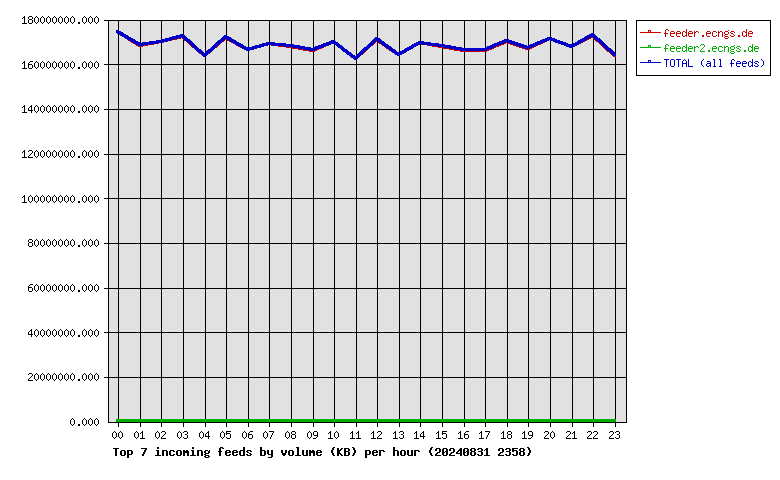
| Incoming Feed (+ Top1000 #) | Volume | %Vol | Kbps | Accepted | %Acc | %Tot | KB/art | Check | Ihave | Spam | TooOld | Rejs | Errs | ||
|---|---|---|---|---|---|---|---|---|---|---|---|---|---|---|---|
| 1 | feeder.ecngs.de | 3.76TB | 99.88 | 373823.54 | 5565516 | 89.93 | 91.73 | 725.41 | 6188747 | 0 | 0 | 0 | 278 | 0 | |
| 2 | feeder2.ecngs.de | 4.61GB | 0.12 | 447.85 | 501462 | 78.25 | 8.27 | 9.65 | 640520 | 0 | 0 | 0 | 327 | 0 | |
| Total | 3.76TB | 100.00 | 374271.39 | 6066978 | 0.00 | 100.00 | 666.25 | 6829267 | 0 | 0 | 0 | 605 | 0 | ||
 |
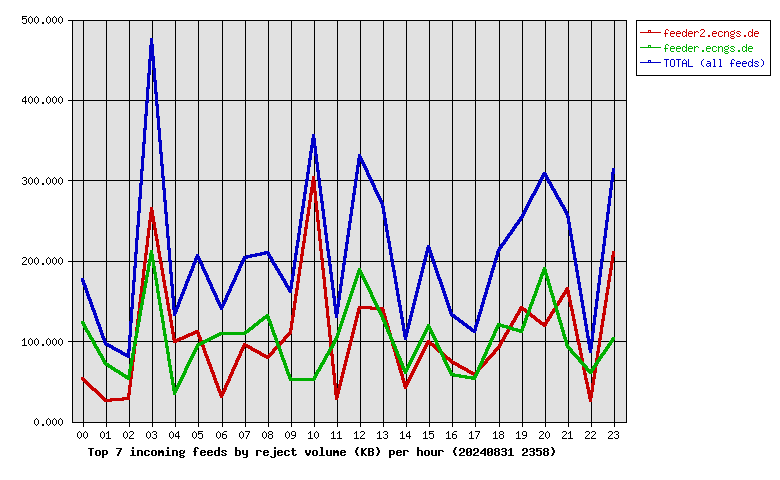
| Incoming Feed (+ Top1000 #) | Rej. Vol. | %Vol | Kbps | Accepted | %Acc | %Tot | KB/art | Check | Ihave | Spam | TooOld | Rejs | Errs | ||
|---|---|---|---|---|---|---|---|---|---|---|---|---|---|---|---|
| 1 | feeder2.ecngs.de | 2.47MB | 51.05 | 0.23 | 501462 | 78.25 | 8.27 | 9.65 | 640520 | 0 | 0 | 0 | 327 | 0 | |
| 2 | feeder.ecngs.de | 2.37MB | 48.95 | 0.22 | 5565516 | 89.93 | 91.73 | 725.41 | 6188747 | 0 | 0 | 0 | 278 | 0 | |
| Total | 4.84MB | 100.00 | 0.46 | 6066978 | 0.00 | 100.00 | 666.25 | 6829267 | 0 | 0 | 0 | 605 | 0 | ||
 |
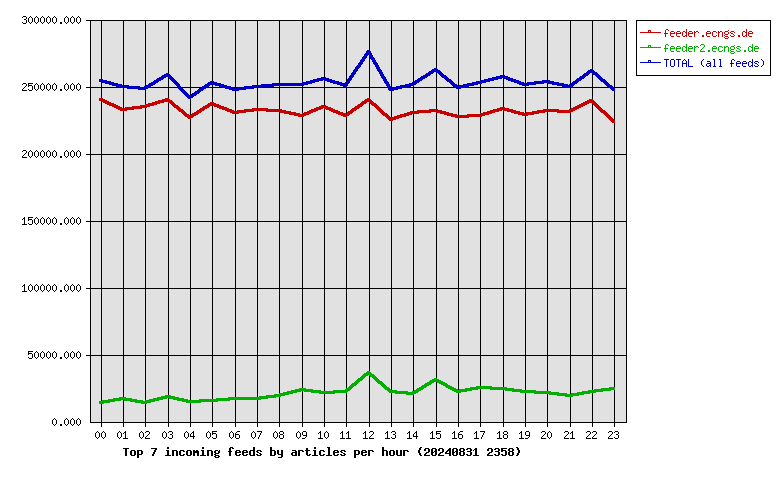
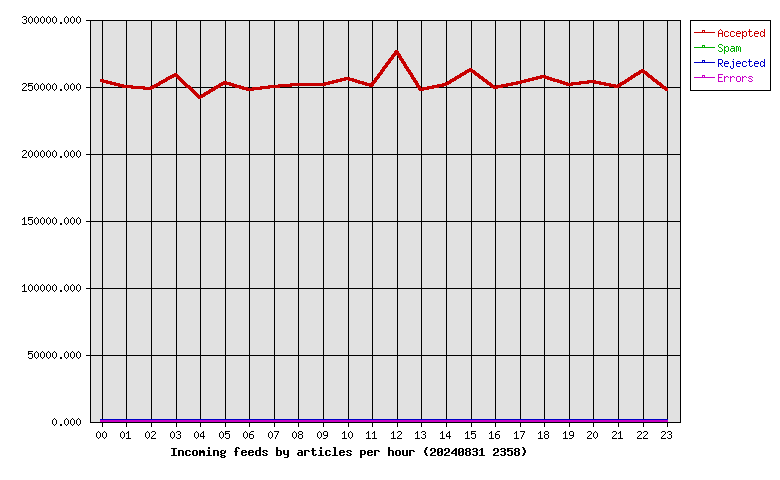
| Hour | Accepted | %Acc | Volume | %Vol | Check | Ihave | Spam | Rejs | Errs |
|---|---|---|---|---|---|---|---|---|---|
| 00 | 253948 | 4.19 | 166.27GB | 4.31 | 270496 | 0 | 0 | 17 | 0 |
| 01 | 249348 | 4.11 | 160.61GB | 4.17 | 277011 | 0 | 0 | 14 | 0 |
| 02 | 248396 | 4.09 | 162.05GB | 4.20 | 273720 | 0 | 0 | 9 | 0 |
| 03 | 258548 | 4.26 | 164.48GB | 4.27 | 298777 | 0 | 0 | 55 | 0 |
| 04 | 241055 | 3.97 | 156.18GB | 4.05 | 273935 | 0 | 0 | 13 | 0 |
| 05 | 252565 | 4.16 | 164.03GB | 4.26 | 301764 | 0 | 0 | 22 | 0 |
| 06 | 247226 | 4.07 | 158.78GB | 4.12 | 278281 | 0 | 0 | 14 | 0 |
| 07 | 249256 | 4.11 | 161.36GB | 4.19 | 276505 | 0 | 0 | 11 | 0 |
| 08 | 250818 | 4.13 | 160.35GB | 4.16 | 284757 | 0 | 0 | 19 | 0 |
| 09 | 251360 | 4.14 | 158.58GB | 4.11 | 292558 | 0 | 0 | 19 | 0 |
| 10 | 255709 | 4.21 | 162.04GB | 4.20 | 286938 | 0 | 0 | 36 | 0 |
| 11 | 250007 | 4.12 | 154.91GB | 4.02 | 275642 | 0 | 0 | 13 | 0 |
| 12 | 276070 | 4.55 | 163.29GB | 4.24 | 323689 | 0 | 0 | 60 | 0 |
| 13 | 247152 | 4.07 | 156.70GB | 4.06 | 275186 | 0 | 0 | 27 | 0 |
| 14 | 250895 | 4.14 | 161.83GB | 4.20 | 277998 | 0 | 0 | 16 | 0 |
| 15 | 262422 | 4.33 | 160.16GB | 4.15 | 299342 | 0 | 0 | 31 | 0 |
| 16 | 249082 | 4.11 | 158.54GB | 4.11 | 281126 | 0 | 0 | 24 | 0 |
| 17 | 252928 | 4.17 | 158.55GB | 4.11 | 284432 | 0 | 0 | 18 | 0 |
| 18 | 257259 | 4.24 | 162.27GB | 4.21 | 289519 | 0 | 0 | 32 | 0 |
| 19 | 250966 | 4.14 | 159.41GB | 4.14 | 279484 | 0 | 0 | 30 | 0 |
| 20 | 253631 | 4.18 | 163.34GB | 4.24 | 283581 | 0 | 0 | 31 | 0 |
| 21 | 249654 | 4.11 | 159.92GB | 4.15 | 273643 | 0 | 0 | 28 | 0 |
| 22 | 261376 | 4.31 | 164.93GB | 4.28 | 290364 | 0 | 0 | 20 | 0 |
| 23 | 247307 | 4.08 | 156.30GB | 4.05 | 280519 | 0 | 0 | 46 | 0 |
| Total | 6066978 | 100.00 | 3.76TB | 100.00 | 6829267 | 0 | 0 | 605 | 0 |
 |
| Outgoing Feed (+ Top1000 #) | Accepted | %Acc | %Tot | Art/sec | Volume | %Vol | KB/art | Dups | Rejs | % Ratio (Out/In) | ||
|---|---|---|---|---|---|---|---|---|---|---|---|---|
| 1 | 217.73.144.40 | 0 | 0.00 | 0.00 | 0.00 | 0.00KB | 0.00 | 0.00 | 6067643 | 0 | … | |
| Total | 0 | 0.00 | 0.00 | 0.00 | 0.00KB | 0.00 | 0.00 | 6067643 | 0 | |||
 |
| Outgoing Feed (+ Top1000 #) | Volume | %Vol | Kbps | Accepted | %Acc | %Tot | KB/art | Dups | Rejs | % Ratio (Out/In) | ||
|---|---|---|---|---|---|---|---|---|---|---|---|---|
| 1 | 217.73.144.40 | 0.00KB | 0.00 | 0.00 | 0 | 0.00 | 0.00 | 0.00 | 6067643 | 0 | … | |
| Total | 0.00KB | 0.00 | 0.00 | 0 | 0.00 | 0.00 | 0.00 | 6067643 | 0 | |||
 |
| Outgoing Feed (+ Top1000 #) | Rej. Vol. | %Vol | Kbps | Accepted | %Acc | %Tot | KB/art | Dups | Rejs | % Ratio (Out/In) | ||
|---|---|---|---|---|---|---|---|---|---|---|---|---|
| 1 | 217.73.144.40 | 0.00KB | 0.00 | 0.00 | 0 | 0.00 | 0.00 | 0.00 | 6067643 | 0 | … | |
| Total | 0.00KB | 0.00 | 0.00 | 0 | 0.00 | 0.00 | 0.00 | 6067643 | 0 | |||
 |
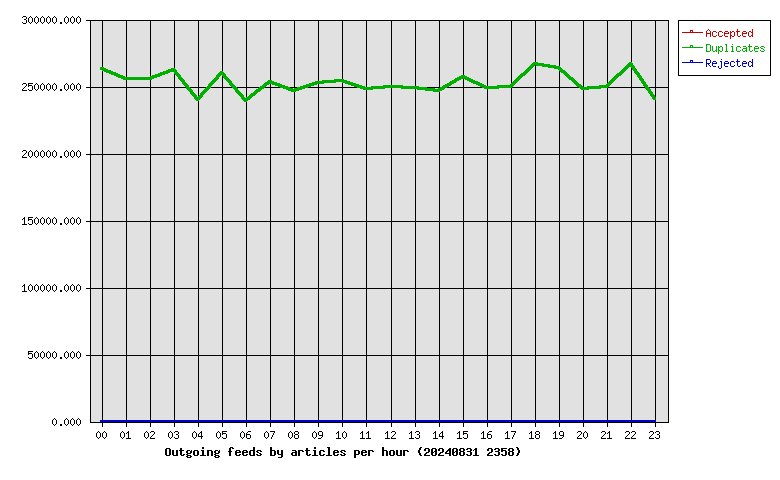
| Hour | Accepted | %Acc | Volume | %Vol | dups | Rejs |
|---|---|---|---|---|---|---|
| 00 | 0 | 0.00 | 0.00KB | 0.00 | 263387 | 0 |
| 01 | 0 | 0.00 | 0.00KB | 0.00 | 255923 | 0 |
| 02 | 0 | 0.00 | 0.00KB | 0.00 | 255477 | 0 |
| 03 | 0 | 0.00 | 0.00KB | 0.00 | 262060 | 0 |
| 04 | 0 | 0.00 | 0.00KB | 0.00 | 240173 | 0 |
| 05 | 0 | 0.00 | 0.00KB | 0.00 | 260333 | 0 |
| 06 | 0 | 0.00 | 0.00KB | 0.00 | 239073 | 0 |
| 07 | 0 | 0.00 | 0.00KB | 0.00 | 253389 | 0 |
| 08 | 0 | 0.00 | 0.00KB | 0.00 | 246759 | 0 |
| 09 | 0 | 0.00 | 0.00KB | 0.00 | 252561 | 0 |
| 10 | 0 | 0.00 | 0.00KB | 0.00 | 253821 | 0 |
| 11 | 0 | 0.00 | 0.00KB | 0.00 | 247959 | 0 |
| 12 | 0 | 0.00 | 0.00KB | 0.00 | 249402 | 0 |
| 13 | 0 | 0.00 | 0.00KB | 0.00 | 248673 | 0 |
| 14 | 0 | 0.00 | 0.00KB | 0.00 | 246315 | 0 |
| 15 | 0 | 0.00 | 0.00KB | 0.00 | 256757 | 0 |
| 16 | 0 | 0.00 | 0.00KB | 0.00 | 248969 | 0 |
| 17 | 0 | 0.00 | 0.00KB | 0.00 | 249832 | 0 |
| 18 | 0 | 0.00 | 0.00KB | 0.00 | 266619 | 0 |
| 19 | 0 | 0.00 | 0.00KB | 0.00 | 263949 | 0 |
| 20 | 0 | 0.00 | 0.00KB | 0.00 | 248490 | 0 |
| 21 | 0 | 0.00 | 0.00KB | 0.00 | 249999 | 0 |
| 22 | 0 | 0.00 | 0.00KB | 0.00 | 266716 | 0 |
| 23 | 0 | 0.00 | 0.00KB | 0.00 | 241007 | 0 |
| Total | 0 | 0.00 | 0.00KB | 0.00 | 6067643 | 0 |
 |
| >= 20% Full | >= 35% Full | >= 50% Full | >= 65% Full | >= 80% Full | >= 95% Full |
| Outgoing Feed | Batch Seq | Batch Num | Batch Max | %Full | Av. Pending |
|---|---|---|---|---|---|
| nbr.elbracht.net-o | 982879-982960 | 81 | 500 | 16 | 0.0 |
| text-spool-out | 0-0 | 0 | 500 | 0 | 0.0 |
| 1st Time | Last Time | # Msgs | Message |
|---|---|---|---|
| 08:40:00 | 1 | 217.73.144.40: Remote EOF, attempting to reconnect |