| |
DIABLO statistics for newsfeed.yoursite.com on Fri 30 Aug 2024 |
Generated on 20240830 2358 by feeder-stats v4.006. Copyright © 2002 The Diablo Project.
Diablo running processes:  81    Dnewslink running processes:  0


11:59PM  up 194 days,  7:18, 0 users, load averages: 1.36, 0.75, 0.62

Filesystem     Size    Used   Avail Capacity  Mounted on
/dev/da0s1g     94G    1.2G     85G     1%    /news
/dev/da1       7.3T    5.7T    1.0T    85%    /news2/spool/news/00
/dev/da2       7.3T    5.7T      1T    85%    /news2/spool/news/01
/dev/da3       3.7T    3.3T     67G    98%    /news2/spool/news/02
/dev/da4       5.5T    2.9T    2.2T    57%    /news2/spool/news/03
/dev/da8       7.3T    5.7T      1T    85%    /news2/spool/news/04
/dev/da9       7.3T    5.7T      1T    85%    /news2/spool/news/05
/dev/da10      7.3T    5.7T    1.0T    85%    /news2/spool/news/06
/dev/da11      5.5T      5T     67G    99%    /news2/spool/news/07
/dev/da12      5.5T    4.2T    802G    84%    /news2/spool/news/08
/dev/da13      7.3T    5.7T    1.0T    85%    /news2/spool/news/09
/dev/da14      7.3T    5.7T    1.0T    85%    /news2/spool/news/10
/dev/da15      7.3T    5.7T    1.0T    85%    /news2/spool/news/11
/dev/da16      7.3T    5.7T      1T    85%    /news2/spool/news/12
/dev/da17      7.3T    5.7T      1T    85%    /news2/spool/news/13
/dev/da18      7.3T    5.7T    1.0T    85%    /news2/spool/news/14
/dev/da19      7.3T    5.7T      1T    85%    /news2/spool/news/15
/dev/da20      7.3T    5.7T    1.0T    85%    /news2/spool/news/16
/dev/da21      7.3T    5.7T      1T    85%    /news2/spool/news/17
/dev/da22      7.3T    5.7T      1T    85%    /news2/spool/news/18
/dev/da23      7.3T    5.7T    1.0T    85%    /news2/spool/news/19
/dev/da24      7.3T    5.7T      1T    85%    /news2/spool/news/20
/dev/da25      7.3T    5.7T      1T    85%    /news2/spool/news/21
/dev/da26      7.3T    5.7T    1.0T    85%    /news2/spool/news/22
/dev/da5       221G     34G    169G    17%    /news1
/dev/md0        40G     12G     23G    36%    /news3
| Incoming Feed (+ Top1000 #) | Accepted | %Acc | %Tot | Art/sec | Volume | %Vol | KB/art | Check | Ihave | Spam | TooOld | Rejs | Errs | ||
|---|---|---|---|---|---|---|---|---|---|---|---|---|---|---|---|
| 1 | feeder.ecngs.de | 5544587 | 87.84 | 89.38 | 64.17 | 3.69TB | 99.87 | 714.85 | 6311458 | 0 | 0 | 0 | 374 | 0 | |
| 2 | feeder2.ecngs.de | 658547 | 82.81 | 10.62 | 7.62 | 4.83GB | 0.13 | 7.69 | 794756 | 0 | 0 | 0 | 542 | 0 | |
| Total | 6203134 | 0.00 | 100.00 | 71.80 | 3.70TB | 100.00 | 639.78 | 7106214 | 0 | 0 | 0 | 916 | 0 | ||
 |
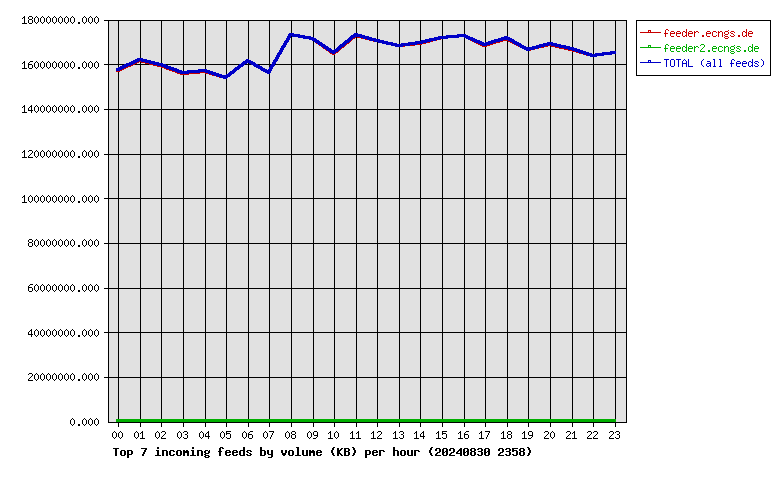
| Incoming Feed (+ Top1000 #) | Volume | %Vol | Kbps | Accepted | %Acc | %Tot | KB/art | Check | Ihave | Spam | TooOld | Rejs | Errs | ||
|---|---|---|---|---|---|---|---|---|---|---|---|---|---|---|---|
| 1 | feeder.ecngs.de | 3.69TB | 99.87 | 366995.47 | 5544587 | 87.84 | 89.38 | 714.85 | 6311458 | 0 | 0 | 0 | 374 | 0 | |
| 2 | feeder2.ecngs.de | 4.83GB | 0.13 | 468.97 | 658547 | 82.81 | 10.62 | 7.69 | 794756 | 0 | 0 | 0 | 542 | 0 | |
| Total | 3.70TB | 100.00 | 367464.44 | 6203134 | 0.00 | 100.00 | 639.78 | 7106214 | 0 | 0 | 0 | 916 | 0 | ||
 |
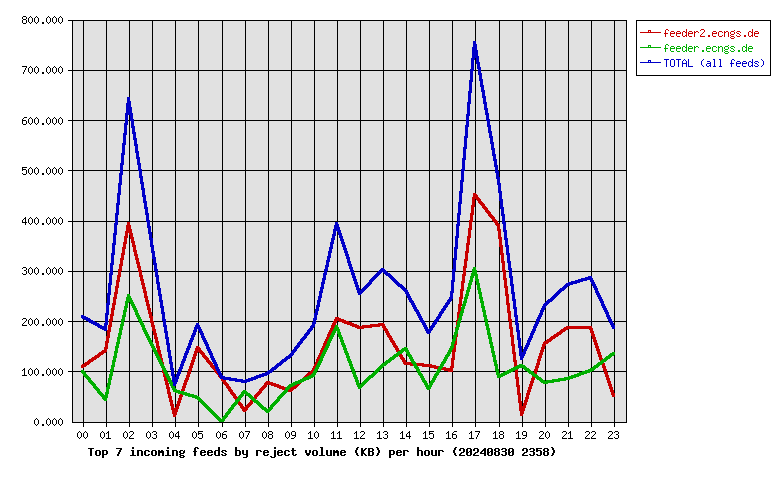
| Incoming Feed (+ Top1000 #) | Rej. Vol. | %Vol | Kbps | Accepted | %Acc | %Tot | KB/art | Check | Ihave | Spam | TooOld | Rejs | Errs | ||
|---|---|---|---|---|---|---|---|---|---|---|---|---|---|---|---|
| 1 | feeder2.ecngs.de | 3.60MB | 59.51 | 0.34 | 658547 | 82.81 | 10.62 | 7.69 | 794756 | 0 | 0 | 0 | 542 | 0 | |
| 2 | feeder.ecngs.de | 2.45MB | 40.49 | 0.23 | 5544587 | 87.84 | 89.38 | 714.85 | 6311458 | 0 | 0 | 0 | 374 | 0 | |
| Total | 6.04MB | 100.00 | 0.57 | 6203134 | 0.00 | 100.00 | 639.78 | 7106214 | 0 | 0 | 0 | 916 | 0 | ||
 |
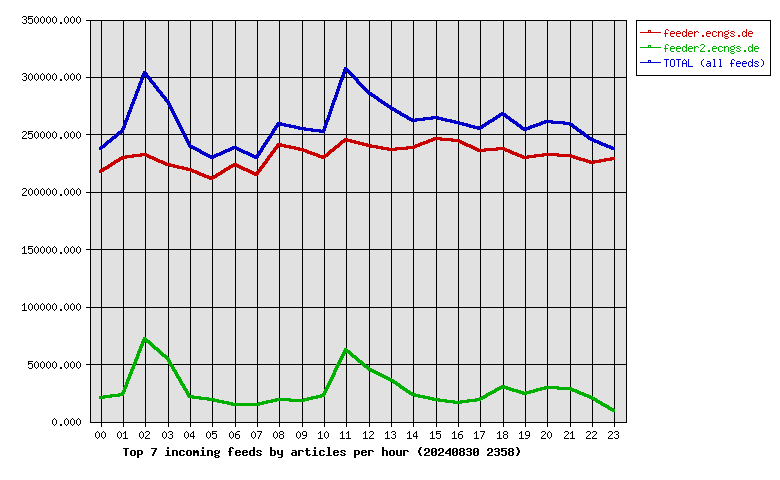
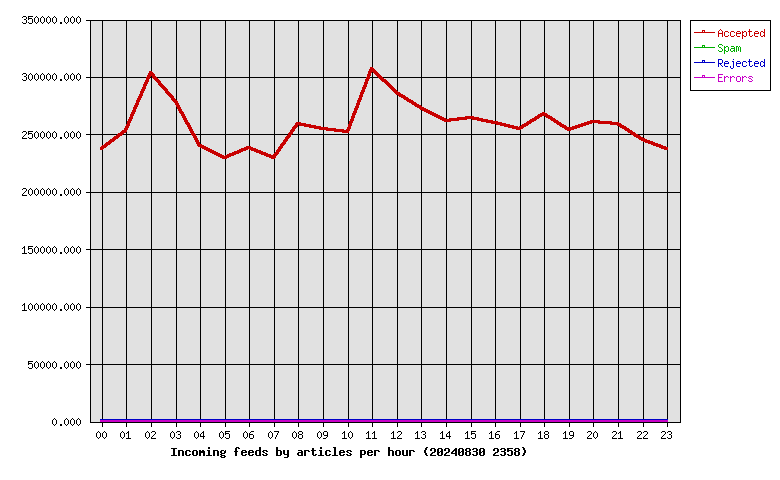
| Hour | Accepted | %Acc | Volume | %Vol | Check | Ihave | Spam | Rejs | Errs |
|---|---|---|---|---|---|---|---|---|---|
| 00 | 237242 | 3.82 | 149.92GB | 3.96 | 266252 | 0 | 0 | 27 | 0 |
| 01 | 252705 | 4.07 | 154.29GB | 4.08 | 285720 | 0 | 0 | 27 | 0 |
| 02 | 303850 | 4.90 | 152.12GB | 4.02 | 398425 | 0 | 0 | 161 | 0 |
| 03 | 277847 | 4.48 | 148.89GB | 3.93 | 359917 | 0 | 0 | 80 | 0 |
| 04 | 240130 | 3.87 | 149.46GB | 3.95 | 269782 | 0 | 0 | 13 | 0 |
| 05 | 229825 | 3.70 | 146.73GB | 3.88 | 270221 | 0 | 0 | 23 | 0 |
| 06 | 237732 | 3.83 | 153.94GB | 4.07 | 258383 | 0 | 0 | 8 | 0 |
| 07 | 228986 | 3.69 | 148.99GB | 3.94 | 244816 | 0 | 0 | 10 | 0 |
| 08 | 259207 | 4.18 | 165.16GB | 4.36 | 280652 | 0 | 0 | 15 | 0 |
| 09 | 254273 | 4.10 | 163.29GB | 4.31 | 274803 | 0 | 0 | 17 | 0 |
| 10 | 252011 | 4.06 | 157.23GB | 4.15 | 273014 | 0 | 0 | 32 | 0 |
| 11 | 307100 | 4.95 | 165.07GB | 4.36 | 383269 | 0 | 0 | 85 | 0 |
| 12 | 286036 | 4.61 | 162.57GB | 4.30 | 335264 | 0 | 0 | 63 | 0 |
| 13 | 272542 | 4.39 | 160.46GB | 4.24 | 321097 | 0 | 0 | 43 | 0 |
| 14 | 261202 | 4.21 | 161.50GB | 4.27 | 340628 | 0 | 0 | 35 | 0 |
| 15 | 264375 | 4.26 | 163.88GB | 4.33 | 295226 | 0 | 0 | 17 | 0 |
| 16 | 260219 | 4.19 | 164.59GB | 4.35 | 280576 | 0 | 0 | 17 | 0 |
| 17 | 254407 | 4.10 | 160.79GB | 4.25 | 275251 | 0 | 0 | 51 | 0 |
| 18 | 267592 | 4.31 | 163.68GB | 4.32 | 301601 | 0 | 0 | 49 | 0 |
| 19 | 253494 | 4.09 | 158.71GB | 4.19 | 279559 | 0 | 0 | 16 | 0 |
| 20 | 260510 | 4.20 | 161.03GB | 4.25 | 295145 | 0 | 0 | 39 | 0 |
| 21 | 259150 | 4.18 | 159.07GB | 4.20 | 289470 | 0 | 0 | 39 | 0 |
| 22 | 245161 | 3.95 | 156.08GB | 4.12 | 269846 | 0 | 0 | 41 | 0 |
| 23 | 237538 | 3.83 | 157.31GB | 4.16 | 257297 | 0 | 0 | 8 | 0 |
| Total | 6203134 | 100.00 | 3.70TB | 100.00 | 7106214 | 0 | 0 | 916 | 0 |
 |
| Outgoing Feed (+ Top1000 #) | Accepted | %Acc | %Tot | Art/sec | Volume | %Vol | KB/art | Dups | Rejs | % Ratio (Out/In) | ||
|---|---|---|---|---|---|---|---|---|---|---|---|---|
| 1 | 217.73.144.40 | 0 | 0.00 | 0.00 | 0.00 | 0.00KB | 0.00 | 0.00 | 6089412 | 0 | … | |
| Total | 0 | 0.00 | 0.00 | 0.00 | 0.00KB | 0.00 | 0.00 | 6089412 | 0 | |||
 |
| Outgoing Feed (+ Top1000 #) | Volume | %Vol | Kbps | Accepted | %Acc | %Tot | KB/art | Dups | Rejs | % Ratio (Out/In) | ||
|---|---|---|---|---|---|---|---|---|---|---|---|---|
| 1 | 217.73.144.40 | 0.00KB | 0.00 | 0.00 | 0 | 0.00 | 0.00 | 0.00 | 6089412 | 0 | … | |
| Total | 0.00KB | 0.00 | 0.00 | 0 | 0.00 | 0.00 | 0.00 | 6089412 | 0 | |||
 |
| Outgoing Feed (+ Top1000 #) | Rej. Vol. | %Vol | Kbps | Accepted | %Acc | %Tot | KB/art | Dups | Rejs | % Ratio (Out/In) | ||
|---|---|---|---|---|---|---|---|---|---|---|---|---|
| 1 | 217.73.144.40 | 0.00KB | 0.00 | 0.00 | 0 | 0.00 | 0.00 | 0.00 | 6089412 | 0 | … | |
| Total | 0.00KB | 0.00 | 0.00 | 0 | 0.00 | 0.00 | 0.00 | 6089412 | 0 | |||
 |
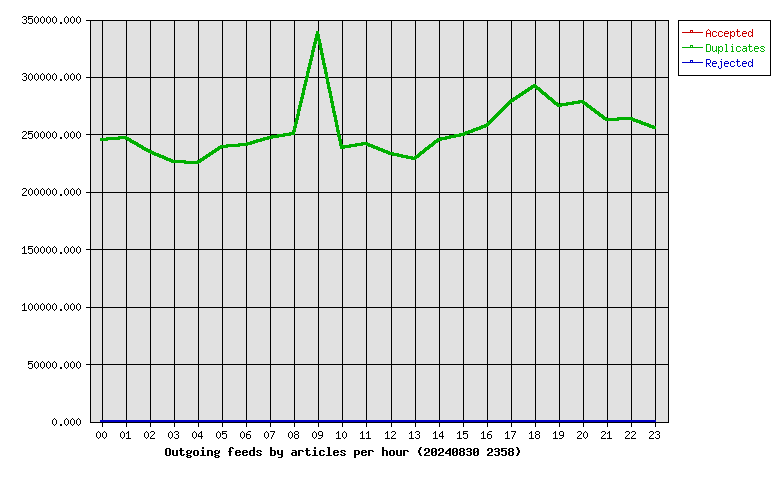
| Hour | Accepted | %Acc | Volume | %Vol | dups | Rejs |
|---|---|---|---|---|---|---|
| 00 | 0 | 0.00 | 0.00KB | 0.00 | 245132 | 0 |
| 01 | 0 | 0.00 | 0.00KB | 0.00 | 246908 | 0 |
| 02 | 0 | 0.00 | 0.00KB | 0.00 | 234285 | 0 |
| 03 | 0 | 0.00 | 0.00KB | 0.00 | 226001 | 0 |
| 04 | 0 | 0.00 | 0.00KB | 0.00 | 225488 | 0 |
| 05 | 0 | 0.00 | 0.00KB | 0.00 | 238947 | 0 |
| 06 | 0 | 0.00 | 0.00KB | 0.00 | 240385 | 0 |
| 07 | 0 | 0.00 | 0.00KB | 0.00 | 247102 | 0 |
| 08 | 0 | 0.00 | 0.00KB | 0.00 | 249882 | 0 |
| 09 | 0 | 0.00 | 0.00KB | 0.00 | 338044 | 0 |
| 10 | 0 | 0.00 | 0.00KB | 0.00 | 238316 | 0 |
| 11 | 0 | 0.00 | 0.00KB | 0.00 | 241525 | 0 |
| 12 | 0 | 0.00 | 0.00KB | 0.00 | 232672 | 0 |
| 13 | 0 | 0.00 | 0.00KB | 0.00 | 228116 | 0 |
| 14 | 0 | 0.00 | 0.00KB | 0.00 | 245054 | 0 |
| 15 | 0 | 0.00 | 0.00KB | 0.00 | 249165 | 0 |
| 16 | 0 | 0.00 | 0.00KB | 0.00 | 257644 | 0 |
| 17 | 0 | 0.00 | 0.00KB | 0.00 | 277986 | 0 |
| 18 | 0 | 0.00 | 0.00KB | 0.00 | 292228 | 0 |
| 19 | 0 | 0.00 | 0.00KB | 0.00 | 275009 | 0 |
| 20 | 0 | 0.00 | 0.00KB | 0.00 | 277748 | 0 |
| 21 | 0 | 0.00 | 0.00KB | 0.00 | 262448 | 0 |
| 22 | 0 | 0.00 | 0.00KB | 0.00 | 263367 | 0 |
| 23 | 0 | 0.00 | 0.00KB | 0.00 | 255960 | 0 |
| Total | 0 | 0.00 | 0.00KB | 0.00 | 6089412 | 0 |
 |
| >= 20% Full | >= 35% Full | >= 50% Full | >= 65% Full | >= 80% Full | >= 95% Full |
| Outgoing Feed | Batch Seq | Batch Num | Batch Max | %Full | Av. Pending |
|---|---|---|---|---|---|
| nbr.elbracht.net-o | 982591-982672 | 81 | 500 | 16 | 0.0 |
| text-spool-out | 0-0 | 0 | 500 | 0 | 0.0 |
| 1st Time | Last Time | # Msgs | Message |
|---|