| |
DIABLO statistics for newsfeed.yoursite.com on Thu 29 Aug 2024 |
Generated on 20240829 2358 by feeder-stats v4.006. Copyright © 2002 The Diablo Project.
Diablo running processes:  81    Dnewslink running processes:  0


11:59PM  up 193 days,  7:18, 0 users, load averages: 1.31, 0.73, 0.60

Filesystem     Size    Used   Avail Capacity  Mounted on
/dev/da0s1g     94G    1.2G     85G     1%    /news
/dev/da1       7.3T    5.7T    1.0T    85%    /news2/spool/news/00
/dev/da2       7.3T    5.7T    1.0T    85%    /news2/spool/news/01
/dev/da3       3.7T    3.3T     66G    98%    /news2/spool/news/02
/dev/da4       5.5T    2.9T    2.2T    57%    /news2/spool/news/03
/dev/da8       7.3T    5.7T    1.0T    85%    /news2/spool/news/04
/dev/da9       7.3T    5.7T    1.0T    85%    /news2/spool/news/05
/dev/da10      7.3T    5.7T    1.0T    85%    /news2/spool/news/06
/dev/da11      5.5T      5T     63G    99%    /news2/spool/news/07
/dev/da12      5.5T    4.2T    807G    84%    /news2/spool/news/08
/dev/da13      7.3T    5.7T    1.0T    85%    /news2/spool/news/09
/dev/da14      7.3T    5.7T    1.0T    85%    /news2/spool/news/10
/dev/da15      7.3T    5.7T    1.0T    85%    /news2/spool/news/11
/dev/da16      7.3T    5.7T    1.0T    85%    /news2/spool/news/12
/dev/da17      7.3T    5.7T    1.0T    85%    /news2/spool/news/13
/dev/da18      7.3T    5.7T    1.0T    85%    /news2/spool/news/14
/dev/da19      7.3T    5.7T    1.0T    85%    /news2/spool/news/15
/dev/da20      7.3T    5.7T    1.0T    85%    /news2/spool/news/16
/dev/da21      7.3T    5.7T    1.0T    85%    /news2/spool/news/17
/dev/da22      7.3T    5.7T    1.0T    85%    /news2/spool/news/18
/dev/da23      7.3T    5.7T    1.0T    85%    /news2/spool/news/19
/dev/da24      7.3T    5.7T    1.0T    85%    /news2/spool/news/20
/dev/da25      7.3T    5.7T    1.0T    85%    /news2/spool/news/21
/dev/da26      7.3T    5.7T    1.0T    85%    /news2/spool/news/22
/dev/da5       221G     34G    169G    17%    /news1
/dev/md0        40G     12G     23G    36%    /news3
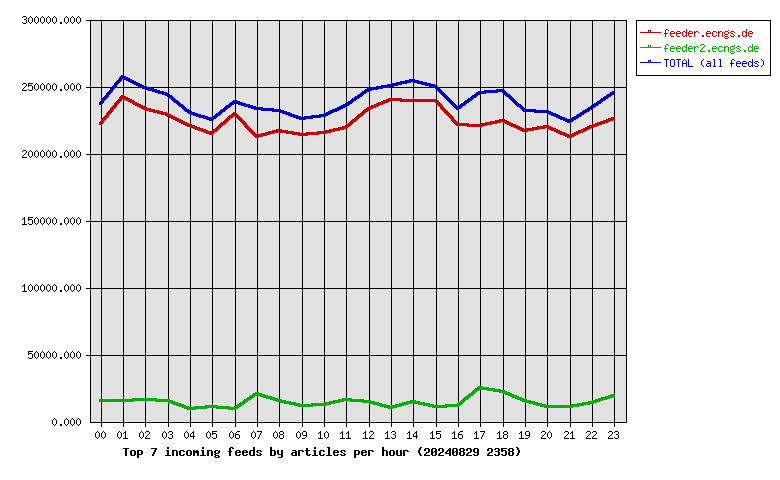
| Incoming Feed (+ Top1000 #) | Accepted | %Acc | %Tot | Art/sec | Volume | %Vol | KB/art | Check | Ihave | Spam | TooOld | Rejs | Errs | ||
|---|---|---|---|---|---|---|---|---|---|---|---|---|---|---|---|
| 1 | feeder.ecngs.de | 5379622 | 92.75 | 93.94 | 62.26 | 3.57TB | 99.93 | 712.91 | 5799621 | 0 | 0 | 0 | 242 | 0 | |
| 2 | feeder2.ecngs.de | 346887 | 79.75 | 6.06 | 4.02 | 2.47GB | 0.07 | 7.45 | 434838 | 0 | 0 | 0 | 140 | 0 | |
| Total | 5726509 | 0.00 | 100.00 | 66.29 | 3.57TB | 100.00 | 670.18 | 6234459 | 0 | 0 | 0 | 382 | 0 | ||
 |
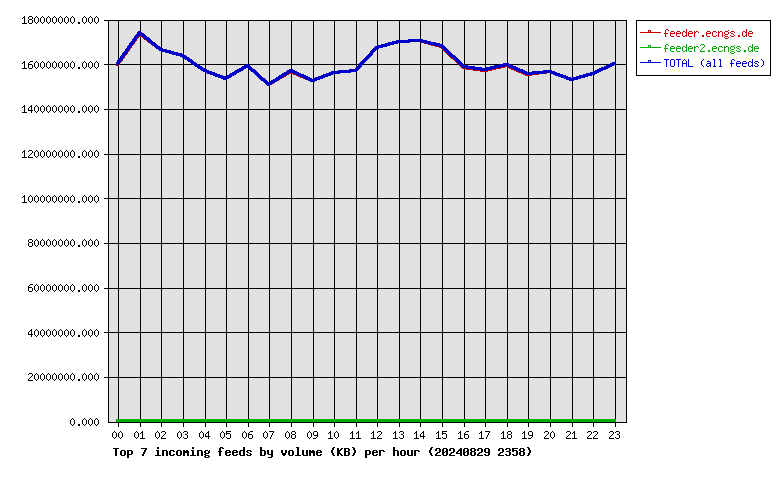
| Incoming Feed (+ Top1000 #) | Volume | %Vol | Kbps | Accepted | %Acc | %Tot | KB/art | Check | Ihave | Spam | TooOld | Rejs | Errs | ||
|---|---|---|---|---|---|---|---|---|---|---|---|---|---|---|---|
| 1 | feeder.ecngs.de | 3.57TB | 99.93 | 355110.43 | 5379622 | 92.75 | 93.94 | 712.91 | 5799621 | 0 | 0 | 0 | 242 | 0 | |
| 2 | feeder2.ecngs.de | 2.47GB | 0.07 | 239.98 | 346887 | 79.75 | 6.06 | 7.45 | 434838 | 0 | 0 | 0 | 140 | 0 | |
| Total | 3.57TB | 100.00 | 355350.41 | 5726509 | 0.00 | 100.00 | 670.18 | 6234459 | 0 | 0 | 0 | 382 | 0 | ||
 |
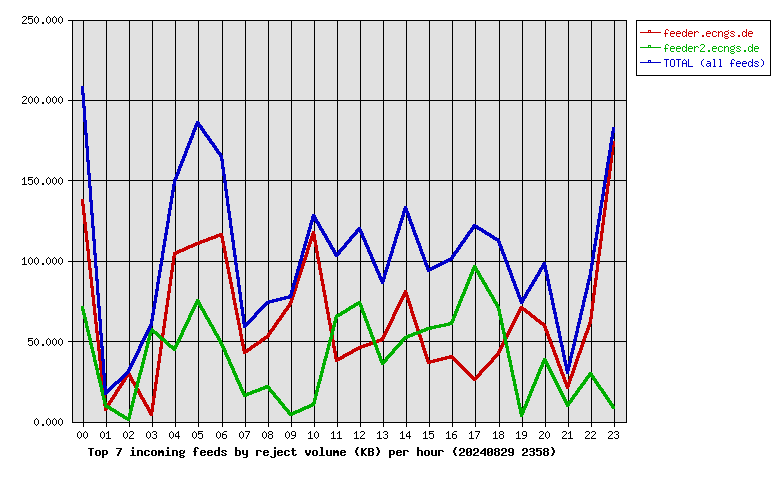
| Incoming Feed (+ Top1000 #) | Rej. Vol. | %Vol | Kbps | Accepted | %Acc | %Tot | KB/art | Check | Ihave | Spam | TooOld | Rejs | Errs | ||
|---|---|---|---|---|---|---|---|---|---|---|---|---|---|---|---|
| 1 | feeder.ecngs.de | 1.50MB | 61.64 | 0.14 | 5379622 | 92.75 | 93.94 | 712.91 | 5799621 | 0 | 0 | 0 | 242 | 0 | |
| 2 | feeder2.ecngs.de | 957.47KB | 38.36 | 0.09 | 346887 | 79.75 | 6.06 | 7.45 | 434838 | 0 | 0 | 0 | 140 | 0 | |
| Total | 2.44MB | 100.00 | 0.23 | 5726509 | 0.00 | 100.00 | 670.18 | 6234459 | 0 | 0 | 0 | 382 | 0 | ||
 |
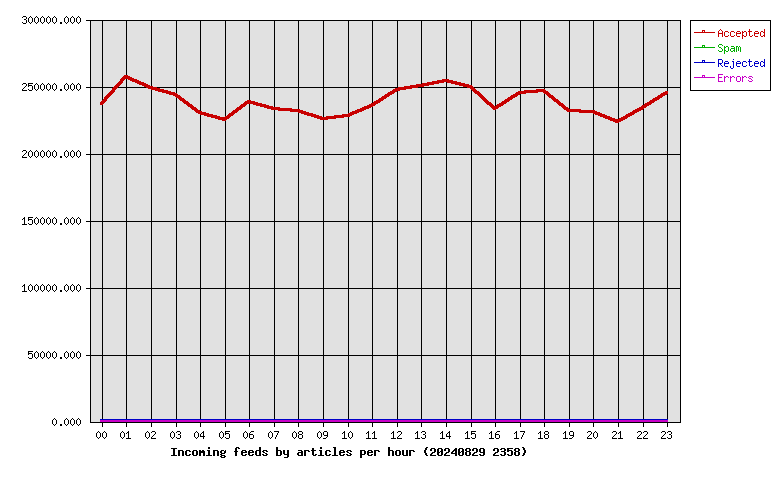
| Hour | Accepted | %Acc | Volume | %Vol | Check | Ihave | Spam | Rejs | Errs |
|---|---|---|---|---|---|---|---|---|---|
| 00 | 237274 | 4.14 | 152.55GB | 4.17 | 257602 | 0 | 0 | 30 | 0 |
| 01 | 256986 | 4.49 | 165.72GB | 4.53 | 273564 | 0 | 0 | 11 | 0 |
| 02 | 248806 | 4.34 | 158.80GB | 4.34 | 268890 | 0 | 0 | 7 | 0 |
| 03 | 243925 | 4.26 | 156.04GB | 4.26 | 261219 | 0 | 0 | 15 | 0 |
| 04 | 230229 | 4.02 | 149.55GB | 4.09 | 242987 | 0 | 0 | 20 | 0 |
| 05 | 224923 | 3.93 | 146.17GB | 3.99 | 238159 | 0 | 0 | 34 | 0 |
| 06 | 238785 | 4.17 | 151.85GB | 4.15 | 251643 | 0 | 0 | 18 | 0 |
| 07 | 233206 | 4.07 | 143.74GB | 3.93 | 256248 | 0 | 0 | 26 | 0 |
| 08 | 232058 | 4.05 | 149.49GB | 4.08 | 251881 | 0 | 0 | 12 | 0 |
| 09 | 225758 | 3.94 | 145.50GB | 3.98 | 241210 | 0 | 0 | 20 | 0 |
| 10 | 227875 | 3.98 | 148.74GB | 4.06 | 244886 | 0 | 0 | 18 | 0 |
| 11 | 235392 | 4.11 | 149.83GB | 4.09 | 253717 | 0 | 0 | 15 | 0 |
| 12 | 247426 | 4.32 | 159.52GB | 4.36 | 265679 | 0 | 0 | 11 | 0 |
| 13 | 250063 | 4.37 | 162.11GB | 4.43 | 264491 | 0 | 0 | 10 | 0 |
| 14 | 253747 | 4.43 | 162.47GB | 4.44 | 276937 | 0 | 0 | 13 | 0 |
| 15 | 249811 | 4.36 | 160.18GB | 4.38 | 279208 | 0 | 0 | 11 | 0 |
| 16 | 232913 | 4.07 | 151.22GB | 4.13 | 254803 | 0 | 0 | 5 | 0 |
| 17 | 245434 | 4.29 | 149.91GB | 4.10 | 282546 | 0 | 0 | 24 | 0 |
| 18 | 246630 | 4.31 | 152.03GB | 4.15 | 283377 | 0 | 0 | 14 | 0 |
| 19 | 231846 | 4.05 | 148.26GB | 4.05 | 251192 | 0 | 0 | 13 | 0 |
| 20 | 230657 | 4.03 | 149.38GB | 4.08 | 252031 | 0 | 0 | 14 | 0 |
| 21 | 223445 | 3.90 | 145.78GB | 3.98 | 258646 | 0 | 0 | 6 | 0 |
| 22 | 233936 | 4.09 | 148.28GB | 4.05 | 252483 | 0 | 0 | 13 | 0 |
| 23 | 245384 | 4.29 | 152.87GB | 4.18 | 271060 | 0 | 0 | 22 | 0 |
| Total | 5726509 | 100.00 | 3.57TB | 100.00 | 6234459 | 0 | 0 | 382 | 0 |
 |
| Outgoing Feed (+ Top1000 #) | Accepted | %Acc | %Tot | Art/sec | Volume | %Vol | KB/art | Dups | Rejs | % Ratio (Out/In) | ||
|---|---|---|---|---|---|---|---|---|---|---|---|---|
| 1 | 217.73.144.40 | 0 | 0.00 | 0.00 | 0.00 | 0.00KB | 0.00 | 0.00 | 5690900 | 0 | … | |
| Total | 0 | 0.00 | 0.00 | 0.00 | 0.00KB | 0.00 | 0.00 | 5690900 | 0 | |||
 |
| Outgoing Feed (+ Top1000 #) | Volume | %Vol | Kbps | Accepted | %Acc | %Tot | KB/art | Dups | Rejs | % Ratio (Out/In) | ||
|---|---|---|---|---|---|---|---|---|---|---|---|---|
| 1 | 217.73.144.40 | 0.00KB | 0.00 | 0.00 | 0 | 0.00 | 0.00 | 0.00 | 5690900 | 0 | … | |
| Total | 0.00KB | 0.00 | 0.00 | 0 | 0.00 | 0.00 | 0.00 | 5690900 | 0 | |||
 |
| Outgoing Feed (+ Top1000 #) | Rej. Vol. | %Vol | Kbps | Accepted | %Acc | %Tot | KB/art | Dups | Rejs | % Ratio (Out/In) | ||
|---|---|---|---|---|---|---|---|---|---|---|---|---|
| 1 | 217.73.144.40 | 0.00KB | 0.00 | 0.00 | 0 | 0.00 | 0.00 | 0.00 | 5690900 | 0 | … | |
| Total | 0.00KB | 0.00 | 0.00 | 0 | 0.00 | 0.00 | 0.00 | 5690900 | 0 | |||
 |
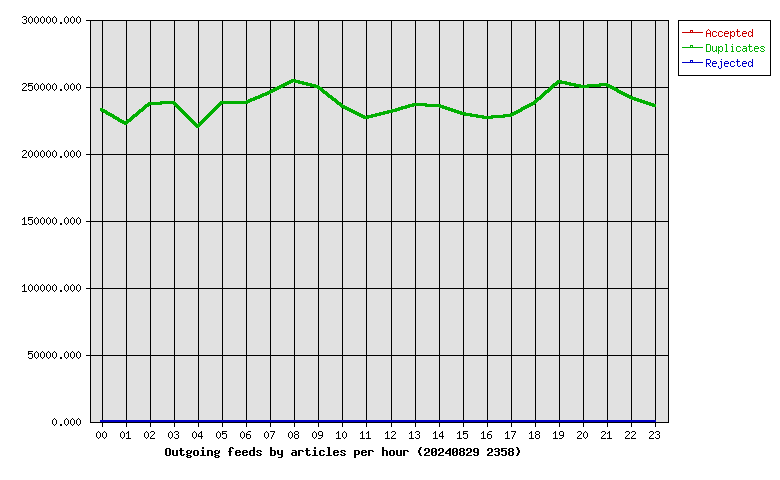
| Hour | Accepted | %Acc | Volume | %Vol | dups | Rejs |
|---|---|---|---|---|---|---|
| 00 | 0 | 0.00 | 0.00KB | 0.00 | 232448 | 0 |
| 01 | 0 | 0.00 | 0.00KB | 0.00 | 221759 | 0 |
| 02 | 0 | 0.00 | 0.00KB | 0.00 | 236647 | 0 |
| 03 | 0 | 0.00 | 0.00KB | 0.00 | 237411 | 0 |
| 04 | 0 | 0.00 | 0.00KB | 0.00 | 219782 | 0 |
| 05 | 0 | 0.00 | 0.00KB | 0.00 | 237660 | 0 |
| 06 | 0 | 0.00 | 0.00KB | 0.00 | 237639 | 0 |
| 07 | 0 | 0.00 | 0.00KB | 0.00 | 245109 | 0 |
| 08 | 0 | 0.00 | 0.00KB | 0.00 | 254470 | 0 |
| 09 | 0 | 0.00 | 0.00KB | 0.00 | 249826 | 0 |
| 10 | 0 | 0.00 | 0.00KB | 0.00 | 235615 | 0 |
| 11 | 0 | 0.00 | 0.00KB | 0.00 | 226706 | 0 |
| 12 | 0 | 0.00 | 0.00KB | 0.00 | 230811 | 0 |
| 13 | 0 | 0.00 | 0.00KB | 0.00 | 236105 | 0 |
| 14 | 0 | 0.00 | 0.00KB | 0.00 | 235131 | 0 |
| 15 | 0 | 0.00 | 0.00KB | 0.00 | 229386 | 0 |
| 16 | 0 | 0.00 | 0.00KB | 0.00 | 226487 | 0 |
| 17 | 0 | 0.00 | 0.00KB | 0.00 | 228275 | 0 |
| 18 | 0 | 0.00 | 0.00KB | 0.00 | 237778 | 0 |
| 19 | 0 | 0.00 | 0.00KB | 0.00 | 253621 | 0 |
| 20 | 0 | 0.00 | 0.00KB | 0.00 | 249924 | 0 |
| 21 | 0 | 0.00 | 0.00KB | 0.00 | 251101 | 0 |
| 22 | 0 | 0.00 | 0.00KB | 0.00 | 241654 | 0 |
| 23 | 0 | 0.00 | 0.00KB | 0.00 | 235555 | 0 |
| Total | 0 | 0.00 | 0.00KB | 0.00 | 5690900 | 0 |
 |
| >= 20% Full | >= 35% Full | >= 50% Full | >= 65% Full | >= 80% Full | >= 95% Full |
| Outgoing Feed | Batch Seq | Batch Num | Batch Max | %Full | Av. Pending |
|---|---|---|---|---|---|
| nbr.elbracht.net-o | 982303-982384 | 81 | 500 | 16 | 0.0 |
| text-spool-out | 0-0 | 0 | 500 | 0 | 0.0 |
| 1st Time | Last Time | # Msgs | Message |
|---|---|---|---|
| 14:04:08 | 1 | DNS Fwd/Rev mismatch: security.criminalip.com/185.242.226.41 |