| |
DIABLO statistics for newsfeed.yoursite.com on Wed 28 Aug 2024 |
Generated on 20240828 2358 by feeder-stats v4.006. Copyright © 2002 The Diablo Project.
Diablo running processes:  81    Dnewslink running processes:  0


11:59PM  up 192 days,  7:18, 0 users, load averages: 0.97, 0.65, 0.62

Filesystem     Size    Used   Avail Capacity  Mounted on
/dev/da0s1g     94G    1.2G     85G     1%    /news
/dev/da1       7.3T    5.7T    1.0T    85%    /news2/spool/news/00
/dev/da2       7.3T    5.7T    1.0T    85%    /news2/spool/news/01
/dev/da3       3.7T    3.3T     62G    98%    /news2/spool/news/02
/dev/da4       5.5T    2.9T    2.2T    57%    /news2/spool/news/03
/dev/da8       7.3T    5.7T    1.0T    85%    /news2/spool/news/04
/dev/da9       7.3T    5.7T    1.0T    85%    /news2/spool/news/05
/dev/da10      7.3T    5.7T    1.0T    85%    /news2/spool/news/06
/dev/da11      5.5T      5T     62G    99%    /news2/spool/news/07
/dev/da12      5.5T    4.2T    810G    84%    /news2/spool/news/08
/dev/da13      7.3T    5.7T    1.0T    85%    /news2/spool/news/09
/dev/da14      7.3T    5.7T    1.0T    85%    /news2/spool/news/10
/dev/da15      7.3T    5.7T    1.0T    85%    /news2/spool/news/11
/dev/da16      7.3T    5.7T    1.0T    85%    /news2/spool/news/12
/dev/da17      7.3T    5.7T    1.0T    85%    /news2/spool/news/13
/dev/da18      7.3T    5.7T    1.0T    85%    /news2/spool/news/14
/dev/da19      7.3T    5.7T    1.0T    85%    /news2/spool/news/15
/dev/da20      7.3T    5.7T    1.0T    85%    /news2/spool/news/16
/dev/da21      7.3T    5.7T    1.0T    85%    /news2/spool/news/17
/dev/da22      7.3T    5.7T    1.0T    85%    /news2/spool/news/18
/dev/da23      7.3T    5.7T    1.0T    85%    /news2/spool/news/19
/dev/da24      7.3T    5.7T    1.0T    85%    /news2/spool/news/20
/dev/da25      7.3T    5.7T    1.0T    85%    /news2/spool/news/21
/dev/da26      7.3T    5.7T    1.0T    85%    /news2/spool/news/22
/dev/da5       221G     34G    169G    17%    /news1
/dev/md0        40G     12G     23G    36%    /news3
| Incoming Feed (+ Top1000 #) | Accepted | %Acc | %Tot | Art/sec | Volume | %Vol | KB/art | Check | Ihave | Spam | TooOld | Rejs | Errs | ||
|---|---|---|---|---|---|---|---|---|---|---|---|---|---|---|---|
| 1 | feeder.ecngs.de | 5321534 | 90.62 | 91.53 | 61.59 | 3.51TB | 99.91 | 708.42 | 5871923 | 0 | 0 | 0 | 345 | 0 | |
| 2 | feeder2.ecngs.de | 492156 | 87.04 | 8.47 | 5.70 | 3.20GB | 0.09 | 6.81 | 565163 | 0 | 0 | 0 | 300 | 0 | |
| Total | 5813690 | 0.00 | 100.00 | 67.29 | 3.51TB | 100.00 | 649.03 | 6437086 | 0 | 0 | 0 | 645 | 0 | ||
 |
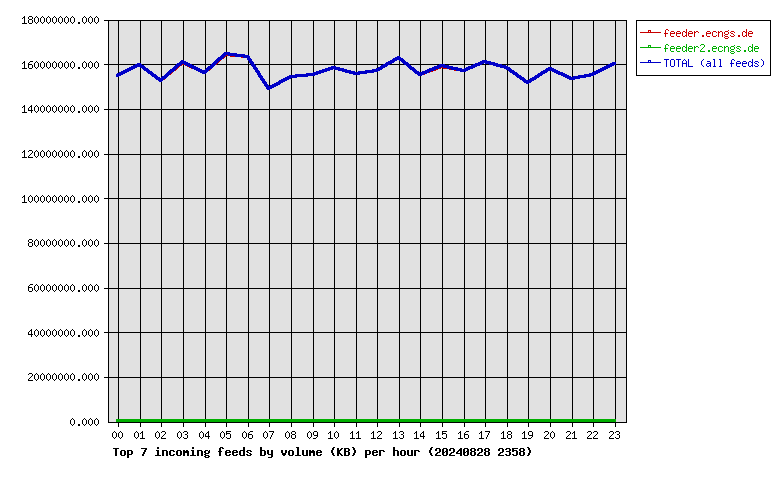
| Incoming Feed (+ Top1000 #) | Volume | %Vol | Kbps | Accepted | %Acc | %Tot | KB/art | Check | Ihave | Spam | TooOld | Rejs | Errs | ||
|---|---|---|---|---|---|---|---|---|---|---|---|---|---|---|---|
| 1 | feeder.ecngs.de | 3.51TB | 99.91 | 349064.05 | 5321534 | 90.62 | 91.53 | 708.42 | 5871923 | 0 | 0 | 0 | 345 | 0 | |
| 2 | feeder2.ecngs.de | 3.20GB | 0.09 | 310.52 | 492156 | 87.04 | 8.47 | 6.81 | 565163 | 0 | 0 | 0 | 300 | 0 | |
| Total | 3.51TB | 100.00 | 349374.56 | 5813690 | 0.00 | 100.00 | 649.03 | 6437086 | 0 | 0 | 0 | 645 | 0 | ||
 |
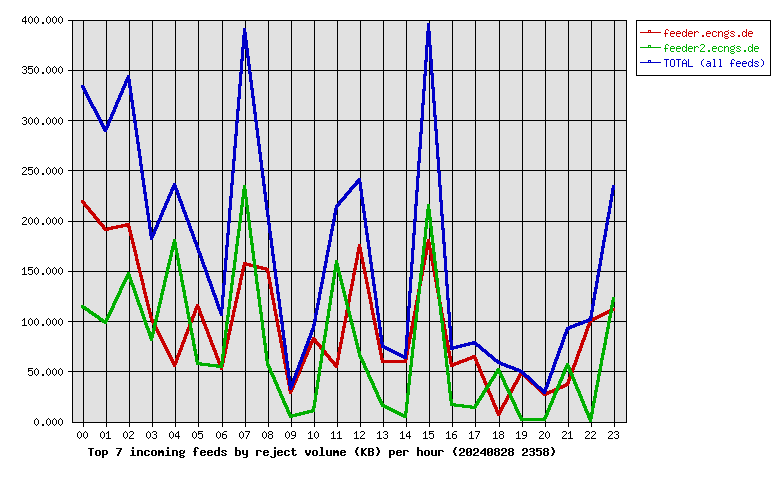
| Incoming Feed (+ Top1000 #) | Rej. Vol. | %Vol | Kbps | Accepted | %Acc | %Tot | KB/art | Check | Ihave | Spam | TooOld | Rejs | Errs | ||
|---|---|---|---|---|---|---|---|---|---|---|---|---|---|---|---|
| 1 | feeder.ecngs.de | 2.27MB | 56.87 | 0.21 | 5321534 | 90.62 | 91.53 | 708.42 | 5871923 | 0 | 0 | 0 | 345 | 0 | |
| 2 | feeder2.ecngs.de | 1.72MB | 43.13 | 0.16 | 492156 | 87.04 | 8.47 | 6.81 | 565163 | 0 | 0 | 0 | 300 | 0 | |
| Total | 3.99MB | 100.00 | 0.38 | 5813690 | 0.00 | 100.00 | 649.03 | 6437086 | 0 | 0 | 0 | 645 | 0 | ||
 |
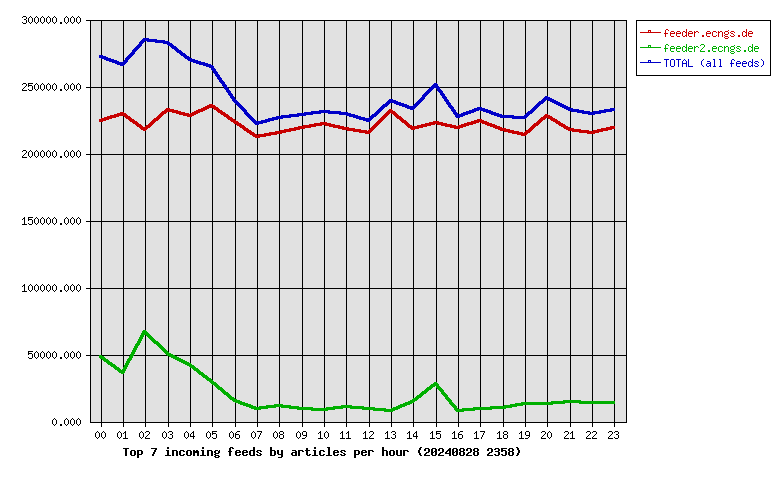
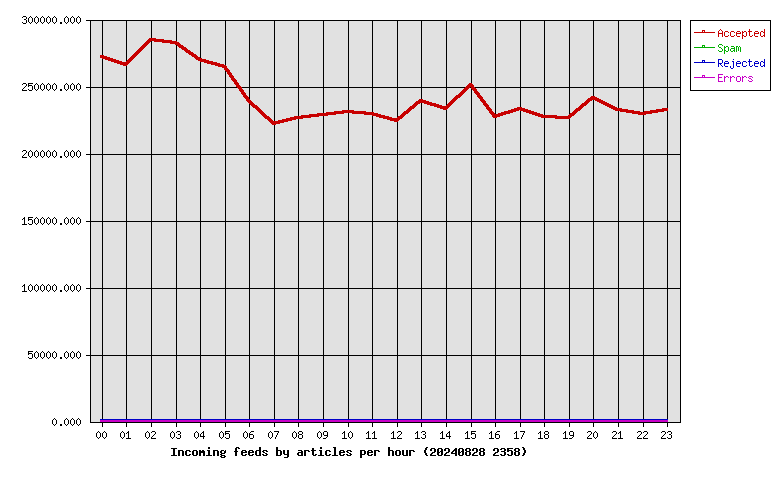
| Hour | Accepted | %Acc | Volume | %Vol | Check | Ihave | Spam | Rejs | Errs |
|---|---|---|---|---|---|---|---|---|---|
| 00 | 272281 | 4.68 | 147.65GB | 4.10 | 377526 | 0 | 0 | 77 | 0 |
| 01 | 265828 | 4.57 | 152.42GB | 4.24 | 308941 | 0 | 0 | 62 | 0 |
| 02 | 284555 | 4.89 | 145.51GB | 4.04 | 353012 | 0 | 0 | 86 | 0 |
| 03 | 282738 | 4.86 | 153.49GB | 4.27 | 344725 | 0 | 0 | 49 | 0 |
| 04 | 270040 | 4.64 | 148.88GB | 4.14 | 325743 | 0 | 0 | 70 | 0 |
| 05 | 264888 | 4.56 | 156.75GB | 4.36 | 305192 | 0 | 0 | 51 | 0 |
| 06 | 238967 | 4.11 | 155.53GB | 4.32 | 256837 | 0 | 0 | 13 | 0 |
| 07 | 221737 | 3.81 | 142.11GB | 3.95 | 232451 | 0 | 0 | 24 | 0 |
| 08 | 226804 | 3.90 | 147.17GB | 4.09 | 238658 | 0 | 0 | 15 | 0 |
| 09 | 228460 | 3.93 | 148.17GB | 4.12 | 238804 | 0 | 0 | 6 | 0 |
| 10 | 230721 | 3.97 | 151.10GB | 4.20 | 241116 | 0 | 0 | 13 | 0 |
| 11 | 229408 | 3.95 | 148.49GB | 4.13 | 240666 | 0 | 0 | 16 | 0 |
| 12 | 224516 | 3.86 | 149.55GB | 4.16 | 236116 | 0 | 0 | 18 | 0 |
| 13 | 239198 | 4.11 | 155.33GB | 4.32 | 247754 | 0 | 0 | 7 | 0 |
| 14 | 233115 | 4.01 | 148.17GB | 4.12 | 249683 | 0 | 0 | 8 | 0 |
| 15 | 250825 | 4.31 | 151.78GB | 4.22 | 282314 | 0 | 0 | 37 | 0 |
| 16 | 226918 | 3.90 | 149.75GB | 4.16 | 236637 | 0 | 0 | 7 | 0 |
| 17 | 232995 | 4.01 | 153.44GB | 4.26 | 243342 | 0 | 0 | 5 | 0 |
| 18 | 227136 | 3.91 | 150.88GB | 4.19 | 236942 | 0 | 0 | 6 | 0 |
| 19 | 226633 | 3.90 | 144.69GB | 4.02 | 241343 | 0 | 0 | 11 | 0 |
| 20 | 241623 | 4.16 | 150.52GB | 4.18 | 258127 | 0 | 0 | 15 | 0 |
| 21 | 232560 | 4.00 | 146.41GB | 4.07 | 249744 | 0 | 0 | 15 | 0 |
| 22 | 229143 | 3.94 | 147.90GB | 4.11 | 244294 | 0 | 0 | 13 | 0 |
| 23 | 232601 | 4.00 | 152.76GB | 4.25 | 247119 | 0 | 0 | 21 | 0 |
| Total | 5813690 | 100.00 | 3.51TB | 100.00 | 6437086 | 0 | 0 | 645 | 0 |
 |
| Outgoing Feed (+ Top1000 #) | Accepted | %Acc | %Tot | Art/sec | Volume | %Vol | KB/art | Dups | Rejs | % Ratio (Out/In) | ||
|---|---|---|---|---|---|---|---|---|---|---|---|---|
| 1 | 217.73.144.40 | 0 | 0.00 | 0.00 | 0.00 | 0.00KB | 0.00 | 0.00 | 6014432 | 0 | … | |
| Total | 0 | 0.00 | 0.00 | 0.00 | 0.00KB | 0.00 | 0.00 | 6014432 | 0 | |||
 |
| Outgoing Feed (+ Top1000 #) | Volume | %Vol | Kbps | Accepted | %Acc | %Tot | KB/art | Dups | Rejs | % Ratio (Out/In) | ||
|---|---|---|---|---|---|---|---|---|---|---|---|---|
| 1 | 217.73.144.40 | 0.00KB | 0.00 | 0.00 | 0 | 0.00 | 0.00 | 0.00 | 6014432 | 0 | … | |
| Total | 0.00KB | 0.00 | 0.00 | 0 | 0.00 | 0.00 | 0.00 | 6014432 | 0 | |||
 |
| Outgoing Feed (+ Top1000 #) | Rej. Vol. | %Vol | Kbps | Accepted | %Acc | %Tot | KB/art | Dups | Rejs | % Ratio (Out/In) | ||
|---|---|---|---|---|---|---|---|---|---|---|---|---|
| 1 | 217.73.144.40 | 0.00KB | 0.00 | 0.00 | 0 | 0.00 | 0.00 | 0.00 | 6014432 | 0 | … | |
| Total | 0.00KB | 0.00 | 0.00 | 0 | 0.00 | 0.00 | 0.00 | 6014432 | 0 | |||
 |
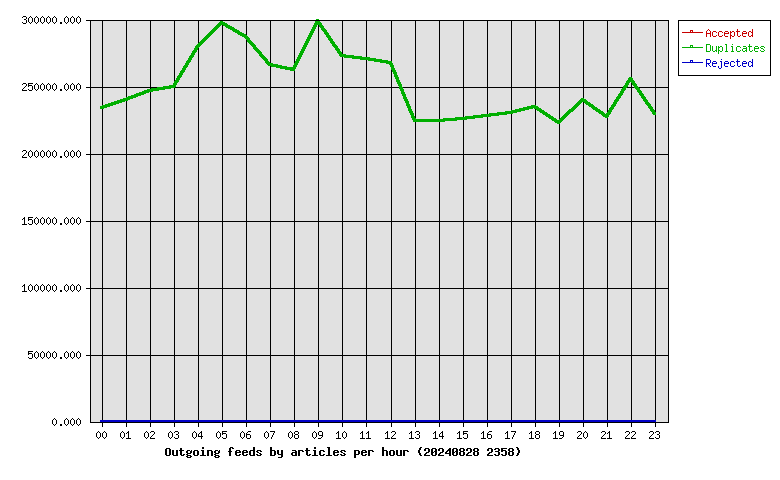
| Hour | Accepted | %Acc | Volume | %Vol | dups | Rejs |
|---|---|---|---|---|---|---|
| 00 | 0 | 0.00 | 0.00KB | 0.00 | 234275 | 0 |
| 01 | 0 | 0.00 | 0.00KB | 0.00 | 240297 | 0 |
| 02 | 0 | 0.00 | 0.00KB | 0.00 | 246976 | 0 |
| 03 | 0 | 0.00 | 0.00KB | 0.00 | 249760 | 0 |
| 04 | 0 | 0.00 | 0.00KB | 0.00 | 279644 | 0 |
| 05 | 0 | 0.00 | 0.00KB | 0.00 | 297266 | 0 |
| 06 | 0 | 0.00 | 0.00KB | 0.00 | 286688 | 0 |
| 07 | 0 | 0.00 | 0.00KB | 0.00 | 266129 | 0 |
| 08 | 0 | 0.00 | 0.00KB | 0.00 | 262644 | 0 |
| 09 | 0 | 0.00 | 0.00KB | 0.00 | 298650 | 0 |
| 10 | 0 | 0.00 | 0.00KB | 0.00 | 272716 | 0 |
| 11 | 0 | 0.00 | 0.00KB | 0.00 | 270507 | 0 |
| 12 | 0 | 0.00 | 0.00KB | 0.00 | 267323 | 0 |
| 13 | 0 | 0.00 | 0.00KB | 0.00 | 224112 | 0 |
| 14 | 0 | 0.00 | 0.00KB | 0.00 | 224088 | 0 |
| 15 | 0 | 0.00 | 0.00KB | 0.00 | 225626 | 0 |
| 16 | 0 | 0.00 | 0.00KB | 0.00 | 228143 | 0 |
| 17 | 0 | 0.00 | 0.00KB | 0.00 | 230215 | 0 |
| 18 | 0 | 0.00 | 0.00KB | 0.00 | 234777 | 0 |
| 19 | 0 | 0.00 | 0.00KB | 0.00 | 222840 | 0 |
| 20 | 0 | 0.00 | 0.00KB | 0.00 | 239764 | 0 |
| 21 | 0 | 0.00 | 0.00KB | 0.00 | 227133 | 0 |
| 22 | 0 | 0.00 | 0.00KB | 0.00 | 255631 | 0 |
| 23 | 0 | 0.00 | 0.00KB | 0.00 | 229228 | 0 |
| Total | 0 | 0.00 | 0.00KB | 0.00 | 6014432 | 0 |
 |
| >= 20% Full | >= 35% Full | >= 50% Full | >= 65% Full | >= 80% Full | >= 95% Full |
| Outgoing Feed | Batch Seq | Batch Num | Batch Max | %Full | Av. Pending |
|---|---|---|---|---|---|
| nbr.elbracht.net-o | 982015-982096 | 81 | 500 | 16 | 0.0 |
| text-spool-out | 0-0 | 0 | 500 | 0 | 0.0 |
| 1st Time | Last Time | # Msgs | Message |
|---|