| |
DIABLO statistics for newsfeed.yoursite.com on Mon 26 Aug 2024 |
Generated on 20240826 2358 by feeder-stats v4.006. Copyright © 2002 The Diablo Project.
Diablo running processes:  81    Dnewslink running processes:  0


11:59PM  up 190 days,  7:18, 0 users, load averages: 1.69, 0.87, 0.73

Filesystem     Size    Used   Avail Capacity  Mounted on
/dev/da0s1g     94G    1.2G     85G     1%    /news
/dev/da1       7.3T    5.7T    1.0T    85%    /news2/spool/news/00
/dev/da2       7.3T    5.7T    1.0T    85%    /news2/spool/news/01
/dev/da3       3.7T    3.3T     65G    98%    /news2/spool/news/02
/dev/da4       5.5T    2.9T    2.2T    57%    /news2/spool/news/03
/dev/da8       7.3T    5.7T    1.0T    85%    /news2/spool/news/04
/dev/da9       7.3T    5.7T    1.0T    85%    /news2/spool/news/05
/dev/da10      7.3T    5.7T    1.0T    85%    /news2/spool/news/06
/dev/da11      5.5T      5T     67G    99%    /news2/spool/news/07
/dev/da12      5.5T    4.2T    808G    84%    /news2/spool/news/08
/dev/da13      7.3T    5.7T    1.0T    85%    /news2/spool/news/09
/dev/da14      7.3T    5.7T    1.0T    85%    /news2/spool/news/10
/dev/da15      7.3T    5.7T    1.0T    85%    /news2/spool/news/11
/dev/da16      7.3T    5.7T    1.0T    85%    /news2/spool/news/12
/dev/da17      7.3T    5.7T    1.0T    85%    /news2/spool/news/13
/dev/da18      7.3T    5.7T    1.0T    85%    /news2/spool/news/14
/dev/da19      7.3T    5.7T    1.0T    85%    /news2/spool/news/15
/dev/da20      7.3T    5.7T    1.0T    85%    /news2/spool/news/16
/dev/da21      7.3T    5.7T    1.0T    85%    /news2/spool/news/17
/dev/da22      7.3T    5.7T    1.0T    85%    /news2/spool/news/18
/dev/da23      7.3T    5.7T    1.0T    85%    /news2/spool/news/19
/dev/da24      7.3T    5.7T    1.0T    85%    /news2/spool/news/20
/dev/da25      7.3T    5.7T    1.0T    85%    /news2/spool/news/21
/dev/da26      7.3T    5.7T    1.0T    85%    /news2/spool/news/22
/dev/da5       221G     34G    169G    17%    /news1
/dev/md0        40G     12G     23G    36%    /news3
| Incoming Feed (+ Top1000 #) | Accepted | %Acc | %Tot | Art/sec | Volume | %Vol | KB/art | Check | Ihave | Spam | TooOld | Rejs | Errs | ||
|---|---|---|---|---|---|---|---|---|---|---|---|---|---|---|---|
| 1 | feeder.ecngs.de | 5529315 | 91.33 | 92.03 | 64.00 | 3.66TB | 99.91 | 709.94 | 6054124 | 0 | 0 | 0 | 350 | 0 | |
| 2 | feeder2.ecngs.de | 478836 | 88.51 | 7.97 | 5.54 | 3.37GB | 0.09 | 7.39 | 540569 | 0 | 0 | 0 | 438 | 0 | |
| Total | 6008151 | 0.00 | 100.00 | 69.54 | 3.66TB | 100.00 | 653.94 | 6594693 | 0 | 0 | 0 | 788 | 0 | ||
 |
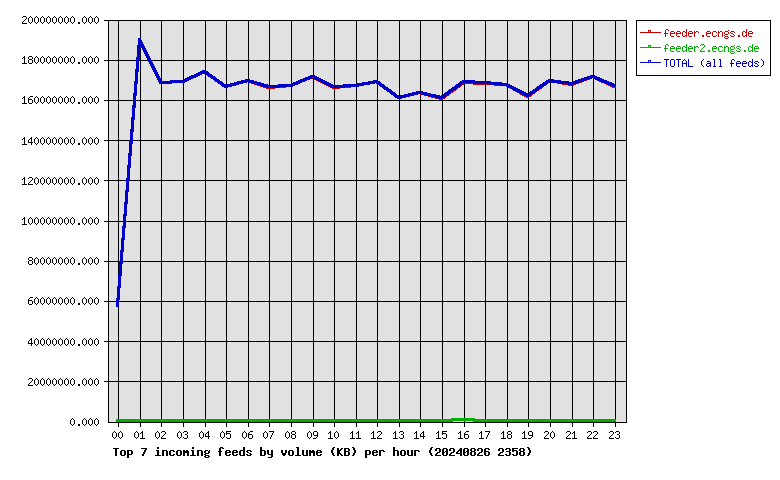
| Incoming Feed (+ Top1000 #) | Volume | %Vol | Kbps | Accepted | %Acc | %Tot | KB/art | Check | Ihave | Spam | TooOld | Rejs | Errs | ||
|---|---|---|---|---|---|---|---|---|---|---|---|---|---|---|---|
| 1 | feeder.ecngs.de | 3.66TB | 99.91 | 363468.85 | 5529315 | 91.33 | 92.03 | 709.94 | 6054124 | 0 | 0 | 0 | 350 | 0 | |
| 2 | feeder2.ecngs.de | 3.37GB | 0.09 | 327.45 | 478836 | 88.51 | 7.97 | 7.39 | 540569 | 0 | 0 | 0 | 438 | 0 | |
| Total | 3.66TB | 100.00 | 363796.31 | 6008151 | 0.00 | 100.00 | 653.94 | 6594693 | 0 | 0 | 0 | 788 | 0 | ||
 |
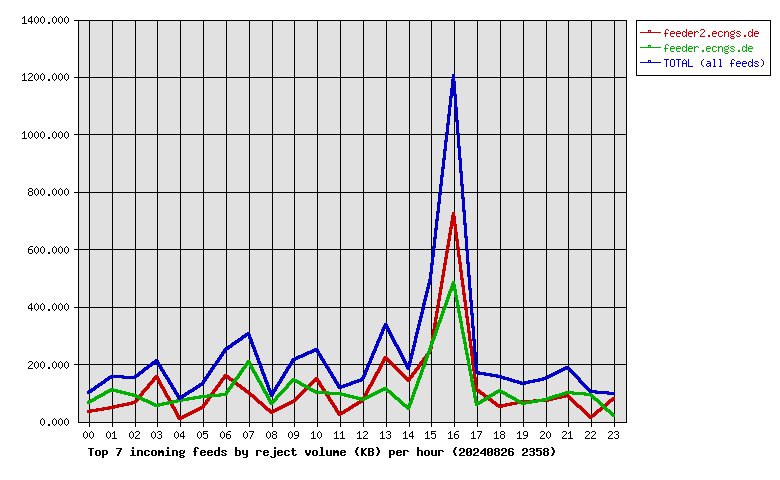
| Incoming Feed (+ Top1000 #) | Rej. Vol. | %Vol | Kbps | Accepted | %Acc | %Tot | KB/art | Check | Ihave | Spam | TooOld | Rejs | Errs | ||
|---|---|---|---|---|---|---|---|---|---|---|---|---|---|---|---|
| 1 | feeder2.ecngs.de | 2.69MB | 51.00 | 0.26 | 478836 | 88.51 | 7.97 | 7.39 | 540569 | 0 | 0 | 0 | 438 | 0 | |
| 2 | feeder.ecngs.de | 2.59MB | 49.00 | 0.25 | 5529315 | 91.33 | 92.03 | 709.94 | 6054124 | 0 | 0 | 0 | 350 | 0 | |
| Total | 5.28MB | 100.00 | 0.50 | 6008151 | 0.00 | 100.00 | 653.94 | 6594693 | 0 | 0 | 0 | 788 | 0 | ||
 |
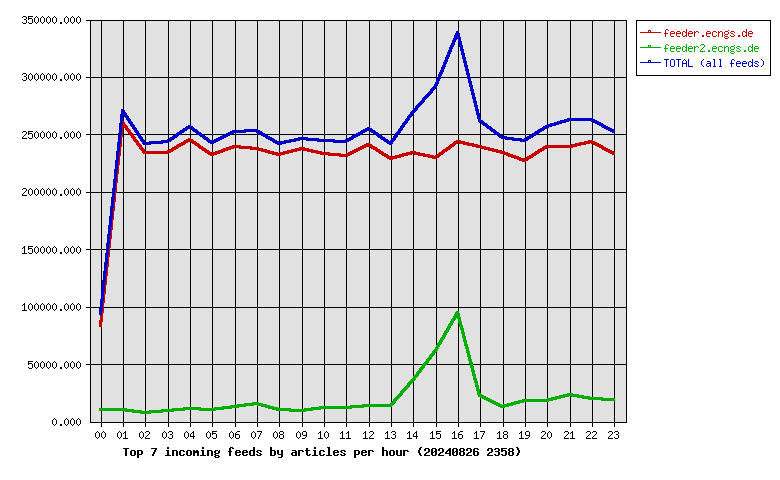
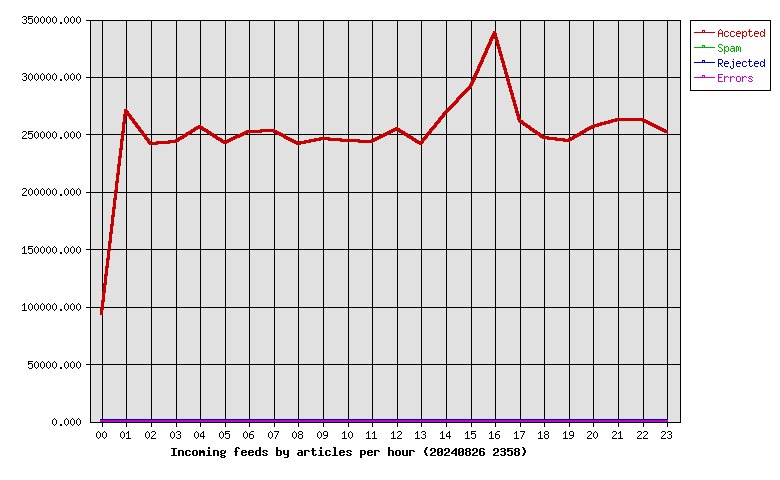
| Hour | Accepted | %Acc | Volume | %Vol | Check | Ihave | Spam | Rejs | Errs |
|---|---|---|---|---|---|---|---|---|---|
| 00 | 93272 | 1.55 | 54.81GB | 1.46 | 107366 | 0 | 0 | 16 | 0 |
| 01 | 270035 | 4.49 | 180.80GB | 4.83 | 281589 | 0 | 0 | 18 | 0 |
| 02 | 241311 | 4.02 | 160.44GB | 4.28 | 249920 | 0 | 0 | 13 | 0 |
| 03 | 243082 | 4.05 | 161.27GB | 4.30 | 252519 | 0 | 0 | 14 | 0 |
| 04 | 256072 | 4.26 | 165.68GB | 4.42 | 269707 | 0 | 0 | 13 | 0 |
| 05 | 242631 | 4.04 | 158.86GB | 4.24 | 258128 | 0 | 0 | 25 | 0 |
| 06 | 252090 | 4.20 | 161.75GB | 4.32 | 267080 | 0 | 0 | 38 | 0 |
| 07 | 252863 | 4.21 | 158.53GB | 4.23 | 271019 | 0 | 0 | 40 | 0 |
| 08 | 241713 | 4.02 | 159.15GB | 4.25 | 251672 | 0 | 0 | 12 | 0 |
| 09 | 246203 | 4.10 | 163.55GB | 4.36 | 257218 | 0 | 0 | 17 | 0 |
| 10 | 244470 | 4.07 | 158.49GB | 4.23 | 256517 | 0 | 0 | 27 | 0 |
| 11 | 243615 | 4.05 | 159.32GB | 4.25 | 258703 | 0 | 0 | 16 | 0 |
| 12 | 254491 | 4.24 | 161.18GB | 4.30 | 268233 | 0 | 0 | 19 | 0 |
| 13 | 241483 | 4.02 | 153.47GB | 4.10 | 256258 | 0 | 0 | 53 | 0 |
| 14 | 268661 | 4.47 | 156.05GB | 4.16 | 308486 | 0 | 0 | 36 | 0 |
| 15 | 291300 | 4.85 | 153.38GB | 4.09 | 363140 | 0 | 0 | 108 | 0 |
| 16 | 338103 | 5.63 | 161.24GB | 4.30 | 450247 | 0 | 0 | 189 | 0 |
| 17 | 261576 | 4.35 | 160.51GB | 4.28 | 290919 | 0 | 0 | 26 | 0 |
| 18 | 246888 | 4.11 | 159.77GB | 4.26 | 268841 | 0 | 0 | 14 | 0 |
| 19 | 244634 | 4.07 | 154.34GB | 4.12 | 267120 | 0 | 0 | 7 | 0 |
| 20 | 256734 | 4.27 | 161.75GB | 4.32 | 281858 | 0 | 0 | 12 | 0 |
| 21 | 262706 | 4.37 | 160.04GB | 4.27 | 289976 | 0 | 0 | 32 | 0 |
| 22 | 262416 | 4.37 | 163.57GB | 4.37 | 290825 | 0 | 0 | 17 | 0 |
| 23 | 251802 | 4.19 | 159.05GB | 4.24 | 277352 | 0 | 0 | 26 | 0 |
| Total | 6008151 | 100.00 | 3.66TB | 100.00 | 6594693 | 0 | 0 | 788 | 0 |
 |
| Outgoing Feed (+ Top1000 #) | Accepted | %Acc | %Tot | Art/sec | Volume | %Vol | KB/art | Dups | Rejs | % Ratio (Out/In) | ||
|---|---|---|---|---|---|---|---|---|---|---|---|---|
| 1 | 217.73.144.40 | 0 | 0.00 | 0.00 | 0.00 | 0.00KB | 0.00 | 0.00 | 5196462 | 0 | … | |
| Total | 0 | 0.00 | 0.00 | 0.00 | 0.00KB | 0.00 | 0.00 | 5196462 | 0 | |||
 |
| Outgoing Feed (+ Top1000 #) | Volume | %Vol | Kbps | Accepted | %Acc | %Tot | KB/art | Dups | Rejs | % Ratio (Out/In) | ||
|---|---|---|---|---|---|---|---|---|---|---|---|---|
| 1 | 217.73.144.40 | 0.00KB | 0.00 | 0.00 | 0 | 0.00 | 0.00 | 0.00 | 5196462 | 0 | … | |
| Total | 0.00KB | 0.00 | 0.00 | 0 | 0.00 | 0.00 | 0.00 | 5196462 | 0 | |||
 |
| Outgoing Feed (+ Top1000 #) | Rej. Vol. | %Vol | Kbps | Accepted | %Acc | %Tot | KB/art | Dups | Rejs | % Ratio (Out/In) | ||
|---|---|---|---|---|---|---|---|---|---|---|---|---|
| 1 | 217.73.144.40 | 0.00KB | 0.00 | 0.00 | 0 | 0.00 | 0.00 | 0.00 | 5196462 | 0 | … | |
| Total | 0.00KB | 0.00 | 0.00 | 0 | 0.00 | 0.00 | 0.00 | 5196462 | 0 | |||
 |
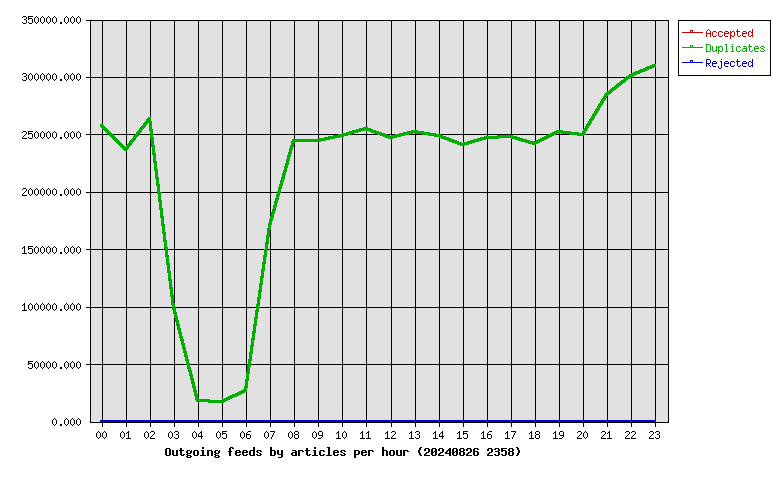
| Hour | Accepted | %Acc | Volume | %Vol | dups | Rejs |
|---|---|---|---|---|---|---|
| 00 | 0 | 0.00 | 0.00KB | 0.00 | 257104 | 0 |
| 01 | 0 | 0.00 | 0.00KB | 0.00 | 236771 | 0 |
| 02 | 0 | 0.00 | 0.00KB | 0.00 | 263643 | 0 |
| 03 | 0 | 0.00 | 0.00KB | 0.00 | 98922 | 0 |
| 04 | 0 | 0.00 | 0.00KB | 0.00 | 18013 | 0 |
| 05 | 0 | 0.00 | 0.00KB | 0.00 | 16768 | 0 |
| 06 | 0 | 0.00 | 0.00KB | 0.00 | 26760 | 0 |
| 07 | 0 | 0.00 | 0.00KB | 0.00 | 169977 | 0 |
| 08 | 0 | 0.00 | 0.00KB | 0.00 | 244126 | 0 |
| 09 | 0 | 0.00 | 0.00KB | 0.00 | 244229 | 0 |
| 10 | 0 | 0.00 | 0.00KB | 0.00 | 248316 | 0 |
| 11 | 0 | 0.00 | 0.00KB | 0.00 | 254467 | 0 |
| 12 | 0 | 0.00 | 0.00KB | 0.00 | 246733 | 0 |
| 13 | 0 | 0.00 | 0.00KB | 0.00 | 252093 | 0 |
| 14 | 0 | 0.00 | 0.00KB | 0.00 | 248217 | 0 |
| 15 | 0 | 0.00 | 0.00KB | 0.00 | 240547 | 0 |
| 16 | 0 | 0.00 | 0.00KB | 0.00 | 246707 | 0 |
| 17 | 0 | 0.00 | 0.00KB | 0.00 | 247490 | 0 |
| 18 | 0 | 0.00 | 0.00KB | 0.00 | 241177 | 0 |
| 19 | 0 | 0.00 | 0.00KB | 0.00 | 251949 | 0 |
| 20 | 0 | 0.00 | 0.00KB | 0.00 | 249035 | 0 |
| 21 | 0 | 0.00 | 0.00KB | 0.00 | 283885 | 0 |
| 22 | 0 | 0.00 | 0.00KB | 0.00 | 300432 | 0 |
| 23 | 0 | 0.00 | 0.00KB | 0.00 | 309101 | 0 |
| Total | 0 | 0.00 | 0.00KB | 0.00 | 5196462 | 0 |
 |
| >= 20% Full | >= 35% Full | >= 50% Full | >= 65% Full | >= 80% Full | >= 95% Full |
| Outgoing Feed | Batch Seq | Batch Num | Batch Max | %Full | Av. Pending |
|---|---|---|---|---|---|
| nbr.elbracht.net-o | 981439-981520 | 81 | 500 | 16 | 0.0 |
| text-spool-out | 0-0 | 0 | 500 | 0 | 0.0 |
| 1st Time | Last Time | # Msgs | Message |
|---|---|---|---|
| 18:51:46 | 1 | DNS Fwd/Rev mismatch: lookup of scanner-06.ch1.censys-scanner.com failed |