| |
DIABLO statistics for newsfeed.yoursite.com on Sun 25 Aug 2024 |
Generated on 20240825 2358 by feeder-stats v4.006. Copyright © 2002 The Diablo Project.
Diablo running processes:  81    Dnewslink running processes:  0


11:59PM  up 189 days,  7:18, 0 users, load averages: 0.96, 0.47, 0.33

Filesystem     Size    Used   Avail Capacity  Mounted on
/dev/da0s1g     94G    1.1G     85G     1%    /news
/dev/da1       7.3T    5.7T    1.0T    85%    /news2/spool/news/00
/dev/da2       7.3T    5.7T    1.0T    85%    /news2/spool/news/01
/dev/da3       3.7T    3.3T     65G    98%    /news2/spool/news/02
/dev/da4       5.5T    2.9T    2.2T    57%    /news2/spool/news/03
/dev/da8       7.3T    5.7T    1.0T    85%    /news2/spool/news/04
/dev/da9       7.3T    5.7T    1.0T    85%    /news2/spool/news/05
/dev/da10      7.3T    5.7T    1.0T    85%    /news2/spool/news/06
/dev/da11      5.5T      5T     65G    99%    /news2/spool/news/07
/dev/da12      5.5T    4.2T    815G    84%    /news2/spool/news/08
/dev/da13      7.3T    5.7T    1.0T    85%    /news2/spool/news/09
/dev/da14      7.3T    5.7T    1.0T    85%    /news2/spool/news/10
/dev/da15      7.3T    5.7T    1.0T    85%    /news2/spool/news/11
/dev/da16      7.3T    5.7T    1.0T    85%    /news2/spool/news/12
/dev/da17      7.3T    5.7T    1.0T    85%    /news2/spool/news/13
/dev/da18      7.3T    5.7T    1.0T    85%    /news2/spool/news/14
/dev/da19      7.3T    5.7T    1.0T    85%    /news2/spool/news/15
/dev/da20      7.3T    5.7T    1.0T    85%    /news2/spool/news/16
/dev/da21      7.3T    5.7T    1.0T    85%    /news2/spool/news/17
/dev/da22      7.3T    5.7T    1.0T    85%    /news2/spool/news/18
/dev/da23      7.3T    5.7T    1.0T    85%    /news2/spool/news/19
/dev/da24      7.3T    5.7T    1.0T    85%    /news2/spool/news/20
/dev/da25      7.3T    5.7T    1.0T    85%    /news2/spool/news/21
/dev/da26      7.3T    5.7T    1.0T    85%    /news2/spool/news/22
/dev/da5       221G     34G    169G    17%    /news1
/dev/md0        40G     12G     23G    36%    /news3
| Incoming Feed (+ Top1000 #) | Accepted | %Acc | %Tot | Art/sec | Volume | %Vol | KB/art | Check | Ihave | Spam | TooOld | Rejs | Errs | ||
|---|---|---|---|---|---|---|---|---|---|---|---|---|---|---|---|
| 1 | feeder.ecngs.de | 4667859 | 92.39 | 92.91 | 54.03 | 3.10TB | 99.91 | 712.36 | 5052144 | 0 | 0 | 0 | 234 | 0 | |
| 2 | feeder2.ecngs.de | 356383 | 89.91 | 7.09 | 4.14 | 2.75GB | 0.09 | 8.09 | 396105 | 0 | 0 | 0 | 255 | 0 | |
| Total | 5024242 | 0.00 | 100.00 | 58.16 | 3.10TB | 100.00 | 662.40 | 5448249 | 0 | 0 | 0 | 489 | 0 | ||
 |
| Incoming Feed (+ Top1000 #) | Volume | %Vol | Kbps | Accepted | %Acc | %Tot | KB/art | Check | Ihave | Spam | TooOld | Rejs | Errs | ||
|---|---|---|---|---|---|---|---|---|---|---|---|---|---|---|---|
| 1 | feeder.ecngs.de | 3.10TB | 99.91 | 307887.45 | 4667859 | 92.39 | 92.91 | 712.36 | 5052144 | 0 | 0 | 0 | 234 | 0 | |
| 2 | feeder2.ecngs.de | 2.75GB | 0.09 | 267.87 | 356383 | 89.91 | 7.09 | 8.09 | 396105 | 0 | 0 | 0 | 255 | 0 | |
| Total | 3.10TB | 100.00 | 308155.32 | 5024242 | 0.00 | 100.00 | 662.40 | 5448249 | 0 | 0 | 0 | 489 | 0 | ||
 |
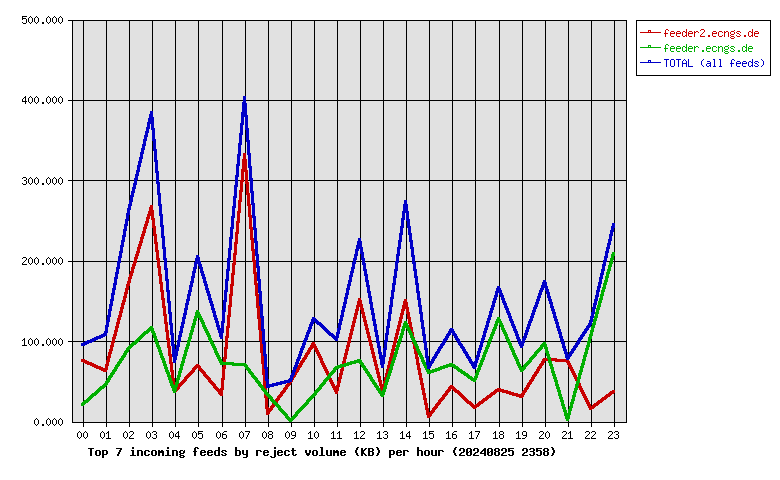
| Incoming Feed (+ Top1000 #) | Rej. Vol. | %Vol | Kbps | Accepted | %Acc | %Tot | KB/art | Check | Ihave | Spam | TooOld | Rejs | Errs | ||
|---|---|---|---|---|---|---|---|---|---|---|---|---|---|---|---|
| 1 | feeder2.ecngs.de | 1.87MB | 52.48 | 0.18 | 356383 | 89.91 | 7.09 | 8.09 | 396105 | 0 | 0 | 0 | 255 | 0 | |
| 2 | feeder.ecngs.de | 1.69MB | 47.52 | 0.16 | 4667859 | 92.39 | 92.91 | 712.36 | 5052144 | 0 | 0 | 0 | 234 | 0 | |
| Total | 3.56MB | 100.00 | 0.34 | 5024242 | 0.00 | 100.00 | 662.40 | 5448249 | 0 | 0 | 0 | 489 | 0 | ||
 |
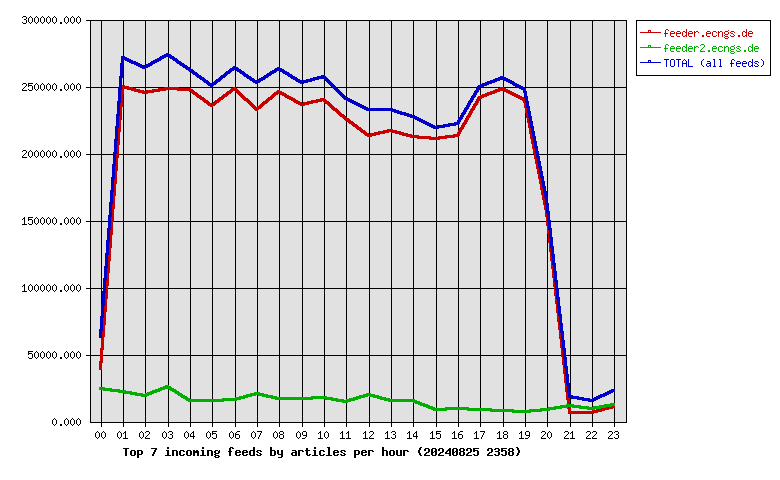
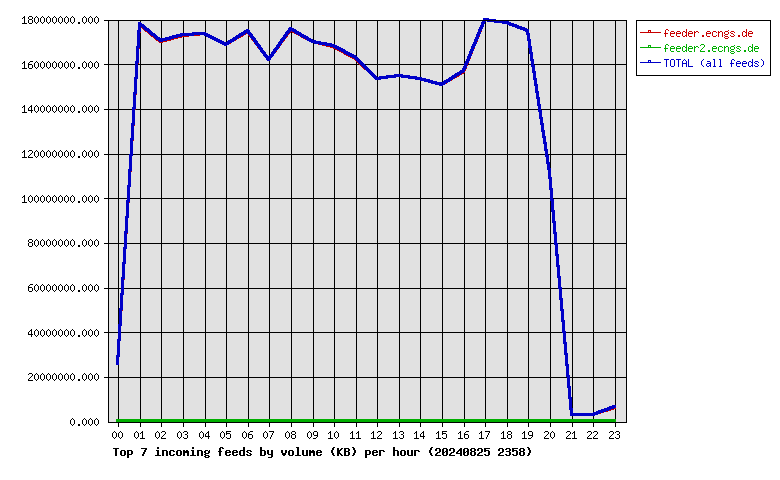
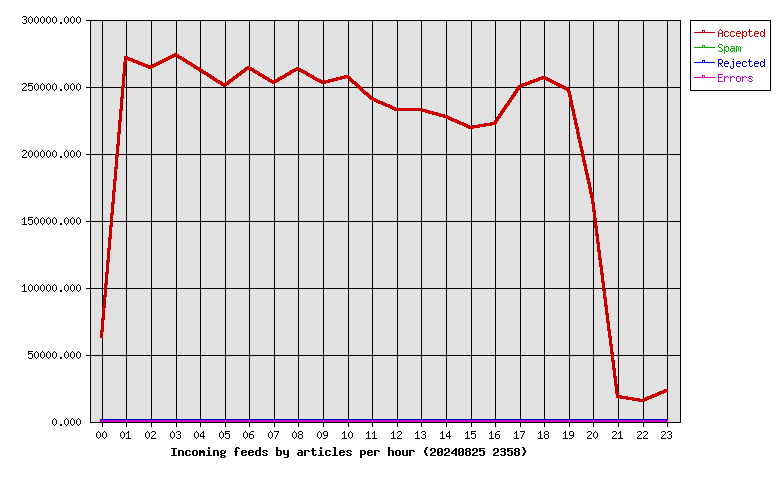
| Hour | Accepted | %Acc | Volume | %Vol | Check | Ihave | Spam | Rejs | Errs |
|---|---|---|---|---|---|---|---|---|---|
| 00 | 63088 | 1.26 | 24.58GB | 0.77 | 93845 | 0 | 0 | 17 | 0 |
| 01 | 271139 | 5.40 | 169.68GB | 5.35 | 297582 | 0 | 0 | 16 | 0 |
| 02 | 263595 | 5.25 | 162.29GB | 5.11 | 286281 | 0 | 0 | 29 | 0 |
| 03 | 273468 | 5.44 | 164.95GB | 5.20 | 302677 | 0 | 0 | 47 | 0 |
| 04 | 262435 | 5.22 | 165.54GB | 5.22 | 280954 | 0 | 0 | 14 | 0 |
| 05 | 250588 | 4.99 | 160.89GB | 5.07 | 271437 | 0 | 0 | 29 | 0 |
| 06 | 263960 | 5.25 | 166.59GB | 5.25 | 282409 | 0 | 0 | 33 | 0 |
| 07 | 252540 | 5.03 | 154.41GB | 4.86 | 276540 | 0 | 0 | 45 | 0 |
| 08 | 262842 | 5.23 | 167.39GB | 5.27 | 283540 | 0 | 0 | 13 | 0 |
| 09 | 252599 | 5.03 | 161.97GB | 5.10 | 271439 | 0 | 0 | 7 | 0 |
| 10 | 257289 | 5.12 | 160.22GB | 5.05 | 277759 | 0 | 0 | 23 | 0 |
| 11 | 240606 | 4.79 | 155.03GB | 4.88 | 258823 | 0 | 0 | 21 | 0 |
| 12 | 232742 | 4.63 | 146.42GB | 4.61 | 253780 | 0 | 0 | 46 | 0 |
| 13 | 232716 | 4.63 | 147.71GB | 4.65 | 252784 | 0 | 0 | 11 | 0 |
| 14 | 227441 | 4.53 | 146.39GB | 4.61 | 244408 | 0 | 0 | 31 | 0 |
| 15 | 219231 | 4.36 | 143.65GB | 4.53 | 230084 | 0 | 0 | 3 | 0 |
| 16 | 222279 | 4.42 | 149.54GB | 4.71 | 234046 | 0 | 0 | 14 | 0 |
| 17 | 249936 | 4.97 | 171.51GB | 5.40 | 259785 | 0 | 0 | 9 | 0 |
| 18 | 256223 | 5.10 | 170.32GB | 5.37 | 265450 | 0 | 0 | 14 | 0 |
| 19 | 247306 | 4.92 | 166.83GB | 5.26 | 255891 | 0 | 0 | 9 | 0 |
| 20 | 165268 | 3.29 | 106.16GB | 3.34 | 175108 | 0 | 0 | 14 | 0 |
| 21 | 18484 | 0.37 | 2.81GB | 0.09 | 32260 | 0 | 0 | 14 | 0 |
| 22 | 15499 | 0.31 | 2.99GB | 0.09 | 25394 | 0 | 0 | 7 | 0 |
| 23 | 22968 | 0.46 | 6.05GB | 0.19 | 35973 | 0 | 0 | 23 | 0 |
| Total | 5024242 | 100.00 | 3.10TB | 100.00 | 5448249 | 0 | 0 | 489 | 0 |
 |
| Outgoing Feed (+ Top1000 #) | Accepted | %Acc | %Tot | Art/sec | Volume | %Vol | KB/art | Dups | Rejs | % Ratio (Out/In) | ||
|---|---|---|---|---|---|---|---|---|---|---|---|---|
| 1 | 217.73.144.40 | 0 | 0.00 | 0.00 | 0.00 | 0.00KB | 0.00 | 0.00 | 4397047 | 0 | … | |
| Total | 0 | 0.00 | 0.00 | 0.00 | 0.00KB | 0.00 | 0.00 | 4397047 | 0 | |||
 |
| Outgoing Feed (+ Top1000 #) | Volume | %Vol | Kbps | Accepted | %Acc | %Tot | KB/art | Dups | Rejs | % Ratio (Out/In) | ||
|---|---|---|---|---|---|---|---|---|---|---|---|---|
| 1 | 217.73.144.40 | 0.00KB | 0.00 | 0.00 | 0 | 0.00 | 0.00 | 0.00 | 4397047 | 0 | … | |
| Total | 0.00KB | 0.00 | 0.00 | 0 | 0.00 | 0.00 | 0.00 | 4397047 | 0 | |||
 |
| Outgoing Feed (+ Top1000 #) | Rej. Vol. | %Vol | Kbps | Accepted | %Acc | %Tot | KB/art | Dups | Rejs | % Ratio (Out/In) | ||
|---|---|---|---|---|---|---|---|---|---|---|---|---|
| 1 | 217.73.144.40 | 0.00KB | 0.00 | 0.00 | 0 | 0.00 | 0.00 | 0.00 | 4397047 | 0 | … | |
| Total | 0.00KB | 0.00 | 0.00 | 0 | 0.00 | 0.00 | 0.00 | 4397047 | 0 | |||
 |
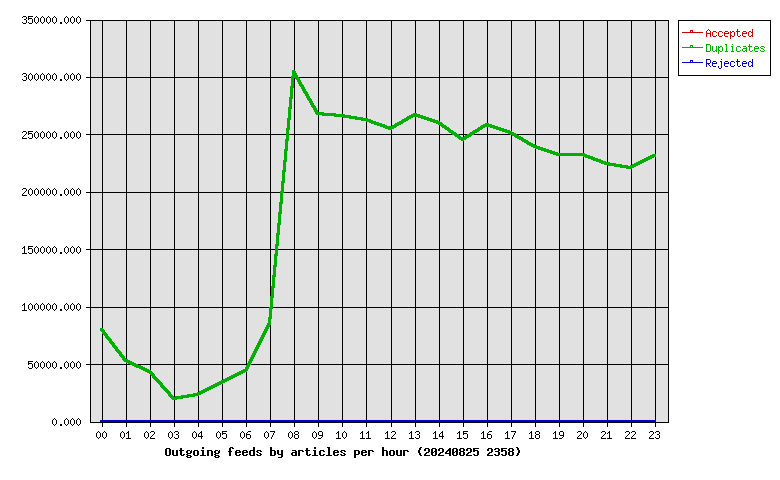
| Hour | Accepted | %Acc | Volume | %Vol | dups | Rejs |
|---|---|---|---|---|---|---|
| 00 | 0 | 0.00 | 0.00KB | 0.00 | 79313 | 0 |
| 01 | 0 | 0.00 | 0.00KB | 0.00 | 52240 | 0 |
| 02 | 0 | 0.00 | 0.00KB | 0.00 | 43521 | 0 |
| 03 | 0 | 0.00 | 0.00KB | 0.00 | 19617 | 0 |
| 04 | 0 | 0.00 | 0.00KB | 0.00 | 23283 | 0 |
| 05 | 0 | 0.00 | 0.00KB | 0.00 | 33906 | 0 |
| 06 | 0 | 0.00 | 0.00KB | 0.00 | 44244 | 0 |
| 07 | 0 | 0.00 | 0.00KB | 0.00 | 85079 | 0 |
| 08 | 0 | 0.00 | 0.00KB | 0.00 | 304382 | 0 |
| 09 | 0 | 0.00 | 0.00KB | 0.00 | 267972 | 0 |
| 10 | 0 | 0.00 | 0.00KB | 0.00 | 265668 | 0 |
| 11 | 0 | 0.00 | 0.00KB | 0.00 | 262202 | 0 |
| 12 | 0 | 0.00 | 0.00KB | 0.00 | 254885 | 0 |
| 13 | 0 | 0.00 | 0.00KB | 0.00 | 266951 | 0 |
| 14 | 0 | 0.00 | 0.00KB | 0.00 | 260217 | 0 |
| 15 | 0 | 0.00 | 0.00KB | 0.00 | 245324 | 0 |
| 16 | 0 | 0.00 | 0.00KB | 0.00 | 257816 | 0 |
| 17 | 0 | 0.00 | 0.00KB | 0.00 | 251593 | 0 |
| 18 | 0 | 0.00 | 0.00KB | 0.00 | 238983 | 0 |
| 19 | 0 | 0.00 | 0.00KB | 0.00 | 231700 | 0 |
| 20 | 0 | 0.00 | 0.00KB | 0.00 | 232024 | 0 |
| 21 | 0 | 0.00 | 0.00KB | 0.00 | 223828 | 0 |
| 22 | 0 | 0.00 | 0.00KB | 0.00 | 220926 | 0 |
| 23 | 0 | 0.00 | 0.00KB | 0.00 | 231373 | 0 |
| Total | 0 | 0.00 | 0.00KB | 0.00 | 4397047 | 0 |
 |
| >= 20% Full | >= 35% Full | >= 50% Full | >= 65% Full | >= 80% Full | >= 95% Full |
| Outgoing Feed | Batch Seq | Batch Num | Batch Max | %Full | Av. Pending |
|---|---|---|---|---|---|
| nbr.elbracht.net-o | 981151-981232 | 81 | 500 | 16 | 0.0 |
| text-spool-out | 0-0 | 0 | 500 | 0 | 0.0 |
| 1st Time | Last Time | # Msgs | Message |
|---|