| |
DIABLO statistics for newsfeed.yoursite.com on Sat 24 Aug 2024 |
Generated on 20240824 2358 by feeder-stats v4.006. Copyright © 2002 The Diablo Project.
Diablo running processes:  81    Dnewslink running processes:  0


11:59PM  up 188 days,  7:18, 0 users, load averages: 1.88, 1.36, 1.23

Filesystem     Size    Used   Avail Capacity  Mounted on
/dev/da0s1g     94G    1.1G     85G     1%    /news
/dev/da1       7.3T    5.7T      1T    85%    /news2/spool/news/00
/dev/da2       7.3T    5.7T      1T    85%    /news2/spool/news/01
/dev/da3       3.7T    3.3T     65G    98%    /news2/spool/news/02
/dev/da4       5.5T    2.9T    2.2T    57%    /news2/spool/news/03
/dev/da8       7.3T    5.7T      1T    85%    /news2/spool/news/04
/dev/da9       7.3T    5.7T      1T    85%    /news2/spool/news/05
/dev/da10      7.3T    5.7T      1T    85%    /news2/spool/news/06
/dev/da11      5.5T      5T     71G    99%    /news2/spool/news/07
/dev/da12      5.5T    4.2T    795G    85%    /news2/spool/news/08
/dev/da13      7.3T    5.7T      1T    85%    /news2/spool/news/09
/dev/da14      7.3T    5.7T      1T    85%    /news2/spool/news/10
/dev/da15      7.3T    5.7T      1T    85%    /news2/spool/news/11
/dev/da16      7.3T    5.7T      1T    85%    /news2/spool/news/12
/dev/da17      7.3T    5.7T      1T    85%    /news2/spool/news/13
/dev/da18      7.3T    5.7T    1.0T    85%    /news2/spool/news/14
/dev/da19      7.3T    5.7T      1T    85%    /news2/spool/news/15
/dev/da20      7.3T    5.7T      1T    85%    /news2/spool/news/16
/dev/da21      7.3T    5.7T      1T    85%    /news2/spool/news/17
/dev/da22      7.3T    5.7T      1T    85%    /news2/spool/news/18
/dev/da23      7.3T    5.7T      1T    85%    /news2/spool/news/19
/dev/da24      7.3T    5.7T      1T    85%    /news2/spool/news/20
/dev/da25      7.3T    5.7T      1T    85%    /news2/spool/news/21
/dev/da26      7.3T    5.7T      1T    85%    /news2/spool/news/22
/dev/da5       221G     34G    169G    17%    /news1
/dev/md0        40G     13G     23G    36%    /news3
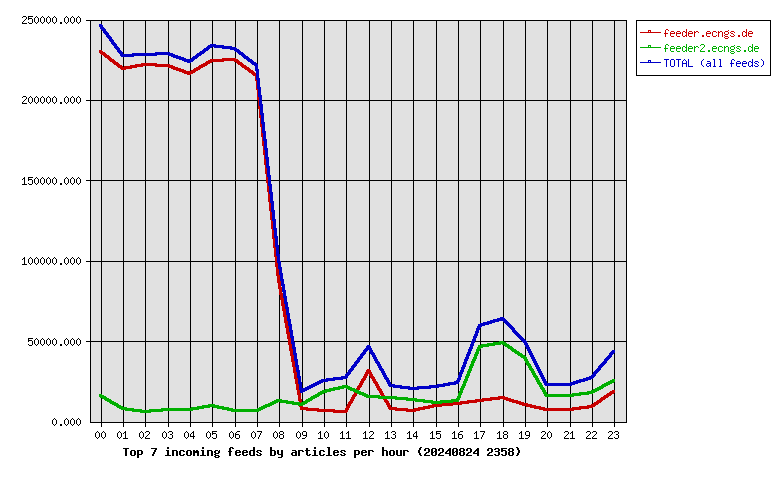
| Incoming Feed (+ Top1000 #) | Accepted | %Acc | %Tot | Art/sec | Volume | %Vol | KB/art | Check | Ihave | Spam | TooOld | Rejs | Errs | ||
|---|---|---|---|---|---|---|---|---|---|---|---|---|---|---|---|
| 1 | feeder.ecngs.de | 2027144 | 82.43 | 83.35 | 23.46 | 1.33TB | 99.74 | 705.75 | 2458839 | 0 | 0 | 0 | 267 | 0 | |
| 2 | feeder2.ecngs.de | 405088 | 89.17 | 16.65 | 4.69 | 3.52GB | 0.26 | 9.11 | 454049 | 0 | 0 | 0 | 250 | 0 | |
| Total | 2432232 | 0.00 | 100.00 | 28.15 | 1.34TB | 100.00 | 589.73 | 2912888 | 0 | 0 | 0 | 517 | 0 | ||
 |
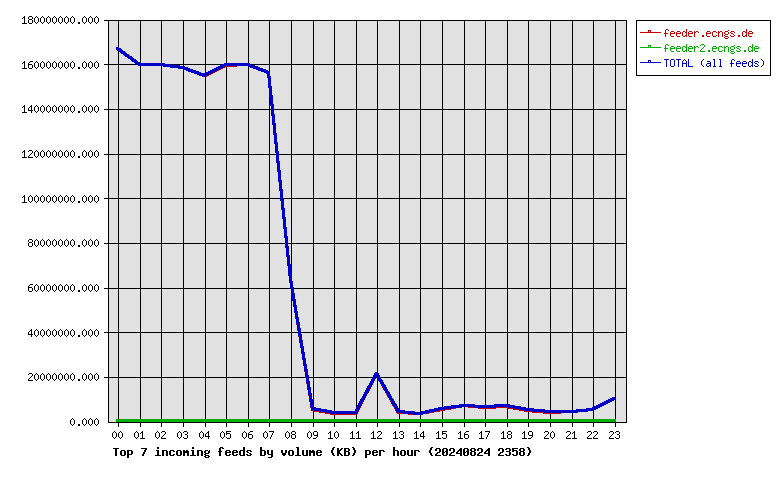
| Incoming Feed (+ Top1000 #) | Volume | %Vol | Kbps | Accepted | %Acc | %Tot | KB/art | Check | Ihave | Spam | TooOld | Rejs | Errs | ||
|---|---|---|---|---|---|---|---|---|---|---|---|---|---|---|---|
| 1 | feeder.ecngs.de | 1.33TB | 99.74 | 132469.08 | 2027144 | 82.43 | 83.35 | 705.75 | 2458839 | 0 | 0 | 0 | 267 | 0 | |
| 2 | feeder2.ecngs.de | 3.52GB | 0.26 | 341.63 | 405088 | 89.17 | 16.65 | 9.11 | 454049 | 0 | 0 | 0 | 250 | 0 | |
| Total | 1.34TB | 100.00 | 132810.71 | 2432232 | 0.00 | 100.00 | 589.73 | 2912888 | 0 | 0 | 0 | 517 | 0 | ||
 |
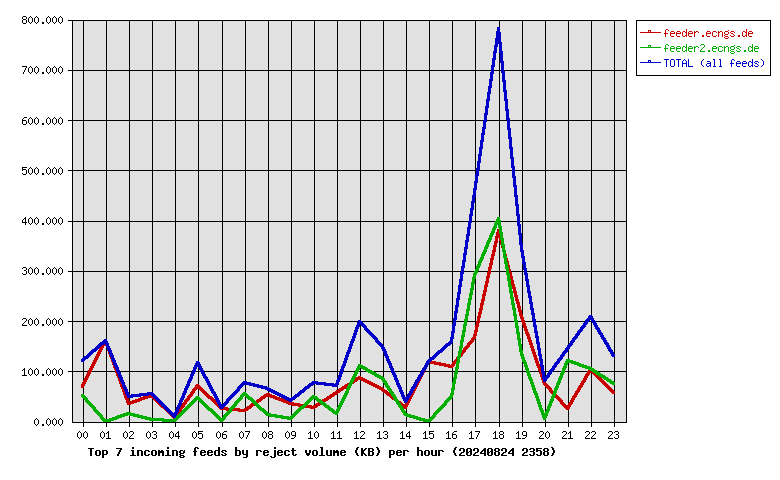
| Incoming Feed (+ Top1000 #) | Rej. Vol. | %Vol | Kbps | Accepted | %Acc | %Tot | KB/art | Check | Ihave | Spam | TooOld | Rejs | Errs | ||
|---|---|---|---|---|---|---|---|---|---|---|---|---|---|---|---|
| 1 | feeder.ecngs.de | 1.98MB | 55.14 | 0.19 | 2027144 | 82.43 | 83.35 | 705.75 | 2458839 | 0 | 0 | 0 | 267 | 0 | |
| 2 | feeder2.ecngs.de | 1.61MB | 44.86 | 0.15 | 405088 | 89.17 | 16.65 | 9.11 | 454049 | 0 | 0 | 0 | 250 | 0 | |
| Total | 3.59MB | 100.00 | 0.34 | 2432232 | 0.00 | 100.00 | 589.73 | 2912888 | 0 | 0 | 0 | 517 | 0 | ||
 |
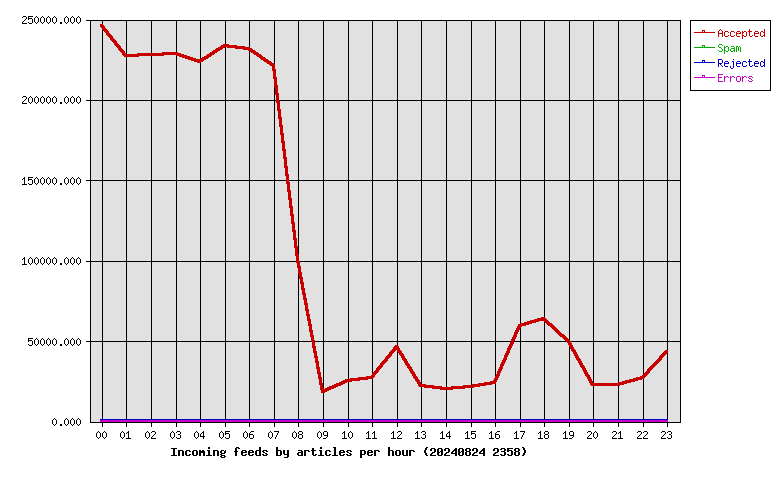
| Hour | Accepted | %Acc | Volume | %Vol | Check | Ihave | Spam | Rejs | Errs |
|---|---|---|---|---|---|---|---|---|---|
| 00 | 245852 | 10.11 | 159.18GB | 11.64 | 264101 | 0 | 0 | 18 | 0 |
| 01 | 227392 | 9.35 | 152.35GB | 11.14 | 236069 | 0 | 0 | 9 | 0 |
| 02 | 227617 | 9.36 | 152.10GB | 11.12 | 234748 | 0 | 0 | 7 | 0 |
| 03 | 228475 | 9.39 | 150.88GB | 11.03 | 236759 | 0 | 0 | 7 | 0 |
| 04 | 223293 | 9.18 | 147.67GB | 10.80 | 231080 | 0 | 0 | 3 | 0 |
| 05 | 233370 | 9.59 | 152.05GB | 11.12 | 244674 | 0 | 0 | 15 | 0 |
| 06 | 231384 | 9.51 | 152.32GB | 11.13 | 238965 | 0 | 0 | 4 | 0 |
| 07 | 221353 | 9.10 | 148.91GB | 10.89 | 228776 | 0 | 0 | 6 | 0 |
| 08 | 100723 | 4.14 | 60.33GB | 4.41 | 115011 | 0 | 0 | 12 | 0 |
| 09 | 18197 | 0.75 | 5.15GB | 0.38 | 29076 | 0 | 0 | 3 | 0 |
| 10 | 25390 | 1.04 | 3.50GB | 0.26 | 43389 | 0 | 0 | 9 | 0 |
| 11 | 27325 | 1.12 | 3.46GB | 0.25 | 52225 | 0 | 0 | 11 | 0 |
| 12 | 46524 | 1.91 | 20.35GB | 1.49 | 63884 | 0 | 0 | 16 | 0 |
| 13 | 22145 | 0.91 | 3.93GB | 0.29 | 38293 | 0 | 0 | 13 | 0 |
| 14 | 20007 | 0.82 | 3.41GB | 0.25 | 35439 | 0 | 0 | 11 | 0 |
| 15 | 21154 | 0.87 | 5.20GB | 0.38 | 33386 | 0 | 0 | 7 | 0 |
| 16 | 23711 | 0.97 | 6.72GB | 0.49 | 38153 | 0 | 0 | 25 | 0 |
| 17 | 59470 | 2.45 | 6.06GB | 0.44 | 111503 | 0 | 0 | 108 | 0 |
| 18 | 63649 | 2.62 | 6.62GB | 0.48 | 126177 | 0 | 0 | 109 | 0 |
| 19 | 49692 | 2.04 | 4.75GB | 0.35 | 99803 | 0 | 0 | 53 | 0 |
| 20 | 22646 | 0.93 | 3.97GB | 0.29 | 44866 | 0 | 0 | 12 | 0 |
| 21 | 22968 | 0.94 | 4.27GB | 0.31 | 44572 | 0 | 0 | 13 | 0 |
| 22 | 26786 | 1.10 | 5.11GB | 0.37 | 47587 | 0 | 0 | 24 | 0 |
| 23 | 43109 | 1.77 | 9.63GB | 0.70 | 74352 | 0 | 0 | 22 | 0 |
| Total | 2432232 | 100.00 | 1.34TB | 100.00 | 2912888 | 0 | 0 | 517 | 0 |
 |
| Outgoing Feed (+ Top1000 #) | Accepted | %Acc | %Tot | Art/sec | Volume | %Vol | KB/art | Dups | Rejs | % Ratio (Out/In) | ||
|---|---|---|---|---|---|---|---|---|---|---|---|---|
| 1 | 217.73.144.40 | 0 | 0.00 | 0.00 | 0.00 | 0.00KB | 0.00 | 0.00 | 3805268 | 0 | … | |
| Total | 0 | 0.00 | 0.00 | 0.00 | 0.00KB | 0.00 | 0.00 | 3805268 | 0 | |||
 |
| Outgoing Feed (+ Top1000 #) | Volume | %Vol | Kbps | Accepted | %Acc | %Tot | KB/art | Dups | Rejs | % Ratio (Out/In) | ||
|---|---|---|---|---|---|---|---|---|---|---|---|---|
| 1 | 217.73.144.40 | 0.00KB | 0.00 | 0.00 | 0 | 0.00 | 0.00 | 0.00 | 3805268 | 0 | … | |
| Total | 0.00KB | 0.00 | 0.00 | 0 | 0.00 | 0.00 | 0.00 | 3805268 | 0 | |||
 |
| Outgoing Feed (+ Top1000 #) | Rej. Vol. | %Vol | Kbps | Accepted | %Acc | %Tot | KB/art | Dups | Rejs | % Ratio (Out/In) | ||
|---|---|---|---|---|---|---|---|---|---|---|---|---|
| 1 | 217.73.144.40 | 0.00KB | 0.00 | 0.00 | 0 | 0.00 | 0.00 | 0.00 | 3805268 | 0 | … | |
| Total | 0.00KB | 0.00 | 0.00 | 0 | 0.00 | 0.00 | 0.00 | 3805268 | 0 | |||
 |
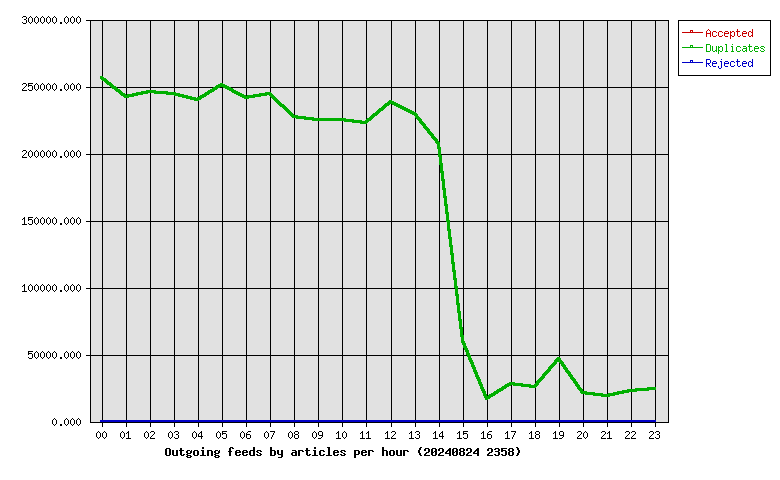
| Hour | Accepted | %Acc | Volume | %Vol | dups | Rejs |
|---|---|---|---|---|---|---|
| 00 | 0 | 0.00 | 0.00KB | 0.00 | 256603 | 0 |
| 01 | 0 | 0.00 | 0.00KB | 0.00 | 242417 | 0 |
| 02 | 0 | 0.00 | 0.00KB | 0.00 | 245530 | 0 |
| 03 | 0 | 0.00 | 0.00KB | 0.00 | 244224 | 0 |
| 04 | 0 | 0.00 | 0.00KB | 0.00 | 239779 | 0 |
| 05 | 0 | 0.00 | 0.00KB | 0.00 | 250890 | 0 |
| 06 | 0 | 0.00 | 0.00KB | 0.00 | 241369 | 0 |
| 07 | 0 | 0.00 | 0.00KB | 0.00 | 244063 | 0 |
| 08 | 0 | 0.00 | 0.00KB | 0.00 | 227539 | 0 |
| 09 | 0 | 0.00 | 0.00KB | 0.00 | 224738 | 0 |
| 10 | 0 | 0.00 | 0.00KB | 0.00 | 225254 | 0 |
| 11 | 0 | 0.00 | 0.00KB | 0.00 | 222715 | 0 |
| 12 | 0 | 0.00 | 0.00KB | 0.00 | 238096 | 0 |
| 13 | 0 | 0.00 | 0.00KB | 0.00 | 229510 | 0 |
| 14 | 0 | 0.00 | 0.00KB | 0.00 | 207168 | 0 |
| 15 | 0 | 0.00 | 0.00KB | 0.00 | 60402 | 0 |
| 16 | 0 | 0.00 | 0.00KB | 0.00 | 16789 | 0 |
| 17 | 0 | 0.00 | 0.00KB | 0.00 | 28340 | 0 |
| 18 | 0 | 0.00 | 0.00KB | 0.00 | 26031 | 0 |
| 19 | 0 | 0.00 | 0.00KB | 0.00 | 46335 | 0 |
| 20 | 0 | 0.00 | 0.00KB | 0.00 | 21086 | 0 |
| 21 | 0 | 0.00 | 0.00KB | 0.00 | 18981 | 0 |
| 22 | 0 | 0.00 | 0.00KB | 0.00 | 22874 | 0 |
| 23 | 0 | 0.00 | 0.00KB | 0.00 | 24535 | 0 |
| Total | 0 | 0.00 | 0.00KB | 0.00 | 3805268 | 0 |
 |
| >= 20% Full | >= 35% Full | >= 50% Full | >= 65% Full | >= 80% Full | >= 95% Full |
| Outgoing Feed | Batch Seq | Batch Num | Batch Max | %Full | Av. Pending |
|---|---|---|---|---|---|
| nbr.elbracht.net-o | 980863-980944 | 81 | 500 | 16 | 0.0 |
| text-spool-out | 0-0 | 0 | 500 | 0 | 0.0 |
| 1st Time | Last Time | # Msgs | Message |
|---|---|---|---|
| 05:28:52 | 05:28:59 | 3 | DNS Fwd/Rev mismatch: lookup of scanner-06.ch1.censys-scanner.com failed |
| 10:06:54 | 1 | DNS Fwd/Rev mismatch: visit.keznews.com/194.165.16.10 | |
| 02:13:20 | 1 | DNS Fwd/Rev mismatch: internettl.org/104.152.52.233 | |
| 02:13:47 | 1 | DNS Fwd/Rev mismatch: internettl.org/104.152.52.230 |