| |
DIABLO statistics for newsfeed.yoursite.com on Fri 23 Aug 2024 |
Generated on 20240823 2358 by feeder-stats v4.006. Copyright © 2002 The Diablo Project.
Diablo running processes:  81    Dnewslink running processes:  0


11:59PM  up 187 days,  7:18, 0 users, load averages: 2.16, 1.19, 0.89

Filesystem     Size    Used   Avail Capacity  Mounted on
/dev/da0s1g     94G    1.2G     85G     1%    /news
/dev/da1       7.3T    5.8T    923G    87%    /news2/spool/news/00
/dev/da2       7.3T    5.8T    913G    87%    /news2/spool/news/01
/dev/da3       3.7T    3.3T     66G    98%    /news2/spool/news/02
/dev/da4       5.5T    2.9T    2.1T    58%    /news2/spool/news/03
/dev/da8       7.3T    5.8T    917G    87%    /news2/spool/news/04
/dev/da9       7.3T    5.8T    911G    87%    /news2/spool/news/05
/dev/da10      7.3T    5.8T    918G    87%    /news2/spool/news/06
/dev/da11      5.5T      5T     65G    99%    /news2/spool/news/07
/dev/da12      5.5T    4.3T    721G    86%    /news2/spool/news/08
/dev/da13      7.3T    5.8T    917G    87%    /news2/spool/news/09
/dev/da14      7.3T    5.8T    916G    87%    /news2/spool/news/10
/dev/da15      7.3T    5.8T    914G    87%    /news2/spool/news/11
/dev/da16      7.3T    5.8T    915G    87%    /news2/spool/news/12
/dev/da17      7.3T    5.8T    915G    87%    /news2/spool/news/13
/dev/da18      7.3T    5.8T    918G    87%    /news2/spool/news/14
/dev/da19      7.3T    5.8T    916G    87%    /news2/spool/news/15
/dev/da20      7.3T    5.8T    915G    87%    /news2/spool/news/16
/dev/da21      7.3T    5.8T    914G    87%    /news2/spool/news/17
/dev/da22      7.3T    5.8T    914G    87%    /news2/spool/news/18
/dev/da23      7.3T    5.8T    919G    87%    /news2/spool/news/19
/dev/da24      7.3T    5.8T    915G    87%    /news2/spool/news/20
/dev/da25      7.3T    5.8T    915G    87%    /news2/spool/news/21
/dev/da26      7.3T    5.8T    916G    87%    /news2/spool/news/22
/dev/da5       221G     34G    168G    17%    /news1
/dev/md0        40G     13G     22G    36%    /news3
| Incoming Feed (+ Top1000 #) | Accepted | %Acc | %Tot | Art/sec | Volume | %Vol | KB/art | Check | Ihave | Spam | TooOld | Rejs | Errs | ||
|---|---|---|---|---|---|---|---|---|---|---|---|---|---|---|---|
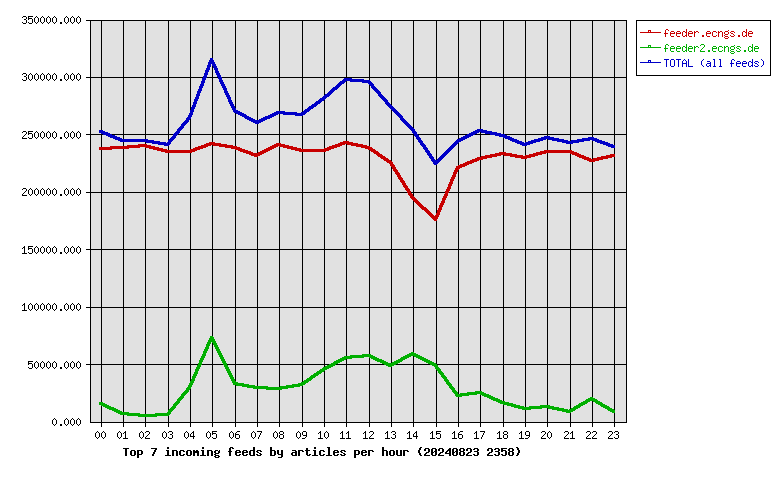
| 1 | feeder.ecngs.de | 5520308 | 88.14 | 88.86 | 63.89 | 3.66TB | 99.91 | 711.52 | 6262769 | 0 | 0 | 0 | 575 | 0 | |
| 2 | feeder2.ecngs.de | 692226 | 89.38 | 11.14 | 8.06 | 3.56GB | 0.09 | 5.39 | 773913 | 0 | 0 | 0 | 570 | 0 | |
| Total | 6212534 | 0.00 | 100.00 | 71.95 | 3.66TB | 100.00 | 632.84 | 7036682 | 0 | 0 | 0 | 1145 | 0 | ||
 |
| Incoming Feed (+ Top1000 #) | Volume | %Vol | Kbps | Accepted | %Acc | %Tot | KB/art | Check | Ihave | Spam | TooOld | Rejs | Errs | ||
|---|---|---|---|---|---|---|---|---|---|---|---|---|---|---|---|
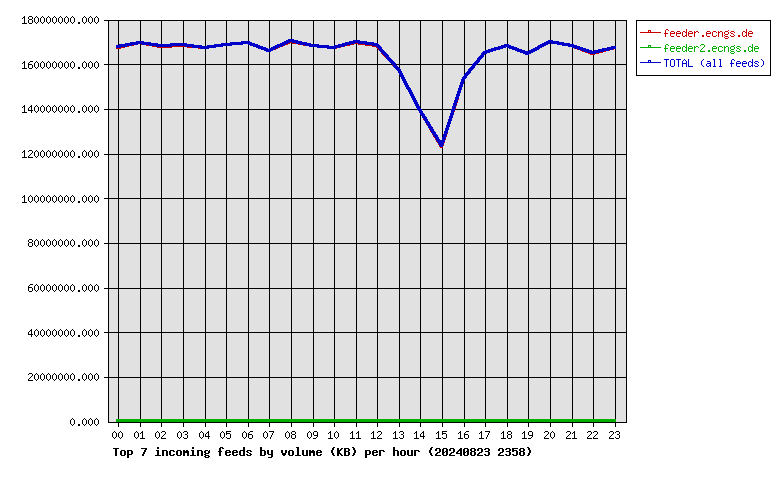
| 1 | feeder.ecngs.de | 3.66TB | 99.91 | 363687.28 | 5520308 | 88.14 | 88.86 | 711.52 | 6262769 | 0 | 0 | 0 | 575 | 0 | |
| 2 | feeder2.ecngs.de | 3.56GB | 0.09 | 347.43 | 692226 | 89.38 | 11.14 | 5.39 | 773913 | 0 | 0 | 0 | 570 | 0 | |
| Total | 3.66TB | 100.00 | 364034.70 | 6212534 | 0.00 | 100.00 | 632.84 | 7036682 | 0 | 0 | 0 | 1145 | 0 | ||
 |
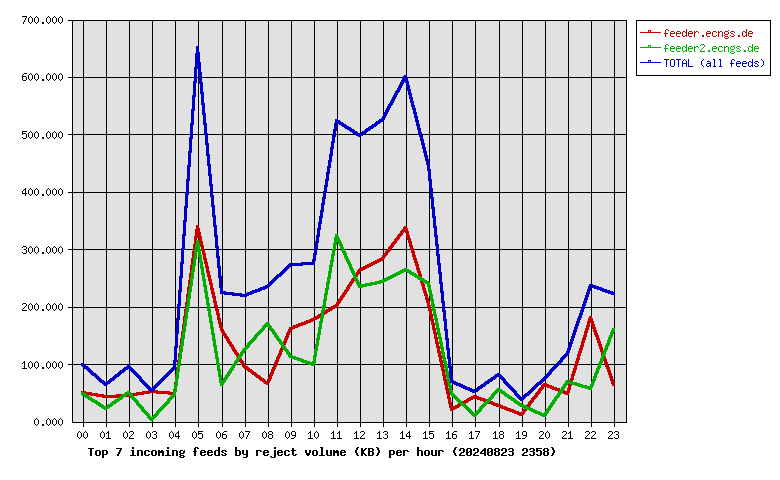
| Incoming Feed (+ Top1000 #) | Rej. Vol. | %Vol | Kbps | Accepted | %Acc | %Tot | KB/art | Check | Ihave | Spam | TooOld | Rejs | Errs | ||
|---|---|---|---|---|---|---|---|---|---|---|---|---|---|---|---|
| 1 | feeder.ecngs.de | 2.90MB | 51.67 | 0.28 | 5520308 | 88.14 | 88.86 | 711.52 | 6262769 | 0 | 0 | 0 | 575 | 0 | |
| 2 | feeder2.ecngs.de | 2.72MB | 48.33 | 0.26 | 692226 | 89.38 | 11.14 | 5.39 | 773913 | 0 | 0 | 0 | 570 | 0 | |
| Total | 5.62MB | 100.00 | 0.53 | 6212534 | 0.00 | 100.00 | 632.84 | 7036682 | 0 | 0 | 0 | 1145 | 0 | ||
 |
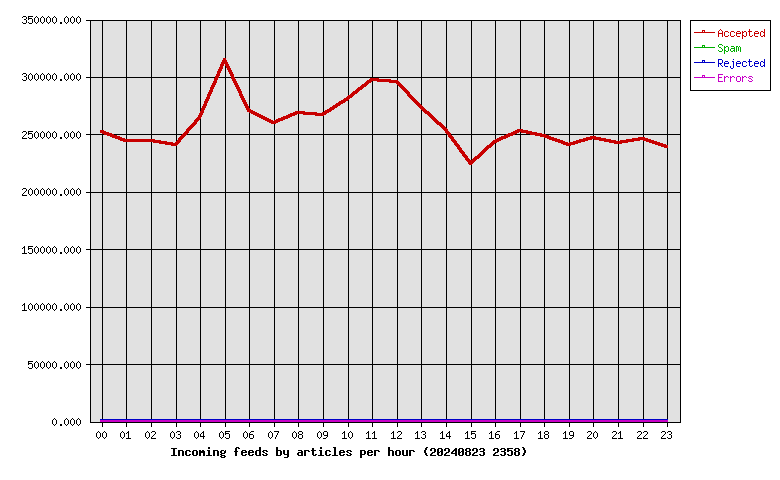
| Hour | Accepted | %Acc | Volume | %Vol | Check | Ihave | Spam | Rejs | Errs |
|---|---|---|---|---|---|---|---|---|---|
| 00 | 251956 | 4.06 | 159.76GB | 4.26 | 269009 | 0 | 0 | 11 | 0 |
| 01 | 244311 | 3.93 | 161.57GB | 4.31 | 251509 | 0 | 0 | 8 | 0 |
| 02 | 244627 | 3.94 | 160.18GB | 4.27 | 250491 | 0 | 0 | 5 | 0 |
| 03 | 240330 | 3.87 | 160.59GB | 4.28 | 246768 | 0 | 0 | 6 | 0 |
| 04 | 264433 | 4.26 | 159.61GB | 4.26 | 288974 | 0 | 0 | 28 | 0 |
| 05 | 314329 | 5.06 | 160.94GB | 4.29 | 413666 | 0 | 0 | 165 | 0 |
| 06 | 270674 | 4.36 | 161.82GB | 4.32 | 309204 | 0 | 0 | 63 | 0 |
| 07 | 260290 | 4.19 | 158.36GB | 4.22 | 293171 | 0 | 0 | 39 | 0 |
| 08 | 268848 | 4.33 | 162.37GB | 4.33 | 304125 | 0 | 0 | 59 | 0 |
| 09 | 267024 | 4.30 | 160.46GB | 4.28 | 303786 | 0 | 0 | 50 | 0 |
| 10 | 280376 | 4.51 | 159.61GB | 4.26 | 331295 | 0 | 0 | 81 | 0 |
| 11 | 297194 | 4.78 | 161.98GB | 4.32 | 361895 | 0 | 0 | 104 | 0 |
| 12 | 295636 | 4.76 | 160.84GB | 4.29 | 366210 | 0 | 0 | 91 | 0 |
| 13 | 273704 | 4.41 | 150.08GB | 4.00 | 332999 | 0 | 0 | 103 | 0 |
| 14 | 253742 | 4.08 | 133.06GB | 3.55 | 324055 | 0 | 0 | 139 | 0 |
| 15 | 224012 | 3.61 | 117.58GB | 3.14 | 280615 | 0 | 0 | 66 | 0 |
| 16 | 243751 | 3.92 | 146.45GB | 3.91 | 272739 | 0 | 0 | 13 | 0 |
| 17 | 252853 | 4.07 | 157.33GB | 4.20 | 280070 | 0 | 0 | 20 | 0 |
| 18 | 248608 | 4.00 | 160.35GB | 4.28 | 267481 | 0 | 0 | 11 | 0 |
| 19 | 240627 | 3.87 | 156.96GB | 4.19 | 253645 | 0 | 0 | 8 | 0 |
| 20 | 246837 | 3.97 | 162.05GB | 4.32 | 262518 | 0 | 0 | 10 | 0 |
| 21 | 242699 | 3.91 | 160.52GB | 4.28 | 252215 | 0 | 0 | 9 | 0 |
| 22 | 246377 | 3.97 | 157.27GB | 4.19 | 270981 | 0 | 0 | 39 | 0 |
| 23 | 239296 | 3.85 | 159.66GB | 4.26 | 249261 | 0 | 0 | 17 | 0 |
| Total | 6212534 | 100.00 | 3.66TB | 100.00 | 7036682 | 0 | 0 | 1145 | 0 |
 |
| Outgoing Feed (+ Top1000 #) | Accepted | %Acc | %Tot | Art/sec | Volume | %Vol | KB/art | Dups | Rejs | % Ratio (Out/In) | ||
|---|---|---|---|---|---|---|---|---|---|---|---|---|
| 1 | 217.73.144.40 | 0 | 0.00 | 0.00 | 0.00 | 0.00KB | 0.00 | 0.00 | 6222533 | 0 | … | |
| Total | 0 | 0.00 | 0.00 | 0.00 | 0.00KB | 0.00 | 0.00 | 6222533 | 0 | |||
 |
| Outgoing Feed (+ Top1000 #) | Volume | %Vol | Kbps | Accepted | %Acc | %Tot | KB/art | Dups | Rejs | % Ratio (Out/In) | ||
|---|---|---|---|---|---|---|---|---|---|---|---|---|
| 1 | 217.73.144.40 | 0.00KB | 0.00 | 0.00 | 0 | 0.00 | 0.00 | 0.00 | 6222533 | 0 | … | |
| Total | 0.00KB | 0.00 | 0.00 | 0 | 0.00 | 0.00 | 0.00 | 6222533 | 0 | |||
 |
| Outgoing Feed (+ Top1000 #) | Rej. Vol. | %Vol | Kbps | Accepted | %Acc | %Tot | KB/art | Dups | Rejs | % Ratio (Out/In) | ||
|---|---|---|---|---|---|---|---|---|---|---|---|---|
| 1 | 217.73.144.40 | 0.00KB | 0.00 | 0.00 | 0 | 0.00 | 0.00 | 0.00 | 6222533 | 0 | … | |
| Total | 0.00KB | 0.00 | 0.00 | 0 | 0.00 | 0.00 | 0.00 | 6222533 | 0 | |||
 |
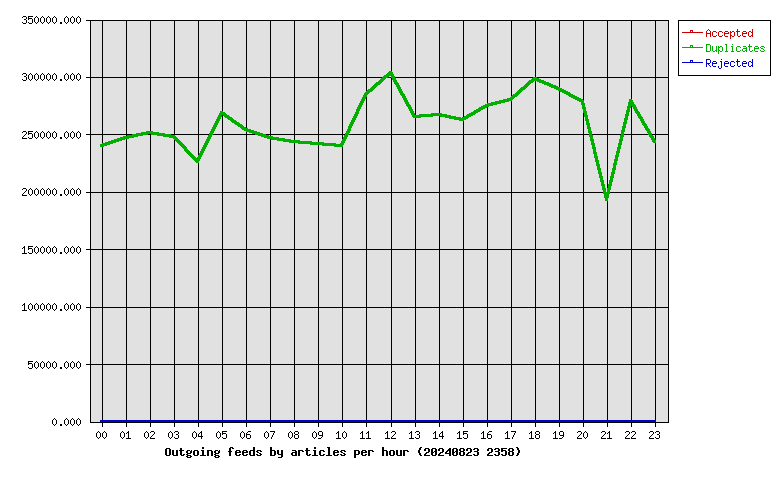
| Hour | Accepted | %Acc | Volume | %Vol | dups | Rejs |
|---|---|---|---|---|---|---|
| 00 | 0 | 0.00 | 0.00KB | 0.00 | 239948 | 0 |
| 01 | 0 | 0.00 | 0.00KB | 0.00 | 246851 | 0 |
| 02 | 0 | 0.00 | 0.00KB | 0.00 | 250975 | 0 |
| 03 | 0 | 0.00 | 0.00KB | 0.00 | 247266 | 0 |
| 04 | 0 | 0.00 | 0.00KB | 0.00 | 225898 | 0 |
| 05 | 0 | 0.00 | 0.00KB | 0.00 | 268277 | 0 |
| 06 | 0 | 0.00 | 0.00KB | 0.00 | 253761 | 0 |
| 07 | 0 | 0.00 | 0.00KB | 0.00 | 246978 | 0 |
| 08 | 0 | 0.00 | 0.00KB | 0.00 | 243601 | 0 |
| 09 | 0 | 0.00 | 0.00KB | 0.00 | 241695 | 0 |
| 10 | 0 | 0.00 | 0.00KB | 0.00 | 240015 | 0 |
| 11 | 0 | 0.00 | 0.00KB | 0.00 | 284408 | 0 |
| 12 | 0 | 0.00 | 0.00KB | 0.00 | 303763 | 0 |
| 13 | 0 | 0.00 | 0.00KB | 0.00 | 264867 | 0 |
| 14 | 0 | 0.00 | 0.00KB | 0.00 | 266628 | 0 |
| 15 | 0 | 0.00 | 0.00KB | 0.00 | 262189 | 0 |
| 16 | 0 | 0.00 | 0.00KB | 0.00 | 274382 | 0 |
| 17 | 0 | 0.00 | 0.00KB | 0.00 | 280334 | 0 |
| 18 | 0 | 0.00 | 0.00KB | 0.00 | 298042 | 0 |
| 19 | 0 | 0.00 | 0.00KB | 0.00 | 289303 | 0 |
| 20 | 0 | 0.00 | 0.00KB | 0.00 | 277793 | 0 |
| 21 | 0 | 0.00 | 0.00KB | 0.00 | 192564 | 0 |
| 22 | 0 | 0.00 | 0.00KB | 0.00 | 279407 | 0 |
| 23 | 0 | 0.00 | 0.00KB | 0.00 | 243588 | 0 |
| Total | 0 | 0.00 | 0.00KB | 0.00 | 6222533 | 0 |
 |
| >= 20% Full | >= 35% Full | >= 50% Full | >= 65% Full | >= 80% Full | >= 95% Full |
| Outgoing Feed | Batch Seq | Batch Num | Batch Max | %Full | Av. Pending |
|---|---|---|---|---|---|
| nbr.elbracht.net-o | 980575-980656 | 81 | 500 | 16 | 0.0 |
| text-spool-out | 0-0 | 0 | 500 | 0 | 0.0 |
| 1st Time | Last Time | # Msgs | Message |
|---|---|---|---|
| 13:07:48 | 13:07:55 | 3 | DNS Fwd/Rev mismatch: lookup of scanner-205.hk2.censys-scanner.com failed |
| 06:43:41 | 1 | DNS Fwd/Rev mismatch: visit.keznews.com/194.165.16.76 | |
| 09:01:17 | 1 | DNS Fwd/Rev mismatch: iodimaxio.com/69.10.48.174 |