| |
DIABLO statistics for newsfeed.yoursite.com on Thu 22 Aug 2024 |
Generated on 20240822 2358 by feeder-stats v4.006. Copyright © 2002 The Diablo Project.
Diablo running processes:  81    Dnewslink running processes:  0


11:59PM  up 186 days,  7:18, 0 users, load averages: 1.85, 0.85, 0.68

Filesystem     Size    Used   Avail Capacity  Mounted on
/dev/da0s1g     94G    1.2G     85G     1%    /news
/dev/da1       7.3T    5.8T    925G    86%    /news2/spool/news/00
/dev/da2       7.3T    5.8T    922G    87%    /news2/spool/news/01
/dev/da3       3.7T    3.3T     66G    98%    /news2/spool/news/02
/dev/da4       5.5T    2.9T    2.1T    58%    /news2/spool/news/03
/dev/da8       7.3T    5.8T    926G    86%    /news2/spool/news/04
/dev/da9       7.3T    5.8T    927G    86%    /news2/spool/news/05
/dev/da10      7.3T    5.8T    927G    86%    /news2/spool/news/06
/dev/da11      5.5T      5T     62G    99%    /news2/spool/news/07
/dev/da12      5.5T    4.3T    728G    86%    /news2/spool/news/08
/dev/da13      7.3T    5.8T    926G    86%    /news2/spool/news/09
/dev/da14      7.3T    5.8T    925G    86%    /news2/spool/news/10
/dev/da15      7.3T    5.8T    923G    87%    /news2/spool/news/11
/dev/da16      7.3T    5.8T    924G    87%    /news2/spool/news/12
/dev/da17      7.3T    5.8T    924G    87%    /news2/spool/news/13
/dev/da18      7.3T    5.8T    927G    86%    /news2/spool/news/14
/dev/da19      7.3T    5.8T    925G    86%    /news2/spool/news/15
/dev/da20      7.3T    5.8T    925G    86%    /news2/spool/news/16
/dev/da21      7.3T    5.8T    924G    87%    /news2/spool/news/17
/dev/da22      7.3T    5.8T    923G    87%    /news2/spool/news/18
/dev/da23      7.3T    5.8T    929G    86%    /news2/spool/news/19
/dev/da24      7.3T    5.8T    923G    87%    /news2/spool/news/20
/dev/da25      7.3T    5.8T    924G    87%    /news2/spool/news/21
/dev/da26      7.3T    5.8T    925G    86%    /news2/spool/news/22
/dev/da5       221G     34G    169G    17%    /news1
/dev/md0        40G     13G     22G    36%    /news3
| Incoming Feed (+ Top1000 #) | Accepted | %Acc | %Tot | Art/sec | Volume | %Vol | KB/art | Check | Ihave | Spam | TooOld | Rejs | Errs | ||
|---|---|---|---|---|---|---|---|---|---|---|---|---|---|---|---|
| 1 | feeder.ecngs.de | 5462872 | 93.85 | 94.26 | 63.23 | 3.60TB | 99.94 | 707.22 | 5820858 | 0 | 0 | 0 | 271 | 0 | |
| 2 | feeder2.ecngs.de | 332923 | 90.30 | 5.74 | 3.87 | 2.08GB | 0.06 | 6.56 | 368507 | 0 | 0 | 0 | 180 | 0 | |
| Total | 5795795 | 0.00 | 100.00 | 67.10 | 3.60TB | 100.00 | 666.97 | 6189365 | 0 | 0 | 0 | 451 | 0 | ||
 |
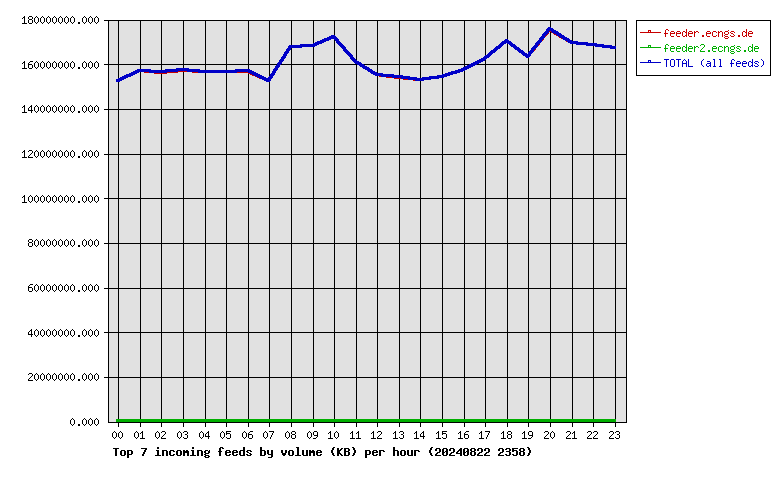
| Incoming Feed (+ Top1000 #) | Volume | %Vol | Kbps | Accepted | %Acc | %Tot | KB/art | Check | Ihave | Spam | TooOld | Rejs | Errs | ||
|---|---|---|---|---|---|---|---|---|---|---|---|---|---|---|---|
| 1 | feeder.ecngs.de | 3.60TB | 99.94 | 357725.94 | 5462872 | 93.85 | 94.26 | 707.22 | 5820858 | 0 | 0 | 0 | 271 | 0 | |
| 2 | feeder2.ecngs.de | 2.08GB | 0.06 | 203.01 | 332923 | 90.30 | 5.74 | 6.56 | 368507 | 0 | 0 | 0 | 180 | 0 | |
| Total | 3.60TB | 100.00 | 357928.96 | 5795795 | 0.00 | 100.00 | 666.97 | 6189365 | 0 | 0 | 0 | 451 | 0 | ||
 |
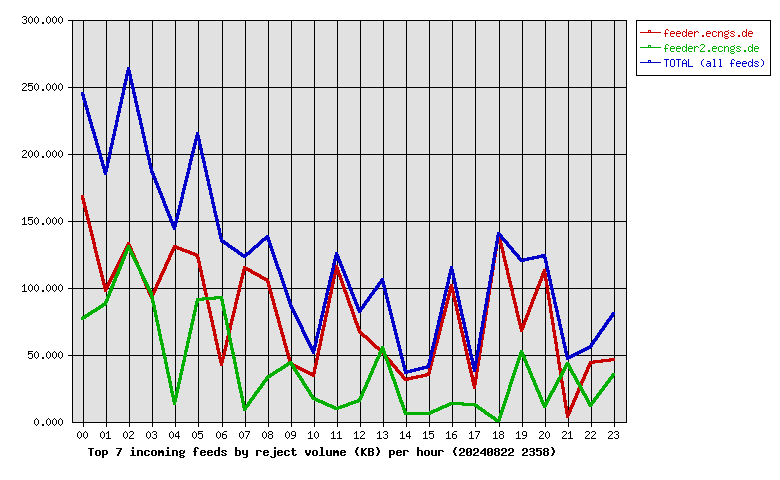
| Incoming Feed (+ Top1000 #) | Rej. Vol. | %Vol | Kbps | Accepted | %Acc | %Tot | KB/art | Check | Ihave | Spam | TooOld | Rejs | Errs | ||
|---|---|---|---|---|---|---|---|---|---|---|---|---|---|---|---|
| 1 | feeder.ecngs.de | 1.88MB | 66.78 | 0.18 | 5462872 | 93.85 | 94.26 | 707.22 | 5820858 | 0 | 0 | 0 | 271 | 0 | |
| 2 | feeder2.ecngs.de | 955.63KB | 33.22 | 0.09 | 332923 | 90.30 | 5.74 | 6.56 | 368507 | 0 | 0 | 0 | 180 | 0 | |
| Total | 2.81MB | 100.00 | 0.27 | 5795795 | 0.00 | 100.00 | 666.97 | 6189365 | 0 | 0 | 0 | 451 | 0 | ||
 |
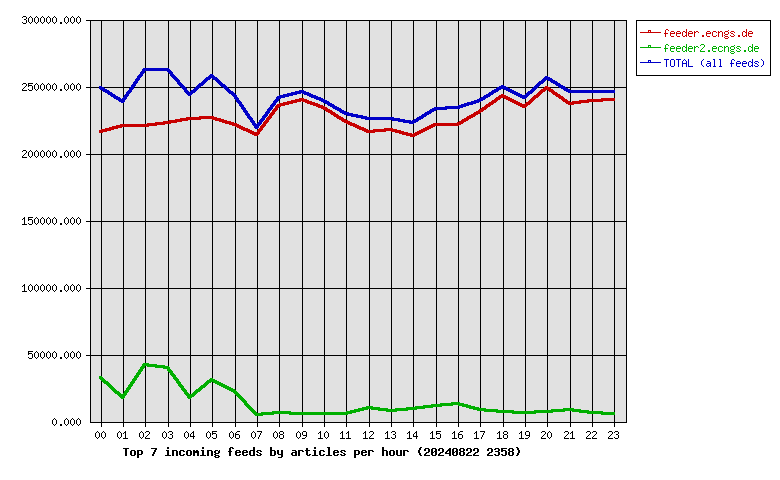
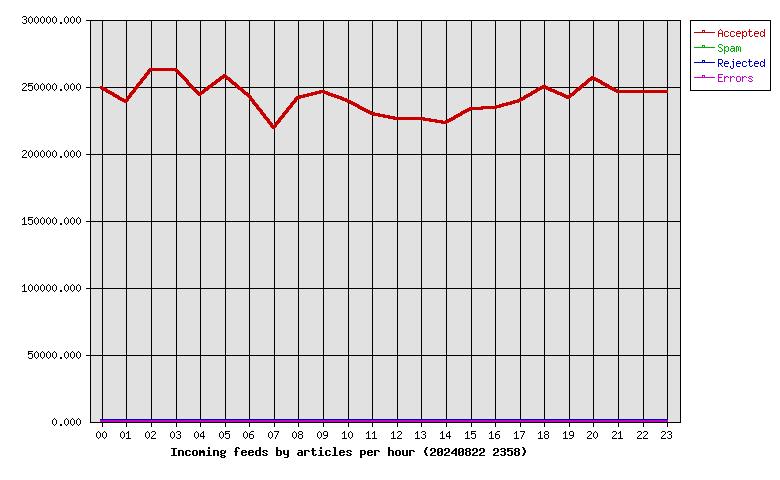
| Hour | Accepted | %Acc | Volume | %Vol | Check | Ihave | Spam | Rejs | Errs |
|---|---|---|---|---|---|---|---|---|---|
| 00 | 248515 | 4.29 | 145.59GB | 3.95 | 290930 | 0 | 0 | 52 | 0 |
| 01 | 238168 | 4.11 | 149.71GB | 4.06 | 257743 | 0 | 0 | 16 | 0 |
| 02 | 262659 | 4.53 | 149.16GB | 4.05 | 310810 | 0 | 0 | 69 | 0 |
| 03 | 262672 | 4.53 | 150.02GB | 4.07 | 308215 | 0 | 0 | 45 | 0 |
| 04 | 243344 | 4.20 | 149.35GB | 4.05 | 261605 | 0 | 0 | 28 | 0 |
| 05 | 257652 | 4.45 | 149.41GB | 4.05 | 299433 | 0 | 0 | 60 | 0 |
| 06 | 242807 | 4.19 | 149.49GB | 4.06 | 271466 | 0 | 0 | 33 | 0 |
| 07 | 219184 | 3.78 | 145.25GB | 3.94 | 224684 | 0 | 0 | 10 | 0 |
| 08 | 241749 | 4.17 | 159.90GB | 4.34 | 249420 | 0 | 0 | 8 | 0 |
| 09 | 245610 | 4.24 | 160.50GB | 4.35 | 252486 | 0 | 0 | 8 | 0 |
| 10 | 239514 | 4.13 | 164.16GB | 4.45 | 244716 | 0 | 0 | 6 | 0 |
| 11 | 229255 | 3.96 | 153.54GB | 4.16 | 236783 | 0 | 0 | 12 | 0 |
| 12 | 226020 | 3.90 | 148.11GB | 4.02 | 236323 | 0 | 0 | 4 | 0 |
| 13 | 225448 | 3.89 | 146.91GB | 3.98 | 234219 | 0 | 0 | 12 | 0 |
| 14 | 222874 | 3.85 | 145.93GB | 3.96 | 233877 | 0 | 0 | 5 | 0 |
| 15 | 232845 | 4.02 | 147.00GB | 3.99 | 244693 | 0 | 0 | 10 | 0 |
| 16 | 234156 | 4.04 | 150.21GB | 4.07 | 249029 | 0 | 0 | 14 | 0 |
| 17 | 238861 | 4.12 | 154.68GB | 4.20 | 249654 | 0 | 0 | 8 | 0 |
| 18 | 249797 | 4.31 | 162.55GB | 4.41 | 258200 | 0 | 0 | 10 | 0 |
| 19 | 241175 | 4.16 | 155.81GB | 4.23 | 248671 | 0 | 0 | 8 | 0 |
| 20 | 256320 | 4.42 | 167.40GB | 4.54 | 264020 | 0 | 0 | 13 | 0 |
| 21 | 245538 | 4.24 | 161.66GB | 4.39 | 255663 | 0 | 0 | 5 | 0 |
| 22 | 245658 | 4.24 | 160.75GB | 4.36 | 253767 | 0 | 0 | 7 | 0 |
| 23 | 245974 | 4.24 | 159.44GB | 4.32 | 252958 | 0 | 0 | 8 | 0 |
| Total | 5795795 | 100.00 | 3.60TB | 100.00 | 6189365 | 0 | 0 | 451 | 0 |
 |
| Outgoing Feed (+ Top1000 #) | Accepted | %Acc | %Tot | Art/sec | Volume | %Vol | KB/art | Dups | Rejs | % Ratio (Out/In) | ||
|---|---|---|---|---|---|---|---|---|---|---|---|---|
| 1 | 217.73.144.40 | 0 | 0.00 | 0.00 | 0.00 | 0.00KB | 0.00 | 0.00 | 6042679 | 0 | … | |
| Total | 0 | 0.00 | 0.00 | 0.00 | 0.00KB | 0.00 | 0.00 | 6042679 | 0 | |||
 |
| Outgoing Feed (+ Top1000 #) | Volume | %Vol | Kbps | Accepted | %Acc | %Tot | KB/art | Dups | Rejs | % Ratio (Out/In) | ||
|---|---|---|---|---|---|---|---|---|---|---|---|---|
| 1 | 217.73.144.40 | 0.00KB | 0.00 | 0.00 | 0 | 0.00 | 0.00 | 0.00 | 6042679 | 0 | … | |
| Total | 0.00KB | 0.00 | 0.00 | 0 | 0.00 | 0.00 | 0.00 | 6042679 | 0 | |||
 |
| Outgoing Feed (+ Top1000 #) | Rej. Vol. | %Vol | Kbps | Accepted | %Acc | %Tot | KB/art | Dups | Rejs | % Ratio (Out/In) | ||
|---|---|---|---|---|---|---|---|---|---|---|---|---|
| 1 | 217.73.144.40 | 0.00KB | 0.00 | 0.00 | 0 | 0.00 | 0.00 | 0.00 | 6042679 | 0 | … | |
| Total | 0.00KB | 0.00 | 0.00 | 0 | 0.00 | 0.00 | 0.00 | 6042679 | 0 | |||
 |
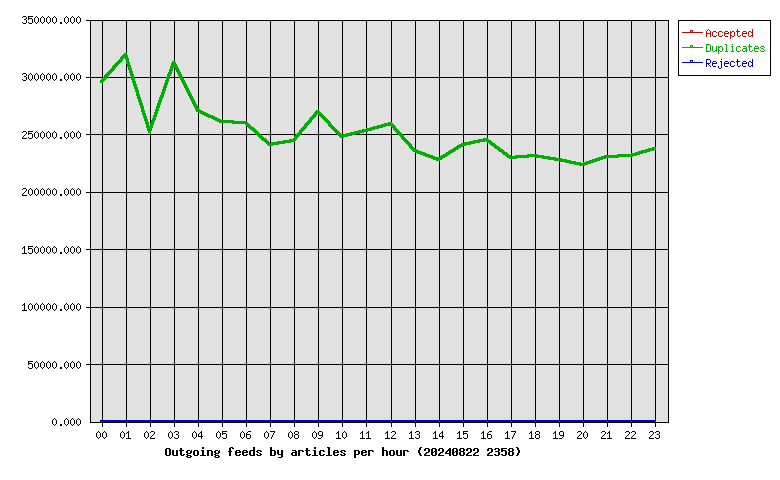
| Hour | Accepted | %Acc | Volume | %Vol | dups | Rejs |
|---|---|---|---|---|---|---|
| 00 | 0 | 0.00 | 0.00KB | 0.00 | 295339 | 0 |
| 01 | 0 | 0.00 | 0.00KB | 0.00 | 318930 | 0 |
| 02 | 0 | 0.00 | 0.00KB | 0.00 | 252389 | 0 |
| 03 | 0 | 0.00 | 0.00KB | 0.00 | 312078 | 0 |
| 04 | 0 | 0.00 | 0.00KB | 0.00 | 270250 | 0 |
| 05 | 0 | 0.00 | 0.00KB | 0.00 | 260384 | 0 |
| 06 | 0 | 0.00 | 0.00KB | 0.00 | 260003 | 0 |
| 07 | 0 | 0.00 | 0.00KB | 0.00 | 240830 | 0 |
| 08 | 0 | 0.00 | 0.00KB | 0.00 | 244172 | 0 |
| 09 | 0 | 0.00 | 0.00KB | 0.00 | 269522 | 0 |
| 10 | 0 | 0.00 | 0.00KB | 0.00 | 247620 | 0 |
| 11 | 0 | 0.00 | 0.00KB | 0.00 | 252847 | 0 |
| 12 | 0 | 0.00 | 0.00KB | 0.00 | 259263 | 0 |
| 13 | 0 | 0.00 | 0.00KB | 0.00 | 235113 | 0 |
| 14 | 0 | 0.00 | 0.00KB | 0.00 | 228075 | 0 |
| 15 | 0 | 0.00 | 0.00KB | 0.00 | 241086 | 0 |
| 16 | 0 | 0.00 | 0.00KB | 0.00 | 245169 | 0 |
| 17 | 0 | 0.00 | 0.00KB | 0.00 | 229495 | 0 |
| 18 | 0 | 0.00 | 0.00KB | 0.00 | 231236 | 0 |
| 19 | 0 | 0.00 | 0.00KB | 0.00 | 227340 | 0 |
| 20 | 0 | 0.00 | 0.00KB | 0.00 | 223409 | 0 |
| 21 | 0 | 0.00 | 0.00KB | 0.00 | 230433 | 0 |
| 22 | 0 | 0.00 | 0.00KB | 0.00 | 230722 | 0 |
| 23 | 0 | 0.00 | 0.00KB | 0.00 | 236974 | 0 |
| Total | 0 | 0.00 | 0.00KB | 0.00 | 6042679 | 0 |
 |
| >= 20% Full | >= 35% Full | >= 50% Full | >= 65% Full | >= 80% Full | >= 95% Full |
| Outgoing Feed | Batch Seq | Batch Num | Batch Max | %Full | Av. Pending |
|---|---|---|---|---|---|
| nbr.elbracht.net-o | 980287-980368 | 81 | 500 | 16 | 0.0 |
| text-spool-out | 0-0 | 0 | 500 | 0 | 0.0 |
| 1st Time | Last Time | # Msgs | Message |
|---|