| |
DIABLO statistics for newsfeed.yoursite.com on Wed 21 Aug 2024 |
Generated on 20240821 2358 by feeder-stats v4.006. Copyright © 2002 The Diablo Project.
Diablo running processes:  81    Dnewslink running processes:  0


11:59PM  up 185 days,  7:18, 0 users, load averages: 1.70, 0.92, 0.72

Filesystem     Size    Used   Avail Capacity  Mounted on
/dev/da0s1g     94G    1.2G     85G     1%    /news
/dev/da1       7.3T    5.8T    928G    86%    /news2/spool/news/00
/dev/da2       7.3T    5.8T    925G    86%    /news2/spool/news/01
/dev/da3       3.7T    3.3T     67G    98%    /news2/spool/news/02
/dev/da4       5.5T    2.9T    2.1T    58%    /news2/spool/news/03
/dev/da8       7.3T    5.8T    929G    86%    /news2/spool/news/04
/dev/da9       7.3T    5.8T    924G    87%    /news2/spool/news/05
/dev/da10      7.3T    5.8T    930G    86%    /news2/spool/news/06
/dev/da11      5.5T      5T     62G    99%    /news2/spool/news/07
/dev/da12      5.5T    4.3T    730G    86%    /news2/spool/news/08
/dev/da13      7.3T    5.8T    930G    86%    /news2/spool/news/09
/dev/da14      7.3T    5.8T    928G    86%    /news2/spool/news/10
/dev/da15      7.3T    5.8T    925G    86%    /news2/spool/news/11
/dev/da16      7.3T    5.8T    928G    86%    /news2/spool/news/12
/dev/da17      7.3T    5.8T    928G    86%    /news2/spool/news/13
/dev/da18      7.3T    5.8T    930G    86%    /news2/spool/news/14
/dev/da19      7.3T    5.8T    928G    86%    /news2/spool/news/15
/dev/da20      7.3T    5.8T    928G    86%    /news2/spool/news/16
/dev/da21      7.3T    5.8T    927G    86%    /news2/spool/news/17
/dev/da22      7.3T    5.8T    926G    86%    /news2/spool/news/18
/dev/da23      7.3T    5.8T    939G    86%    /news2/spool/news/19
/dev/da24      7.3T    5.8T    926G    86%    /news2/spool/news/20
/dev/da25      7.3T    5.8T    926G    86%    /news2/spool/news/21
/dev/da26      7.3T    5.8T    929G    86%    /news2/spool/news/22
/dev/da5       221G     34G    169G    17%    /news1
/dev/md0        40G     13G     23G    36%    /news3
| Incoming Feed (+ Top1000 #) | Accepted | %Acc | %Tot | Art/sec | Volume | %Vol | KB/art | Check | Ihave | Spam | TooOld | Rejs | Errs | ||
|---|---|---|---|---|---|---|---|---|---|---|---|---|---|---|---|
| 1 | feeder.ecngs.de | 5348993 | 86.75 | 87.32 | 61.91 | 3.51TB | 99.91 | 704.01 | 6165201 | 0 | 0 | 0 | 448 | 0 | |
| 2 | feeder2.ecngs.de | 776590 | 90.78 | 12.68 | 8.99 | 3.25GB | 0.09 | 4.39 | 854837 | 0 | 0 | 0 | 640 | 0 | |
| Total | 6125583 | 0.00 | 100.00 | 70.90 | 3.51TB | 100.00 | 615.31 | 7020038 | 0 | 0 | 0 | 1088 | 0 | ||
 |
| Incoming Feed (+ Top1000 #) | Volume | %Vol | Kbps | Accepted | %Acc | %Tot | KB/art | Check | Ihave | Spam | TooOld | Rejs | Errs | ||
|---|---|---|---|---|---|---|---|---|---|---|---|---|---|---|---|
| 1 | feeder.ecngs.de | 3.51TB | 99.91 | 348679.85 | 5348993 | 86.75 | 87.32 | 704.01 | 6165201 | 0 | 0 | 0 | 448 | 0 | |
| 2 | feeder2.ecngs.de | 3.25GB | 0.09 | 315.50 | 776590 | 90.78 | 12.68 | 4.39 | 854837 | 0 | 0 | 0 | 640 | 0 | |
| Total | 3.51TB | 100.00 | 348995.35 | 6125583 | 0.00 | 100.00 | 615.31 | 7020038 | 0 | 0 | 0 | 1088 | 0 | ||
 |
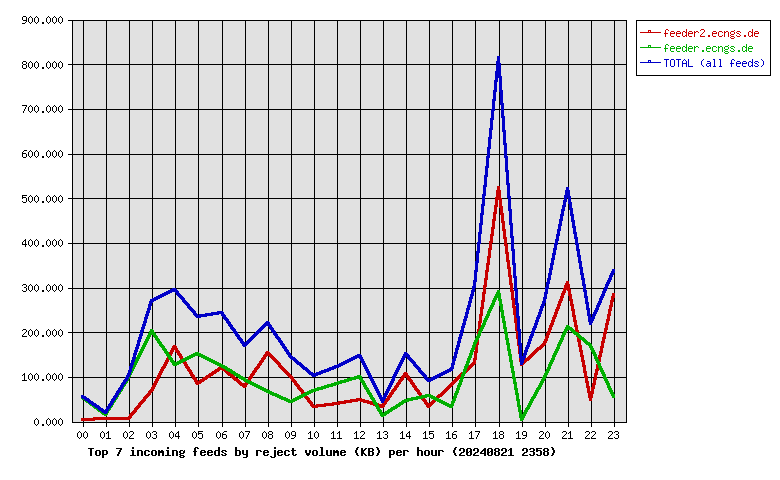
| Incoming Feed (+ Top1000 #) | Rej. Vol. | %Vol | Kbps | Accepted | %Acc | %Tot | KB/art | Check | Ihave | Spam | TooOld | Rejs | Errs | ||
|---|---|---|---|---|---|---|---|---|---|---|---|---|---|---|---|
| 1 | feeder2.ecngs.de | 2.68MB | 53.68 | 0.25 | 776590 | 90.78 | 12.68 | 4.39 | 854837 | 0 | 0 | 0 | 640 | 0 | |
| 2 | feeder.ecngs.de | 2.31MB | 46.32 | 0.22 | 5348993 | 86.75 | 87.32 | 704.01 | 6165201 | 0 | 0 | 0 | 448 | 0 | |
| Total | 5.00MB | 100.00 | 0.47 | 6125583 | 0.00 | 100.00 | 615.31 | 7020038 | 0 | 0 | 0 | 1088 | 0 | ||
 |
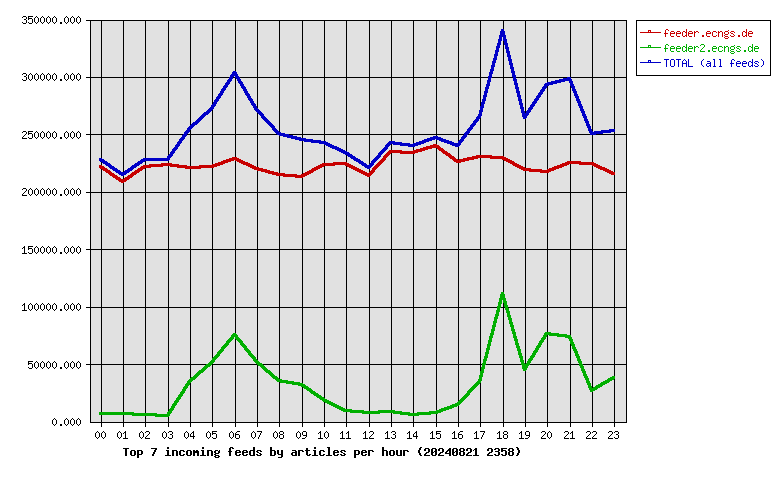
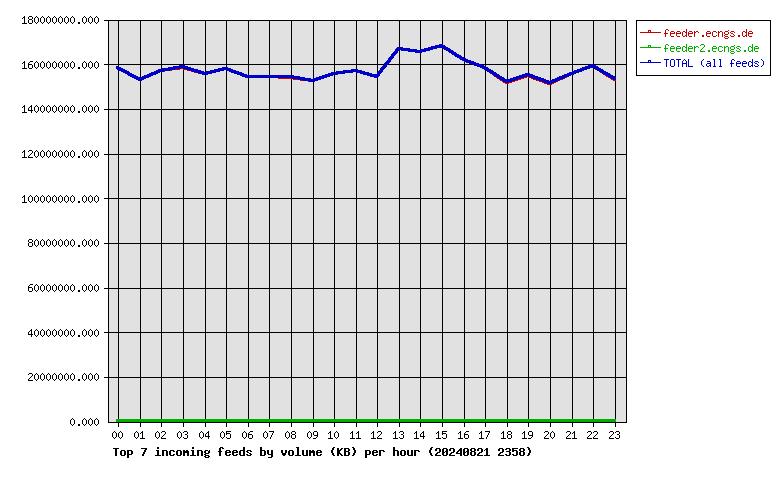
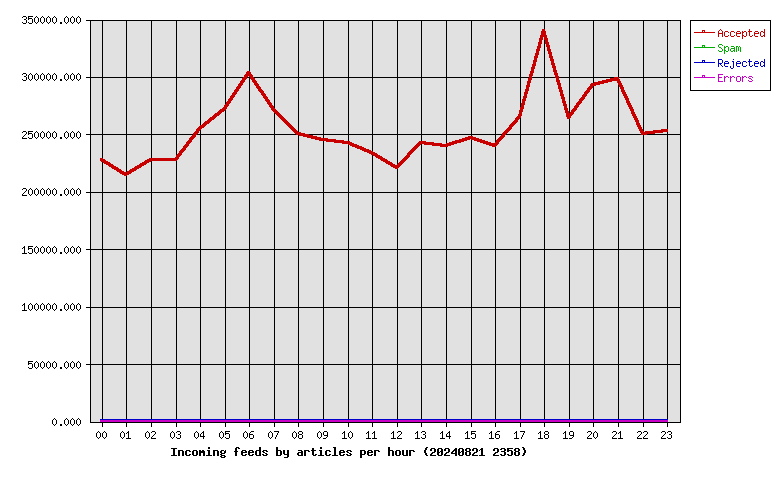
| Hour | Accepted | %Acc | Volume | %Vol | Check | Ihave | Spam | Rejs | Errs |
|---|---|---|---|---|---|---|---|---|---|
| 00 | 227797 | 3.72 | 150.80GB | 4.20 | 235109 | 0 | 0 | 7 | 0 |
| 01 | 214874 | 3.51 | 145.83GB | 4.06 | 221551 | 0 | 0 | 4 | 0 |
| 02 | 227525 | 3.71 | 149.59GB | 4.16 | 234499 | 0 | 0 | 13 | 0 |
| 03 | 227739 | 3.72 | 151.19GB | 4.21 | 231999 | 0 | 0 | 14 | 0 |
| 04 | 255062 | 4.16 | 148.42GB | 4.13 | 295331 | 0 | 0 | 70 | 0 |
| 05 | 272458 | 4.45 | 150.68GB | 4.19 | 332939 | 0 | 0 | 62 | 0 |
| 06 | 303751 | 4.96 | 147.23GB | 4.10 | 387418 | 0 | 0 | 78 | 0 |
| 07 | 271411 | 4.43 | 147.13GB | 4.09 | 334724 | 0 | 0 | 57 | 0 |
| 08 | 249975 | 4.08 | 147.03GB | 4.09 | 286595 | 0 | 0 | 38 | 0 |
| 09 | 244726 | 4.00 | 145.32GB | 4.04 | 281503 | 0 | 0 | 29 | 0 |
| 10 | 242663 | 3.96 | 148.37GB | 4.13 | 267853 | 0 | 0 | 10 | 0 |
| 11 | 233503 | 3.81 | 149.66GB | 4.16 | 244327 | 0 | 0 | 14 | 0 |
| 12 | 220739 | 3.60 | 147.00GB | 4.09 | 230184 | 0 | 0 | 16 | 0 |
| 13 | 242437 | 3.96 | 158.95GB | 4.42 | 250648 | 0 | 0 | 9 | 0 |
| 14 | 239490 | 3.91 | 157.79GB | 4.39 | 246611 | 0 | 0 | 13 | 0 |
| 15 | 247212 | 4.04 | 160.38GB | 4.46 | 255819 | 0 | 0 | 12 | 0 |
| 16 | 240263 | 3.92 | 154.30GB | 4.29 | 256492 | 0 | 0 | 17 | 0 |
| 17 | 265403 | 4.33 | 150.99GB | 4.20 | 306921 | 0 | 0 | 58 | 0 |
| 18 | 340126 | 5.55 | 145.13GB | 4.04 | 463879 | 0 | 0 | 218 | 0 |
| 19 | 263953 | 4.31 | 147.90GB | 4.11 | 313590 | 0 | 0 | 38 | 0 |
| 20 | 292725 | 4.78 | 144.35GB | 4.02 | 378312 | 0 | 0 | 79 | 0 |
| 21 | 298173 | 4.87 | 148.57GB | 4.13 | 382555 | 0 | 0 | 133 | 0 |
| 22 | 250715 | 4.09 | 151.75GB | 4.22 | 286150 | 0 | 0 | 35 | 0 |
| 23 | 252863 | 4.13 | 146.17GB | 4.07 | 295029 | 0 | 0 | 64 | 0 |
| Total | 6125583 | 100.00 | 3.51TB | 100.00 | 7020038 | 0 | 0 | 1088 | 0 |
 |
| Outgoing Feed (+ Top1000 #) | Accepted | %Acc | %Tot | Art/sec | Volume | %Vol | KB/art | Dups | Rejs | % Ratio (Out/In) | ||
|---|---|---|---|---|---|---|---|---|---|---|---|---|
| 1 | 217.73.144.40 | 0 | 0.00 | 0.00 | 0.00 | 0.00KB | 0.00 | 0.00 | 5794768 | 0 | … | |
| Total | 0 | 0.00 | 0.00 | 0.00 | 0.00KB | 0.00 | 0.00 | 5794768 | 0 | |||
 |
| Outgoing Feed (+ Top1000 #) | Volume | %Vol | Kbps | Accepted | %Acc | %Tot | KB/art | Dups | Rejs | % Ratio (Out/In) | ||
|---|---|---|---|---|---|---|---|---|---|---|---|---|
| 1 | 217.73.144.40 | 0.00KB | 0.00 | 0.00 | 0 | 0.00 | 0.00 | 0.00 | 5794768 | 0 | … | |
| Total | 0.00KB | 0.00 | 0.00 | 0 | 0.00 | 0.00 | 0.00 | 5794768 | 0 | |||
 |
| Outgoing Feed (+ Top1000 #) | Rej. Vol. | %Vol | Kbps | Accepted | %Acc | %Tot | KB/art | Dups | Rejs | % Ratio (Out/In) | ||
|---|---|---|---|---|---|---|---|---|---|---|---|---|
| 1 | 217.73.144.40 | 0.00KB | 0.00 | 0.00 | 0 | 0.00 | 0.00 | 0.00 | 5794768 | 0 | … | |
| Total | 0.00KB | 0.00 | 0.00 | 0 | 0.00 | 0.00 | 0.00 | 5794768 | 0 | |||
 |
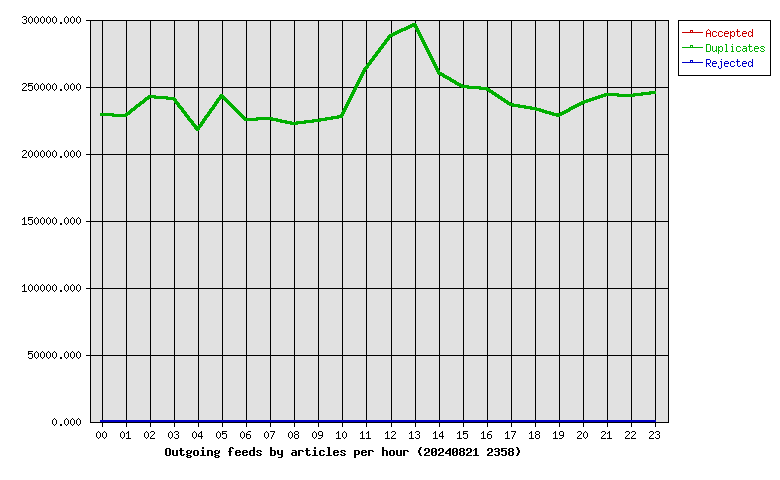
| Hour | Accepted | %Acc | Volume | %Vol | dups | Rejs |
|---|---|---|---|---|---|---|
| 00 | 0 | 0.00 | 0.00KB | 0.00 | 228401 | 0 |
| 01 | 0 | 0.00 | 0.00KB | 0.00 | 228344 | 0 |
| 02 | 0 | 0.00 | 0.00KB | 0.00 | 242343 | 0 |
| 03 | 0 | 0.00 | 0.00KB | 0.00 | 240522 | 0 |
| 04 | 0 | 0.00 | 0.00KB | 0.00 | 217879 | 0 |
| 05 | 0 | 0.00 | 0.00KB | 0.00 | 243132 | 0 |
| 06 | 0 | 0.00 | 0.00KB | 0.00 | 224974 | 0 |
| 07 | 0 | 0.00 | 0.00KB | 0.00 | 225471 | 0 |
| 08 | 0 | 0.00 | 0.00KB | 0.00 | 222085 | 0 |
| 09 | 0 | 0.00 | 0.00KB | 0.00 | 223989 | 0 |
| 10 | 0 | 0.00 | 0.00KB | 0.00 | 227508 | 0 |
| 11 | 0 | 0.00 | 0.00KB | 0.00 | 263080 | 0 |
| 12 | 0 | 0.00 | 0.00KB | 0.00 | 287363 | 0 |
| 13 | 0 | 0.00 | 0.00KB | 0.00 | 296102 | 0 |
| 14 | 0 | 0.00 | 0.00KB | 0.00 | 260055 | 0 |
| 15 | 0 | 0.00 | 0.00KB | 0.00 | 249270 | 0 |
| 16 | 0 | 0.00 | 0.00KB | 0.00 | 247881 | 0 |
| 17 | 0 | 0.00 | 0.00KB | 0.00 | 236096 | 0 |
| 18 | 0 | 0.00 | 0.00KB | 0.00 | 233482 | 0 |
| 19 | 0 | 0.00 | 0.00KB | 0.00 | 227839 | 0 |
| 20 | 0 | 0.00 | 0.00KB | 0.00 | 237670 | 0 |
| 21 | 0 | 0.00 | 0.00KB | 0.00 | 243788 | 0 |
| 22 | 0 | 0.00 | 0.00KB | 0.00 | 242628 | 0 |
| 23 | 0 | 0.00 | 0.00KB | 0.00 | 244866 | 0 |
| Total | 0 | 0.00 | 0.00KB | 0.00 | 5794768 | 0 |
 |
| >= 20% Full | >= 35% Full | >= 50% Full | >= 65% Full | >= 80% Full | >= 95% Full |
| Outgoing Feed | Batch Seq | Batch Num | Batch Max | %Full | Av. Pending |
|---|---|---|---|---|---|
| nbr.elbracht.net-o | 979999-980080 | 81 | 500 | 16 | 0.0 |
| text-spool-out | 0-0 | 0 | 500 | 0 | 0.0 |
| 1st Time | Last Time | # Msgs | Message |
|---|---|---|---|
| 09:51:46 | 1 | DNS Fwd/Rev mismatch: visit.keznews.com/194.165.16.76 |