| |
DIABLO statistics for newsfeed.yoursite.com on Tue 20 Aug 2024 |
Generated on 20240820 2358 by feeder-stats v4.006. Copyright © 2002 The Diablo Project.
Diablo running processes:  81    Dnewslink running processes:  0


11:59PM  up 184 days,  7:18, 0 users, load averages: 1.10, 0.59, 0.51

Filesystem     Size    Used   Avail Capacity  Mounted on
/dev/da0s1g     94G    1.2G     85G     1%    /news
/dev/da1       7.3T    5.8T    924G    87%    /news2/spool/news/00
/dev/da2       7.3T    5.8T    922G    87%    /news2/spool/news/01
/dev/da3       3.7T    3.3T     63G    98%    /news2/spool/news/02
/dev/da4       5.5T    2.9T    2.1T    58%    /news2/spool/news/03
/dev/da8       7.3T    5.8T    926G    86%    /news2/spool/news/04
/dev/da9       7.3T    5.8T    922G    87%    /news2/spool/news/05
/dev/da10      7.3T    5.8T    927G    86%    /news2/spool/news/06
/dev/da11      5.5T      5T     62G    99%    /news2/spool/news/07
/dev/da12      5.5T    4.3T    728G    86%    /news2/spool/news/08
/dev/da13      7.3T    5.8T    926G    86%    /news2/spool/news/09
/dev/da14      7.3T    5.8T    931G    86%    /news2/spool/news/10
/dev/da15      7.3T    5.8T    922G    87%    /news2/spool/news/11
/dev/da16      7.3T    5.8T    924G    87%    /news2/spool/news/12
/dev/da17      7.3T    5.8T    925G    86%    /news2/spool/news/13
/dev/da18      7.3T    5.8T    927G    86%    /news2/spool/news/14
/dev/da19      7.3T    5.8T    925G    86%    /news2/spool/news/15
/dev/da20      7.3T    5.8T    924G    87%    /news2/spool/news/16
/dev/da21      7.3T    5.8T    922G    87%    /news2/spool/news/17
/dev/da22      7.3T    5.8T    923G    87%    /news2/spool/news/18
/dev/da23      7.3T    5.8T    928G    86%    /news2/spool/news/19
/dev/da24      7.3T    5.8T    923G    87%    /news2/spool/news/20
/dev/da25      7.3T    5.8T    923G    87%    /news2/spool/news/21
/dev/da26      7.3T    5.8T    926G    86%    /news2/spool/news/22
/dev/da5       221G     34G    169G    17%    /news1
/dev/md0        40G     13G     22G    38%    /news3
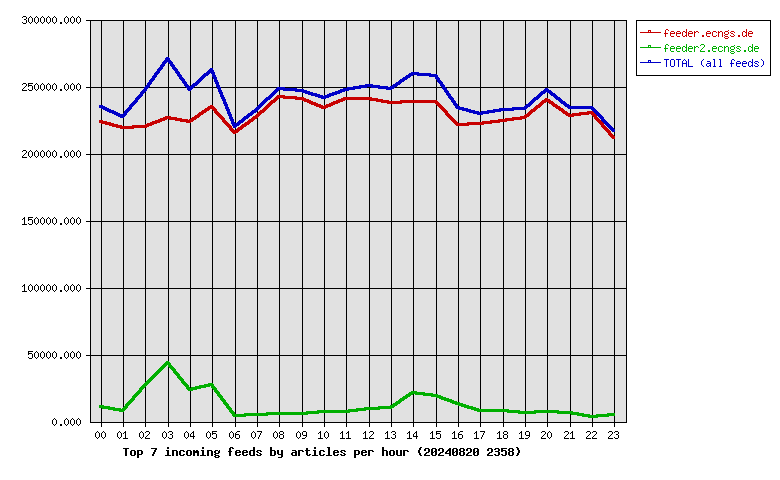
| Incoming Feed (+ Top1000 #) | Accepted | %Acc | %Tot | Art/sec | Volume | %Vol | KB/art | Check | Ihave | Spam | TooOld | Rejs | Errs | ||
|---|---|---|---|---|---|---|---|---|---|---|---|---|---|---|---|
| 1 | feeder.ecngs.de | 5508672 | 94.70 | 94.99 | 63.76 | 3.62TB | 99.95 | 706.21 | 5816542 | 0 | 0 | 0 | 272 | 0 | |
| 2 | feeder2.ecngs.de | 290303 | 90.54 | 5.01 | 3.37 | 1.86GB | 0.05 | 6.74 | 320472 | 0 | 0 | 0 | 173 | 0 | |
| Total | 5798975 | 0.00 | 100.00 | 67.13 | 3.62TB | 100.00 | 671.20 | 6137014 | 0 | 0 | 0 | 445 | 0 | ||
 |
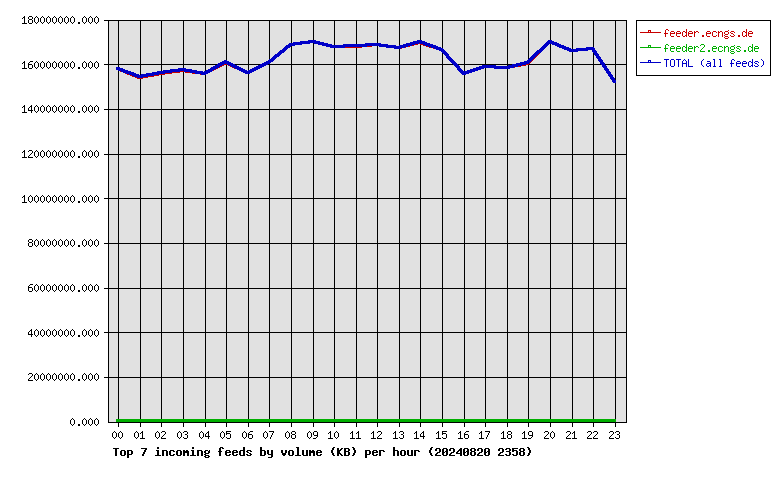
| Incoming Feed (+ Top1000 #) | Volume | %Vol | Kbps | Accepted | %Acc | %Tot | KB/art | Check | Ihave | Spam | TooOld | Rejs | Errs | ||
|---|---|---|---|---|---|---|---|---|---|---|---|---|---|---|---|
| 1 | feeder.ecngs.de | 3.62TB | 99.95 | 360211.97 | 5508672 | 94.70 | 94.99 | 706.21 | 5816542 | 0 | 0 | 0 | 272 | 0 | |
| 2 | feeder2.ecngs.de | 1.86GB | 0.05 | 181.73 | 290303 | 90.54 | 5.01 | 6.74 | 320472 | 0 | 0 | 0 | 173 | 0 | |
| Total | 3.62TB | 100.00 | 360393.70 | 5798975 | 0.00 | 100.00 | 671.20 | 6137014 | 0 | 0 | 0 | 445 | 0 | ||
 |
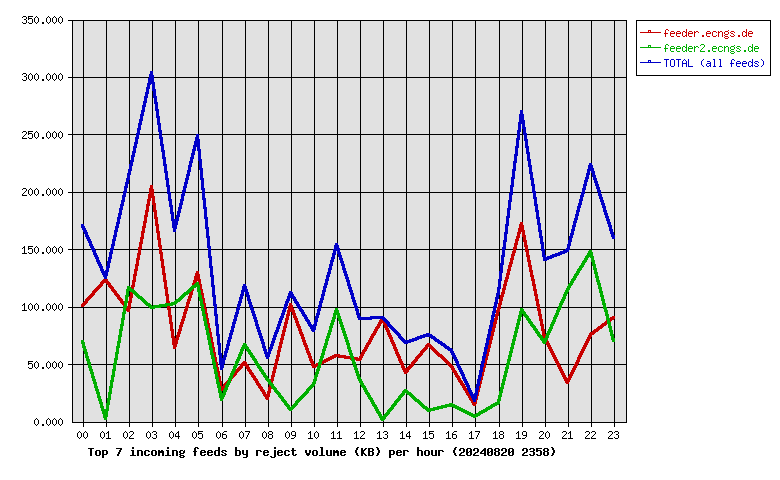
| Incoming Feed (+ Top1000 #) | Rej. Vol. | %Vol | Kbps | Accepted | %Acc | %Tot | KB/art | Check | Ihave | Spam | TooOld | Rejs | Errs | ||
|---|---|---|---|---|---|---|---|---|---|---|---|---|---|---|---|
| 1 | feeder.ecngs.de | 1.83MB | 57.71 | 0.17 | 5508672 | 94.70 | 94.99 | 706.21 | 5816542 | 0 | 0 | 0 | 272 | 0 | |
| 2 | feeder2.ecngs.de | 1.34MB | 42.29 | 0.13 | 290303 | 90.54 | 5.01 | 6.74 | 320472 | 0 | 0 | 0 | 173 | 0 | |
| Total | 3.17MB | 100.00 | 0.30 | 5798975 | 0.00 | 100.00 | 671.20 | 6137014 | 0 | 0 | 0 | 445 | 0 | ||
 |
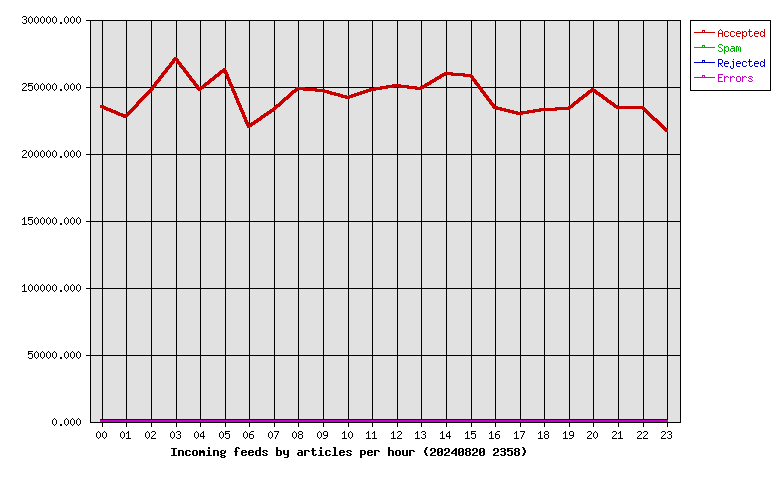
| Hour | Accepted | %Acc | Volume | %Vol | Check | Ihave | Spam | Rejs | Errs |
|---|---|---|---|---|---|---|---|---|---|
| 00 | 234637 | 4.05 | 150.61GB | 4.06 | 247369 | 0 | 0 | 21 | 0 |
| 01 | 226946 | 3.91 | 146.91GB | 3.96 | 235100 | 0 | 0 | 14 | 0 |
| 02 | 246779 | 4.26 | 148.74GB | 4.01 | 277284 | 0 | 0 | 28 | 0 |
| 03 | 270252 | 4.66 | 150.03GB | 4.04 | 316426 | 0 | 0 | 74 | 0 |
| 04 | 247081 | 4.26 | 148.34GB | 4.00 | 277796 | 0 | 0 | 33 | 0 |
| 05 | 262116 | 4.52 | 153.34GB | 4.13 | 301766 | 0 | 0 | 46 | 0 |
| 06 | 219719 | 3.79 | 148.72GB | 4.01 | 224712 | 0 | 0 | 5 | 0 |
| 07 | 232603 | 4.01 | 153.24GB | 4.13 | 238273 | 0 | 0 | 15 | 0 |
| 08 | 247782 | 4.27 | 160.90GB | 4.33 | 254501 | 0 | 0 | 6 | 0 |
| 09 | 246696 | 4.25 | 162.25GB | 4.37 | 253464 | 0 | 0 | 11 | 0 |
| 10 | 241357 | 4.16 | 159.78GB | 4.30 | 249647 | 0 | 0 | 8 | 0 |
| 11 | 247391 | 4.27 | 160.18GB | 4.32 | 255052 | 0 | 0 | 14 | 0 |
| 12 | 250108 | 4.31 | 160.66GB | 4.33 | 260150 | 0 | 0 | 18 | 0 |
| 13 | 247957 | 4.28 | 159.42GB | 4.29 | 260219 | 0 | 0 | 20 | 0 |
| 14 | 259171 | 4.47 | 161.89GB | 4.36 | 282927 | 0 | 0 | 21 | 0 |
| 15 | 257513 | 4.44 | 158.85GB | 4.28 | 277929 | 0 | 0 | 15 | 0 |
| 16 | 234219 | 4.04 | 148.42GB | 4.00 | 249491 | 0 | 0 | 13 | 0 |
| 17 | 229650 | 3.96 | 151.53GB | 4.08 | 238113 | 0 | 0 | 6 | 0 |
| 18 | 232207 | 4.00 | 150.97GB | 4.07 | 240899 | 0 | 0 | 15 | 0 |
| 19 | 233234 | 4.02 | 152.88GB | 4.12 | 240567 | 0 | 0 | 17 | 0 |
| 20 | 247149 | 4.26 | 162.00GB | 4.36 | 254871 | 0 | 0 | 8 | 0 |
| 21 | 233829 | 4.03 | 158.28GB | 4.26 | 240637 | 0 | 0 | 10 | 0 |
| 22 | 234111 | 4.04 | 158.96GB | 4.28 | 238332 | 0 | 0 | 13 | 0 |
| 23 | 216468 | 3.73 | 145.04GB | 3.91 | 221489 | 0 | 0 | 14 | 0 |
| Total | 5798975 | 100.00 | 3.62TB | 100.00 | 6137014 | 0 | 0 | 445 | 0 |
 |
| Outgoing Feed (+ Top1000 #) | Accepted | %Acc | %Tot | Art/sec | Volume | %Vol | KB/art | Dups | Rejs | % Ratio (Out/In) | ||
|---|---|---|---|---|---|---|---|---|---|---|---|---|
| 1 | 217.73.144.40 | 0 | 0.00 | 0.00 | 0.00 | 0.00KB | 0.00 | 0.00 | 5829643 | 0 | … | |
| Total | 0 | 0.00 | 0.00 | 0.00 | 0.00KB | 0.00 | 0.00 | 5829643 | 0 | |||
 |
| Outgoing Feed (+ Top1000 #) | Volume | %Vol | Kbps | Accepted | %Acc | %Tot | KB/art | Dups | Rejs | % Ratio (Out/In) | ||
|---|---|---|---|---|---|---|---|---|---|---|---|---|
| 1 | 217.73.144.40 | 0.00KB | 0.00 | 0.00 | 0 | 0.00 | 0.00 | 0.00 | 5829643 | 0 | … | |
| Total | 0.00KB | 0.00 | 0.00 | 0 | 0.00 | 0.00 | 0.00 | 5829643 | 0 | |||
 |
| Outgoing Feed (+ Top1000 #) | Rej. Vol. | %Vol | Kbps | Accepted | %Acc | %Tot | KB/art | Dups | Rejs | % Ratio (Out/In) | ||
|---|---|---|---|---|---|---|---|---|---|---|---|---|
| 1 | 217.73.144.40 | 0.00KB | 0.00 | 0.00 | 0 | 0.00 | 0.00 | 0.00 | 5829643 | 0 | … | |
| Total | 0.00KB | 0.00 | 0.00 | 0 | 0.00 | 0.00 | 0.00 | 5829643 | 0 | |||
 |
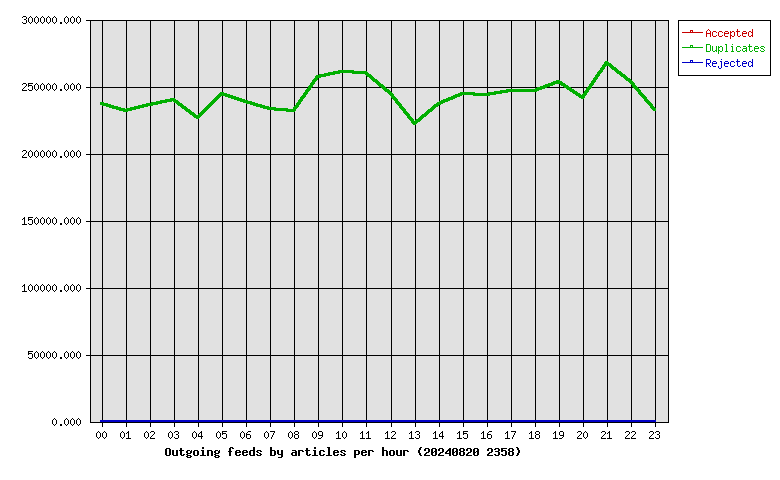
| Hour | Accepted | %Acc | Volume | %Vol | dups | Rejs |
|---|---|---|---|---|---|---|
| 00 | 0 | 0.00 | 0.00KB | 0.00 | 236613 | 0 |
| 01 | 0 | 0.00 | 0.00KB | 0.00 | 231589 | 0 |
| 02 | 0 | 0.00 | 0.00KB | 0.00 | 236506 | 0 |
| 03 | 0 | 0.00 | 0.00KB | 0.00 | 240204 | 0 |
| 04 | 0 | 0.00 | 0.00KB | 0.00 | 226684 | 0 |
| 05 | 0 | 0.00 | 0.00KB | 0.00 | 244144 | 0 |
| 06 | 0 | 0.00 | 0.00KB | 0.00 | 238418 | 0 |
| 07 | 0 | 0.00 | 0.00KB | 0.00 | 232880 | 0 |
| 08 | 0 | 0.00 | 0.00KB | 0.00 | 231917 | 0 |
| 09 | 0 | 0.00 | 0.00KB | 0.00 | 256742 | 0 |
| 10 | 0 | 0.00 | 0.00KB | 0.00 | 260732 | 0 |
| 11 | 0 | 0.00 | 0.00KB | 0.00 | 259917 | 0 |
| 12 | 0 | 0.00 | 0.00KB | 0.00 | 244745 | 0 |
| 13 | 0 | 0.00 | 0.00KB | 0.00 | 222381 | 0 |
| 14 | 0 | 0.00 | 0.00KB | 0.00 | 236892 | 0 |
| 15 | 0 | 0.00 | 0.00KB | 0.00 | 244468 | 0 |
| 16 | 0 | 0.00 | 0.00KB | 0.00 | 243934 | 0 |
| 17 | 0 | 0.00 | 0.00KB | 0.00 | 246337 | 0 |
| 18 | 0 | 0.00 | 0.00KB | 0.00 | 246459 | 0 |
| 19 | 0 | 0.00 | 0.00KB | 0.00 | 253373 | 0 |
| 20 | 0 | 0.00 | 0.00KB | 0.00 | 241618 | 0 |
| 21 | 0 | 0.00 | 0.00KB | 0.00 | 267277 | 0 |
| 22 | 0 | 0.00 | 0.00KB | 0.00 | 253060 | 0 |
| 23 | 0 | 0.00 | 0.00KB | 0.00 | 232753 | 0 |
| Total | 0 | 0.00 | 0.00KB | 0.00 | 5829643 | 0 |
 |
| >= 20% Full | >= 35% Full | >= 50% Full | >= 65% Full | >= 80% Full | >= 95% Full |
| Outgoing Feed | Batch Seq | Batch Num | Batch Max | %Full | Av. Pending |
|---|---|---|---|---|---|
| nbr.elbracht.net-o | 979711-979792 | 81 | 500 | 16 | 0.0 |
| text-spool-out | 0-0 | 0 | 500 | 0 | 0.0 |
| 1st Time | Last Time | # Msgs | Message |
|---|---|---|---|
| 01:22:35 | 01:22:45 | 3 | DNS Fwd/Rev mismatch: lookup of scanner-06.ch1.censys-scanner.com failed |