| |
DIABLO statistics for newsfeed.yoursite.com on Mon 19 Aug 2024 |
Generated on 20240819 2358 by feeder-stats v4.006. Copyright © 2002 The Diablo Project.
Diablo running processes:  81    Dnewslink running processes:  0


11:59PM  up 183 days,  7:18, 0 users, load averages: 2.31, 1.98, 1.72

Filesystem     Size    Used   Avail Capacity  Mounted on
/dev/da0s1g     94G    1.2G     85G     1%    /news
/dev/da1       7.3T    5.8T    931G    86%    /news2/spool/news/00
/dev/da2       7.3T    5.8T    930G    86%    /news2/spool/news/01
/dev/da3       3.7T    3.3T     66G    98%    /news2/spool/news/02
/dev/da4       5.5T    2.9T    2.1T    58%    /news2/spool/news/03
/dev/da8       7.3T    5.8T    934G    86%    /news2/spool/news/04
/dev/da9       7.3T    5.8T    929G    86%    /news2/spool/news/05
/dev/da10      7.3T    5.8T    934G    86%    /news2/spool/news/06
/dev/da11      5.5T      5T     65G    99%    /news2/spool/news/07
/dev/da12      5.5T    4.3T    734G    86%    /news2/spool/news/08
/dev/da13      7.3T    5.8T    940G    86%    /news2/spool/news/09
/dev/da14      7.3T    5.8T    931G    86%    /news2/spool/news/10
/dev/da15      7.3T    5.8T    929G    86%    /news2/spool/news/11
/dev/da16      7.3T    5.8T    933G    86%    /news2/spool/news/12
/dev/da17      7.3T    5.8T    931G    86%    /news2/spool/news/13
/dev/da18      7.3T    5.8T    934G    86%    /news2/spool/news/14
/dev/da19      7.3T    5.8T    932G    86%    /news2/spool/news/15
/dev/da20      7.3T    5.8T    932G    86%    /news2/spool/news/16
/dev/da21      7.3T    5.8T    930G    86%    /news2/spool/news/17
/dev/da22      7.3T    5.8T    932G    86%    /news2/spool/news/18
/dev/da23      7.3T    5.8T    935G    86%    /news2/spool/news/19
/dev/da24      7.3T    5.8T    931G    86%    /news2/spool/news/20
/dev/da25      7.3T    5.8T    930G    86%    /news2/spool/news/21
/dev/da26      7.3T    5.8T    933G    86%    /news2/spool/news/22
/dev/da5       221G     36G    167G    18%    /news1
/dev/md0        40G     14G     21G    40%    /news3
| Incoming Feed (+ Top1000 #) | Accepted | %Acc | %Tot | Art/sec | Volume | %Vol | KB/art | Check | Ihave | Spam | TooOld | Rejs | Errs | ||
|---|---|---|---|---|---|---|---|---|---|---|---|---|---|---|---|
| 1 | feeder.ecngs.de | 5373747 | 94.35 | 94.64 | 62.20 | 3.52TB | 99.93 | 703.05 | 5695336 | 0 | 0 | 0 | 311 | 0 | |
| 2 | feeder2.ecngs.de | 304141 | 91.65 | 5.36 | 3.52 | 2.60GB | 0.07 | 8.97 | 331646 | 0 | 0 | 0 | 211 | 0 | |
| Total | 5677888 | 0.00 | 100.00 | 65.72 | 3.52TB | 100.00 | 665.87 | 6026982 | 0 | 0 | 0 | 522 | 0 | ||
 |
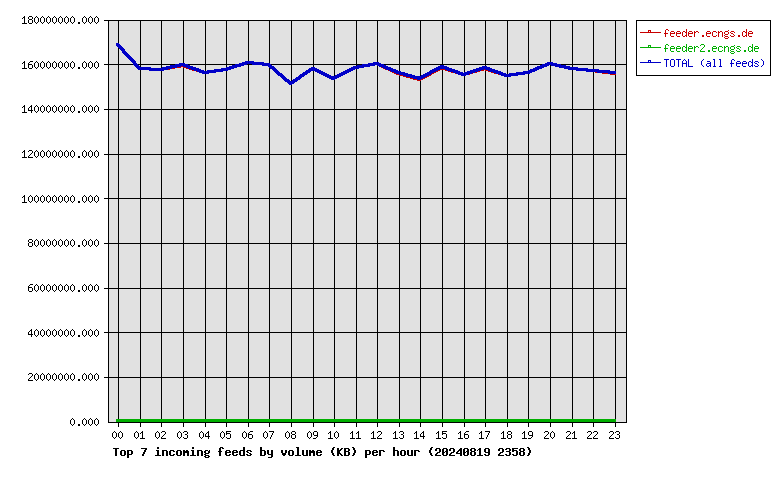
| Incoming Feed (+ Top1000 #) | Volume | %Vol | Kbps | Accepted | %Acc | %Tot | KB/art | Check | Ihave | Spam | TooOld | Rejs | Errs | ||
|---|---|---|---|---|---|---|---|---|---|---|---|---|---|---|---|
| 1 | feeder.ecngs.de | 3.52TB | 99.93 | 349817.78 | 5373747 | 94.35 | 94.64 | 703.05 | 5695336 | 0 | 0 | 0 | 311 | 0 | |
| 2 | feeder2.ecngs.de | 2.60GB | 0.07 | 252.61 | 304141 | 91.65 | 5.36 | 8.97 | 331646 | 0 | 0 | 0 | 211 | 0 | |
| Total | 3.52TB | 100.00 | 350070.39 | 5677888 | 0.00 | 100.00 | 665.87 | 6026982 | 0 | 0 | 0 | 522 | 0 | ||
 |
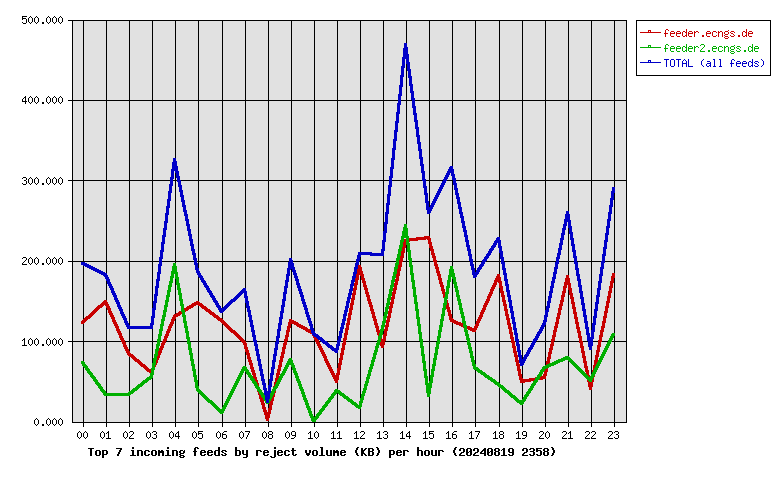
| Incoming Feed (+ Top1000 #) | Rej. Vol. | %Vol | Kbps | Accepted | %Acc | %Tot | KB/art | Check | Ihave | Spam | TooOld | Rejs | Errs | ||
|---|---|---|---|---|---|---|---|---|---|---|---|---|---|---|---|
| 1 | feeder.ecngs.de | 2.80MB | 63.06 | 0.27 | 5373747 | 94.35 | 94.64 | 703.05 | 5695336 | 0 | 0 | 0 | 311 | 0 | |
| 2 | feeder2.ecngs.de | 1.64MB | 36.94 | 0.16 | 304141 | 91.65 | 5.36 | 8.97 | 331646 | 0 | 0 | 0 | 211 | 0 | |
| Total | 4.43MB | 100.00 | 0.42 | 5677888 | 0.00 | 100.00 | 665.87 | 6026982 | 0 | 0 | 0 | 522 | 0 | ||
 |
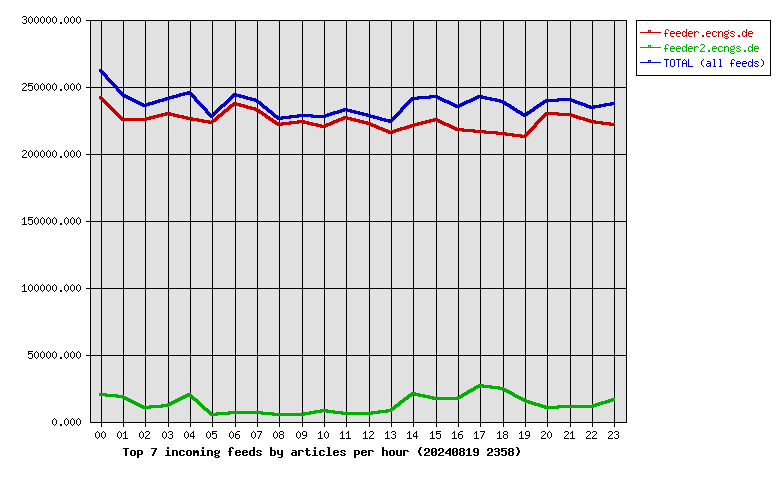
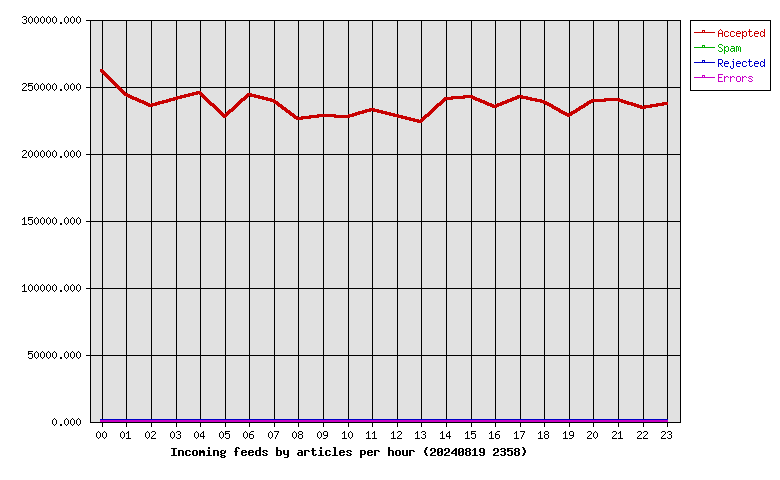
| Hour | Accepted | %Acc | Volume | %Vol | Check | Ihave | Spam | Rejs | Errs |
|---|---|---|---|---|---|---|---|---|---|
| 00 | 261490 | 4.61 | 160.82GB | 4.46 | 284596 | 0 | 0 | 26 | 0 |
| 01 | 243551 | 4.29 | 150.52GB | 4.17 | 264585 | 0 | 0 | 25 | 0 |
| 02 | 235372 | 4.15 | 150.26GB | 4.17 | 247043 | 0 | 0 | 23 | 0 |
| 03 | 240959 | 4.24 | 152.03GB | 4.22 | 254844 | 0 | 0 | 20 | 0 |
| 04 | 245104 | 4.32 | 148.89GB | 4.13 | 268387 | 0 | 0 | 38 | 0 |
| 05 | 227576 | 4.01 | 150.05GB | 4.16 | 237184 | 0 | 0 | 15 | 0 |
| 06 | 243411 | 4.29 | 152.97GB | 4.24 | 250695 | 0 | 0 | 19 | 0 |
| 07 | 238821 | 4.21 | 152.35GB | 4.23 | 245890 | 0 | 0 | 18 | 0 |
| 08 | 225810 | 3.98 | 144.31GB | 4.00 | 231260 | 0 | 0 | 3 | 0 |
| 09 | 228246 | 4.02 | 150.37GB | 4.17 | 233769 | 0 | 0 | 21 | 0 |
| 10 | 227493 | 4.01 | 146.24GB | 4.06 | 236449 | 0 | 0 | 9 | 0 |
| 11 | 232496 | 4.09 | 150.84GB | 4.18 | 238747 | 0 | 0 | 11 | 0 |
| 12 | 227802 | 4.01 | 152.65GB | 4.23 | 234789 | 0 | 0 | 18 | 0 |
| 13 | 223573 | 3.94 | 148.65GB | 4.12 | 232540 | 0 | 0 | 18 | 0 |
| 14 | 241012 | 4.24 | 146.15GB | 4.05 | 265677 | 0 | 0 | 59 | 0 |
| 15 | 242212 | 4.27 | 151.24GB | 4.19 | 259405 | 0 | 0 | 21 | 0 |
| 16 | 234671 | 4.13 | 148.07GB | 4.11 | 254420 | 0 | 0 | 32 | 0 |
| 17 | 241955 | 4.26 | 150.83GB | 4.18 | 270977 | 0 | 0 | 25 | 0 |
| 18 | 238285 | 4.20 | 147.66GB | 4.10 | 266350 | 0 | 0 | 30 | 0 |
| 19 | 227909 | 4.01 | 148.96GB | 4.13 | 245142 | 0 | 0 | 11 | 0 |
| 20 | 239202 | 4.21 | 152.59GB | 4.23 | 250336 | 0 | 0 | 17 | 0 |
| 21 | 239900 | 4.23 | 150.73GB | 4.18 | 253060 | 0 | 0 | 24 | 0 |
| 22 | 234315 | 4.13 | 149.77GB | 4.15 | 246924 | 0 | 0 | 12 | 0 |
| 23 | 236723 | 4.17 | 148.65GB | 4.12 | 253913 | 0 | 0 | 27 | 0 |
| Total | 5677888 | 100.00 | 3.52TB | 100.00 | 6026982 | 0 | 0 | 522 | 0 |
 |
| Outgoing Feed (+ Top1000 #) | Accepted | %Acc | %Tot | Art/sec | Volume | %Vol | KB/art | Dups | Rejs | % Ratio (Out/In) | ||
|---|---|---|---|---|---|---|---|---|---|---|---|---|
| 1 | 217.73.144.40 | 0 | 0.00 | 0.00 | 0.00 | 0.00KB | 0.00 | 0.00 | 5781779 | 0 | … | |
| Total | 0 | 0.00 | 0.00 | 0.00 | 0.00KB | 0.00 | 0.00 | 5781779 | 0 | |||
 |
| Outgoing Feed (+ Top1000 #) | Volume | %Vol | Kbps | Accepted | %Acc | %Tot | KB/art | Dups | Rejs | % Ratio (Out/In) | ||
|---|---|---|---|---|---|---|---|---|---|---|---|---|
| 1 | 217.73.144.40 | 0.00KB | 0.00 | 0.00 | 0 | 0.00 | 0.00 | 0.00 | 5781779 | 0 | … | |
| Total | 0.00KB | 0.00 | 0.00 | 0 | 0.00 | 0.00 | 0.00 | 5781779 | 0 | |||
 |
| Outgoing Feed (+ Top1000 #) | Rej. Vol. | %Vol | Kbps | Accepted | %Acc | %Tot | KB/art | Dups | Rejs | % Ratio (Out/In) | ||
|---|---|---|---|---|---|---|---|---|---|---|---|---|
| 1 | 217.73.144.40 | 0.00KB | 0.00 | 0.00 | 0 | 0.00 | 0.00 | 0.00 | 5781779 | 0 | … | |
| Total | 0.00KB | 0.00 | 0.00 | 0 | 0.00 | 0.00 | 0.00 | 5781779 | 0 | |||
 |
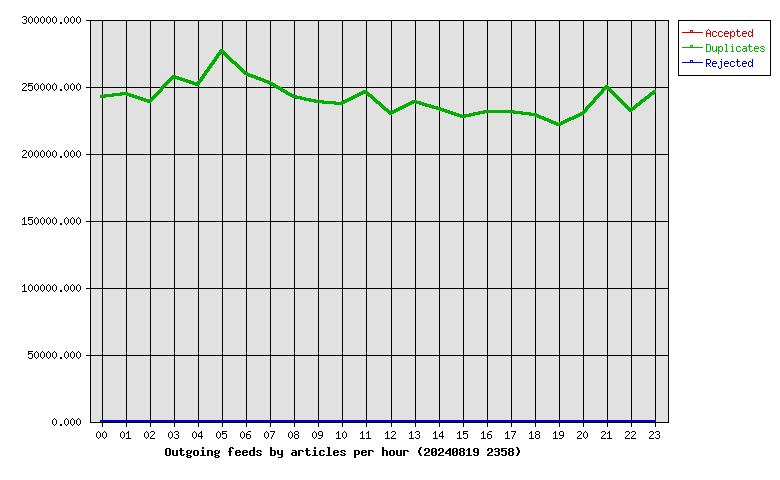
| Hour | Accepted | %Acc | Volume | %Vol | dups | Rejs |
|---|---|---|---|---|---|---|
| 00 | 0 | 0.00 | 0.00KB | 0.00 | 242003 | 0 |
| 01 | 0 | 0.00 | 0.00KB | 0.00 | 244338 | 0 |
| 02 | 0 | 0.00 | 0.00KB | 0.00 | 238262 | 0 |
| 03 | 0 | 0.00 | 0.00KB | 0.00 | 257276 | 0 |
| 04 | 0 | 0.00 | 0.00KB | 0.00 | 250817 | 0 |
| 05 | 0 | 0.00 | 0.00KB | 0.00 | 276214 | 0 |
| 06 | 0 | 0.00 | 0.00KB | 0.00 | 259127 | 0 |
| 07 | 0 | 0.00 | 0.00KB | 0.00 | 252368 | 0 |
| 08 | 0 | 0.00 | 0.00KB | 0.00 | 242498 | 0 |
| 09 | 0 | 0.00 | 0.00KB | 0.00 | 238197 | 0 |
| 10 | 0 | 0.00 | 0.00KB | 0.00 | 236928 | 0 |
| 11 | 0 | 0.00 | 0.00KB | 0.00 | 246223 | 0 |
| 12 | 0 | 0.00 | 0.00KB | 0.00 | 229399 | 0 |
| 13 | 0 | 0.00 | 0.00KB | 0.00 | 238197 | 0 |
| 14 | 0 | 0.00 | 0.00KB | 0.00 | 233339 | 0 |
| 15 | 0 | 0.00 | 0.00KB | 0.00 | 226950 | 0 |
| 16 | 0 | 0.00 | 0.00KB | 0.00 | 230757 | 0 |
| 17 | 0 | 0.00 | 0.00KB | 0.00 | 231010 | 0 |
| 18 | 0 | 0.00 | 0.00KB | 0.00 | 228948 | 0 |
| 19 | 0 | 0.00 | 0.00KB | 0.00 | 221494 | 0 |
| 20 | 0 | 0.00 | 0.00KB | 0.00 | 229529 | 0 |
| 21 | 0 | 0.00 | 0.00KB | 0.00 | 249861 | 0 |
| 22 | 0 | 0.00 | 0.00KB | 0.00 | 231871 | 0 |
| 23 | 0 | 0.00 | 0.00KB | 0.00 | 246173 | 0 |
| Total | 0 | 0.00 | 0.00KB | 0.00 | 5781779 | 0 |
 |
| >= 20% Full | >= 35% Full | >= 50% Full | >= 65% Full | >= 80% Full | >= 95% Full |
| Outgoing Feed | Batch Seq | Batch Num | Batch Max | %Full | Av. Pending |
|---|---|---|---|---|---|
| nbr.elbracht.net-o | 979423-979504 | 81 | 500 | 16 | 0.0 |
| text-spool-out | 0-0 | 0 | 500 | 0 | 0.0 |
| 1st Time | Last Time | # Msgs | Message |
|---|---|---|---|
| 14:29:01 | 14:29:09 | 3 | DNS Fwd/Rev mismatch: lookup of scanner-201.hk2.censys-scanner.com failed |
| 06:44:01 | 1 | DNS Fwd/Rev mismatch: internettl.org/104.152.52.230 | |
| 06:43:22 | 1 | DNS Fwd/Rev mismatch: internettl.org/104.152.52.118 |