| |
DIABLO statistics for newsfeed.yoursite.com on Sun 18 Aug 2024 |
Generated on 20240818 2358 by feeder-stats v4.006. Copyright © 2002 The Diablo Project.
Diablo running processes:  81    Dnewslink running processes:  0


11:59PM  up 182 days,  7:18, 0 users, load averages: 0.91, 0.57, 0.54

Filesystem     Size    Used   Avail Capacity  Mounted on
/dev/da0s1g     94G    1.2G     85G     1%    /news
/dev/da1       7.3T    6.6T     86G    99%    /news2/spool/news/00
/dev/da2       7.3T    6.6T     86G    99%    /news2/spool/news/01
/dev/da3       3.7T    3.3T     67G    98%    /news2/spool/news/02
/dev/da4       5.5T    3.5T    1.6T    69%    /news2/spool/news/03
/dev/da8       7.3T    6.6T     90G    99%    /news2/spool/news/04
/dev/da9       7.3T    6.6T     86G    99%    /news2/spool/news/05
/dev/da10      7.3T    6.6T     90G    99%    /news2/spool/news/06
/dev/da11      5.5T      5T     63G    99%    /news2/spool/news/07
/dev/da12      5.5T      5T     63G    99%    /news2/spool/news/08
/dev/da13      7.3T    6.6T     89G    99%    /news2/spool/news/09
/dev/da14      7.3T    6.6T     88G    99%    /news2/spool/news/10
/dev/da15      7.3T    6.6T     85G    99%    /news2/spool/news/11
/dev/da16      7.3T    6.6T     90G    99%    /news2/spool/news/12
/dev/da17      7.3T    6.6T     87G    99%    /news2/spool/news/13
/dev/da18      7.3T    6.6T     90G    99%    /news2/spool/news/14
/dev/da19      7.3T    6.6T     87G    99%    /news2/spool/news/15
/dev/da20      7.3T    6.6T     87G    99%    /news2/spool/news/16
/dev/da21      7.3T    6.6T     86G    99%    /news2/spool/news/17
/dev/da22      7.3T    6.6T     87G    99%    /news2/spool/news/18
/dev/da23      7.3T    6.6T     90G    99%    /news2/spool/news/19
/dev/da24      7.3T    6.6T     88G    99%    /news2/spool/news/20
/dev/da25      7.3T    6.6T     86G    99%    /news2/spool/news/21
/dev/da26      7.3T    6.6T     89G    99%    /news2/spool/news/22
/dev/da5       221G     36G    167G    18%    /news1
/dev/md0        40G     14G     21G    40%    /news3
| Incoming Feed (+ Top1000 #) | Accepted | %Acc | %Tot | Art/sec | Volume | %Vol | KB/art | Check | Ihave | Spam | TooOld | Rejs | Errs | ||
|---|---|---|---|---|---|---|---|---|---|---|---|---|---|---|---|
| 1 | feeder.ecngs.de | 5721409 | 96.56 | 96.76 | 66.22 | 3.73TB | 99.96 | 699.36 | 5925077 | 0 | 0 | 0 | 221 | 0 | |
| 2 | feeder2.ecngs.de | 191820 | 92.02 | 3.24 | 2.24 | 1.62GB | 0.04 | 8.87 | 208295 | 0 | 0 | 0 | 161 | 0 | |
| Total | 5913229 | 0.00 | 100.00 | 68.46 | 3.73TB | 100.00 | 676.96 | 6133372 | 0 | 0 | 0 | 382 | 0 | ||
 |
| Incoming Feed (+ Top1000 #) | Volume | %Vol | Kbps | Accepted | %Acc | %Tot | KB/art | Check | Ihave | Spam | TooOld | Rejs | Errs | ||
|---|---|---|---|---|---|---|---|---|---|---|---|---|---|---|---|
| 1 | feeder.ecngs.de | 3.73TB | 99.96 | 370493.19 | 5721409 | 96.56 | 96.76 | 699.36 | 5925077 | 0 | 0 | 0 | 221 | 0 | |
| 2 | feeder2.ecngs.de | 1.62GB | 0.04 | 158.63 | 191820 | 92.02 | 3.24 | 8.87 | 208295 | 0 | 0 | 0 | 161 | 0 | |
| Total | 3.73TB | 100.00 | 370651.82 | 5913229 | 0.00 | 100.00 | 676.96 | 6133372 | 0 | 0 | 0 | 382 | 0 | ||
 |
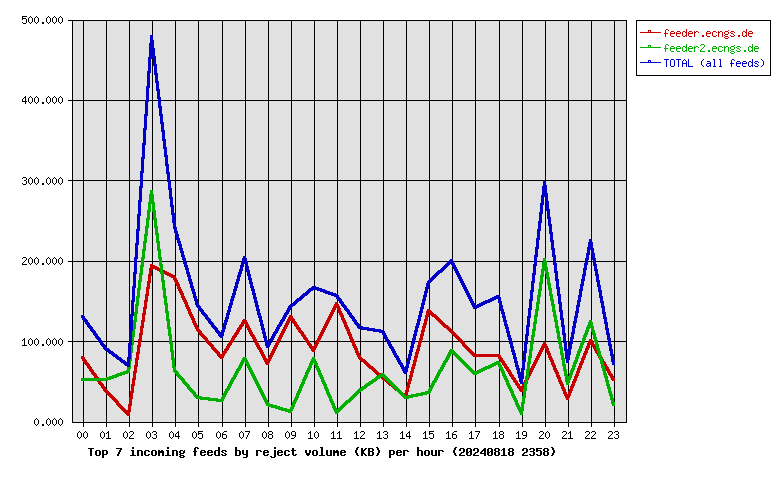
| Incoming Feed (+ Top1000 #) | Rej. Vol. | %Vol | Kbps | Accepted | %Acc | %Tot | KB/art | Check | Ihave | Spam | TooOld | Rejs | Errs | ||
|---|---|---|---|---|---|---|---|---|---|---|---|---|---|---|---|
| 1 | feeder.ecngs.de | 2.09MB | 58.02 | 0.20 | 5721409 | 96.56 | 96.76 | 699.36 | 5925077 | 0 | 0 | 0 | 221 | 0 | |
| 2 | feeder2.ecngs.de | 1.51MB | 41.98 | 0.14 | 191820 | 92.02 | 3.24 | 8.87 | 208295 | 0 | 0 | 0 | 161 | 0 | |
| Total | 3.61MB | 100.00 | 0.34 | 5913229 | 0.00 | 100.00 | 676.96 | 6133372 | 0 | 0 | 0 | 382 | 0 | ||
 |
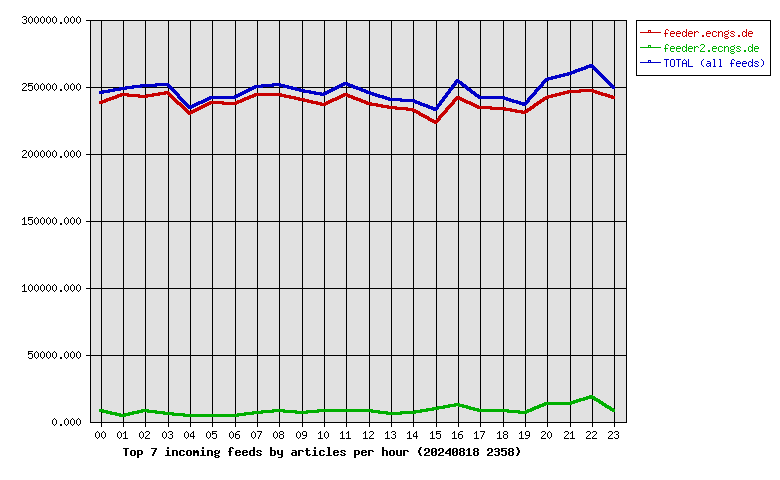
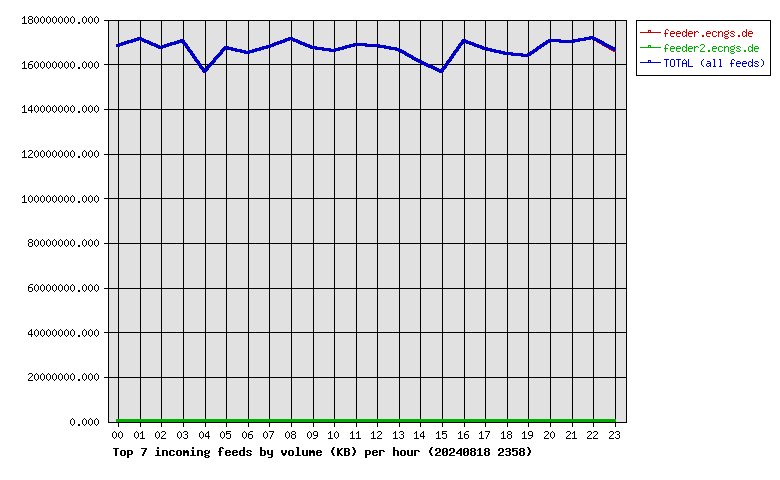
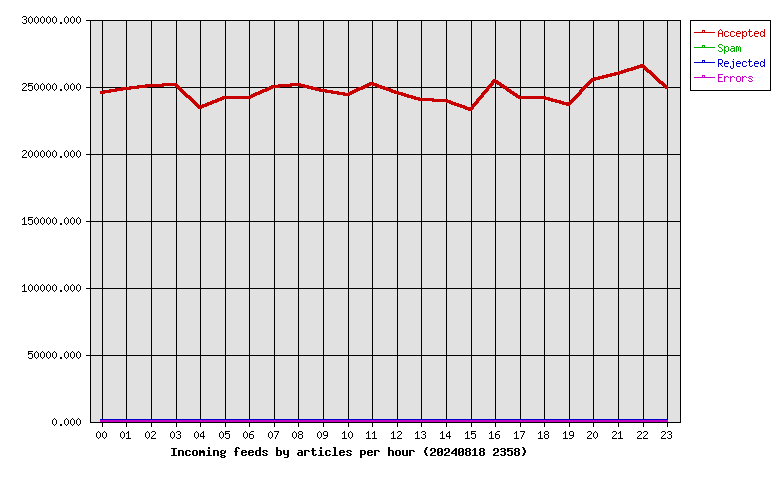
| Hour | Accepted | %Acc | Volume | %Vol | Check | Ihave | Spam | Rejs | Errs |
|---|---|---|---|---|---|---|---|---|---|
| 00 | 245157 | 4.15 | 160.42GB | 4.20 | 252891 | 0 | 0 | 20 | 0 |
| 01 | 247944 | 4.19 | 163.20GB | 4.28 | 252844 | 0 | 0 | 7 | 0 |
| 02 | 250236 | 4.23 | 159.40GB | 4.18 | 259314 | 0 | 0 | 9 | 0 |
| 03 | 251046 | 4.25 | 162.35GB | 4.25 | 258066 | 0 | 0 | 34 | 0 |
| 04 | 234131 | 3.96 | 149.35GB | 3.91 | 239226 | 0 | 0 | 15 | 0 |
| 05 | 241694 | 4.09 | 159.70GB | 4.18 | 249182 | 0 | 0 | 10 | 0 |
| 06 | 241330 | 4.08 | 157.27GB | 4.12 | 246135 | 0 | 0 | 8 | 0 |
| 07 | 249895 | 4.23 | 160.05GB | 4.19 | 257115 | 0 | 0 | 13 | 0 |
| 08 | 251407 | 4.25 | 163.53GB | 4.28 | 260104 | 0 | 0 | 9 | 0 |
| 09 | 246301 | 4.17 | 159.38GB | 4.17 | 253659 | 0 | 0 | 10 | 0 |
| 10 | 243897 | 4.12 | 158.34GB | 4.15 | 252455 | 0 | 0 | 11 | 0 |
| 11 | 251938 | 4.26 | 160.97GB | 4.22 | 261181 | 0 | 0 | 13 | 0 |
| 12 | 244992 | 4.14 | 160.55GB | 4.21 | 254057 | 0 | 0 | 11 | 0 |
| 13 | 239788 | 4.06 | 158.59GB | 4.15 | 246234 | 0 | 0 | 13 | 0 |
| 14 | 239544 | 4.05 | 153.67GB | 4.03 | 247018 | 0 | 0 | 6 | 0 |
| 15 | 232567 | 3.93 | 149.39GB | 3.91 | 243234 | 0 | 0 | 14 | 0 |
| 16 | 253992 | 4.30 | 162.45GB | 4.26 | 268920 | 0 | 0 | 35 | 0 |
| 17 | 241565 | 4.09 | 159.10GB | 4.17 | 249860 | 0 | 0 | 20 | 0 |
| 18 | 241053 | 4.08 | 156.85GB | 4.11 | 250168 | 0 | 0 | 21 | 0 |
| 19 | 236298 | 4.00 | 156.19GB | 4.09 | 243107 | 0 | 0 | 9 | 0 |
| 20 | 254636 | 4.31 | 162.54GB | 4.26 | 270034 | 0 | 0 | 39 | 0 |
| 21 | 259063 | 4.38 | 162.08GB | 4.25 | 273741 | 0 | 0 | 13 | 0 |
| 22 | 265632 | 4.49 | 163.78GB | 4.29 | 286860 | 0 | 0 | 32 | 0 |
| 23 | 249123 | 4.21 | 158.43GB | 4.15 | 257967 | 0 | 0 | 10 | 0 |
| Total | 5913229 | 100.00 | 3.73TB | 100.00 | 6133372 | 0 | 0 | 382 | 0 |
 |
| Outgoing Feed (+ Top1000 #) | Accepted | %Acc | %Tot | Art/sec | Volume | %Vol | KB/art | Dups | Rejs | % Ratio (Out/In) | ||
|---|---|---|---|---|---|---|---|---|---|---|---|---|
| 1 | 217.73.144.40 | 0 | 0.00 | 0.00 | 0.00 | 0.00KB | 0.00 | 0.00 | 5881862 | 0 | … | |
| Total | 0 | 0.00 | 0.00 | 0.00 | 0.00KB | 0.00 | 0.00 | 5881862 | 0 | |||
 |
| Outgoing Feed (+ Top1000 #) | Volume | %Vol | Kbps | Accepted | %Acc | %Tot | KB/art | Dups | Rejs | % Ratio (Out/In) | ||
|---|---|---|---|---|---|---|---|---|---|---|---|---|
| 1 | 217.73.144.40 | 0.00KB | 0.00 | 0.00 | 0 | 0.00 | 0.00 | 0.00 | 5881862 | 0 | … | |
| Total | 0.00KB | 0.00 | 0.00 | 0 | 0.00 | 0.00 | 0.00 | 5881862 | 0 | |||
 |
| Outgoing Feed (+ Top1000 #) | Rej. Vol. | %Vol | Kbps | Accepted | %Acc | %Tot | KB/art | Dups | Rejs | % Ratio (Out/In) | ||
|---|---|---|---|---|---|---|---|---|---|---|---|---|
| 1 | 217.73.144.40 | 0.00KB | 0.00 | 0.00 | 0 | 0.00 | 0.00 | 0.00 | 5881862 | 0 | … | |
| Total | 0.00KB | 0.00 | 0.00 | 0 | 0.00 | 0.00 | 0.00 | 5881862 | 0 | |||
 |
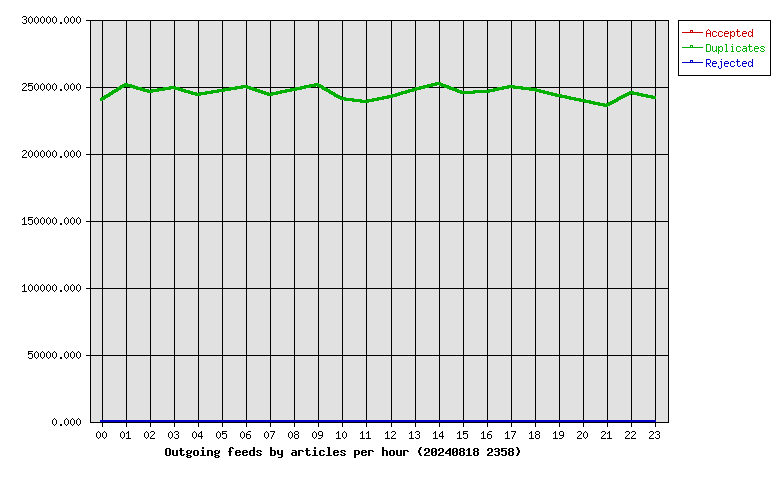
| Hour | Accepted | %Acc | Volume | %Vol | dups | Rejs |
|---|---|---|---|---|---|---|
| 00 | 0 | 0.00 | 0.00KB | 0.00 | 240254 | 0 |
| 01 | 0 | 0.00 | 0.00KB | 0.00 | 251121 | 0 |
| 02 | 0 | 0.00 | 0.00KB | 0.00 | 246103 | 0 |
| 03 | 0 | 0.00 | 0.00KB | 0.00 | 248777 | 0 |
| 04 | 0 | 0.00 | 0.00KB | 0.00 | 244029 | 0 |
| 05 | 0 | 0.00 | 0.00KB | 0.00 | 246443 | 0 |
| 06 | 0 | 0.00 | 0.00KB | 0.00 | 249358 | 0 |
| 07 | 0 | 0.00 | 0.00KB | 0.00 | 243849 | 0 |
| 08 | 0 | 0.00 | 0.00KB | 0.00 | 247450 | 0 |
| 09 | 0 | 0.00 | 0.00KB | 0.00 | 250882 | 0 |
| 10 | 0 | 0.00 | 0.00KB | 0.00 | 241009 | 0 |
| 11 | 0 | 0.00 | 0.00KB | 0.00 | 238130 | 0 |
| 12 | 0 | 0.00 | 0.00KB | 0.00 | 242290 | 0 |
| 13 | 0 | 0.00 | 0.00KB | 0.00 | 247660 | 0 |
| 14 | 0 | 0.00 | 0.00KB | 0.00 | 251577 | 0 |
| 15 | 0 | 0.00 | 0.00KB | 0.00 | 245011 | 0 |
| 16 | 0 | 0.00 | 0.00KB | 0.00 | 246237 | 0 |
| 17 | 0 | 0.00 | 0.00KB | 0.00 | 249276 | 0 |
| 18 | 0 | 0.00 | 0.00KB | 0.00 | 247758 | 0 |
| 19 | 0 | 0.00 | 0.00KB | 0.00 | 242987 | 0 |
| 20 | 0 | 0.00 | 0.00KB | 0.00 | 239426 | 0 |
| 21 | 0 | 0.00 | 0.00KB | 0.00 | 235779 | 0 |
| 22 | 0 | 0.00 | 0.00KB | 0.00 | 245274 | 0 |
| 23 | 0 | 0.00 | 0.00KB | 0.00 | 241182 | 0 |
| Total | 0 | 0.00 | 0.00KB | 0.00 | 5881862 | 0 |
 |
| >= 20% Full | >= 35% Full | >= 50% Full | >= 65% Full | >= 80% Full | >= 95% Full |
| Outgoing Feed | Batch Seq | Batch Num | Batch Max | %Full | Av. Pending |
|---|---|---|---|---|---|
| nbr.elbracht.net-o | 979135-979216 | 81 | 500 | 16 | 0.0 |
| text-spool-out | 0-0 | 0 | 500 | 0 | 0.0 |
| 1st Time | Last Time | # Msgs | Message |
|---|