| |
DIABLO statistics for newsfeed.yoursite.com on Sat 17 Aug 2024 |
Generated on 20240817 2358 by feeder-stats v4.006. Copyright © 2002 The Diablo Project.
Diablo running processes:  81    Dnewslink running processes:  0


11:59PM  up 181 days,  7:18, 0 users, load averages: 1.63, 1.00, 0.88

Filesystem     Size    Used   Avail Capacity  Mounted on
/dev/da0s1g     94G    1.2G     85G     1%    /news
/dev/da1       7.3T    6.6T     84G    99%    /news2/spool/news/00
/dev/da2       7.3T    6.6T     84G    99%    /news2/spool/news/01
/dev/da3       3.7T    3.3T     66G    98%    /news2/spool/news/02
/dev/da4       5.5T    4.0T      1T    80%    /news2/spool/news/03
/dev/da8       7.3T    6.6T     88G    99%    /news2/spool/news/04
/dev/da9       7.3T    6.6T     85G    99%    /news2/spool/news/05
/dev/da10      7.3T    6.6T     88G    99%    /news2/spool/news/06
/dev/da11      5.5T      5T     62G    99%    /news2/spool/news/07
/dev/da12      5.5T    4.9T    104G    98%    /news2/spool/news/08
/dev/da13      7.3T    6.6T     87G    99%    /news2/spool/news/09
/dev/da14      7.3T    6.6T     86G    99%    /news2/spool/news/10
/dev/da15      7.3T    6.6T     83G    99%    /news2/spool/news/11
/dev/da16      7.3T    6.6T     88G    99%    /news2/spool/news/12
/dev/da17      7.3T    6.6T     85G    99%    /news2/spool/news/13
/dev/da18      7.3T    6.6T     89G    99%    /news2/spool/news/14
/dev/da19      7.3T    6.6T     85G    99%    /news2/spool/news/15
/dev/da20      7.3T    6.6T     86G    99%    /news2/spool/news/16
/dev/da21      7.3T    6.6T     85G    99%    /news2/spool/news/17
/dev/da22      7.3T    6.6T     85G    99%    /news2/spool/news/18
/dev/da23      7.3T    6.6T     88G    99%    /news2/spool/news/19
/dev/da24      7.3T    6.6T     86G    99%    /news2/spool/news/20
/dev/da25      7.3T    6.6T     85G    99%    /news2/spool/news/21
/dev/da26      7.3T    6.6T     87G    99%    /news2/spool/news/22
/dev/da5       221G     36G    167G    18%    /news1
/dev/md0        40G     14G     21G    40%    /news3
| Incoming Feed (+ Top1000 #) | Accepted | %Acc | %Tot | Art/sec | Volume | %Vol | KB/art | Check | Ihave | Spam | TooOld | Rejs | Errs | ||
|---|---|---|---|---|---|---|---|---|---|---|---|---|---|---|---|
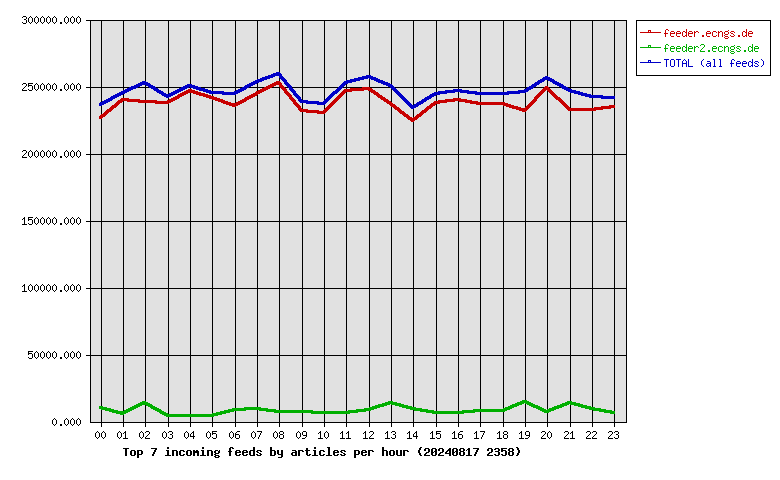
| 1 | feeder.ecngs.de | 5712002 | 96.46 | 96.64 | 66.11 | 3.72TB | 99.96 | 699.13 | 5921706 | 0 | 0 | 0 | 197 | 0 | |
| 2 | feeder2.ecngs.de | 198502 | 91.91 | 3.36 | 2.31 | 1.42GB | 0.04 | 7.49 | 215858 | 0 | 0 | 0 | 120 | 0 | |
| Total | 5910504 | 0.00 | 100.00 | 68.42 | 3.72TB | 100.00 | 675.90 | 6137564 | 0 | 0 | 0 | 317 | 0 | ||
 |
| Incoming Feed (+ Top1000 #) | Volume | %Vol | Kbps | Accepted | %Acc | %Tot | KB/art | Check | Ihave | Spam | TooOld | Rejs | Errs | ||
|---|---|---|---|---|---|---|---|---|---|---|---|---|---|---|---|
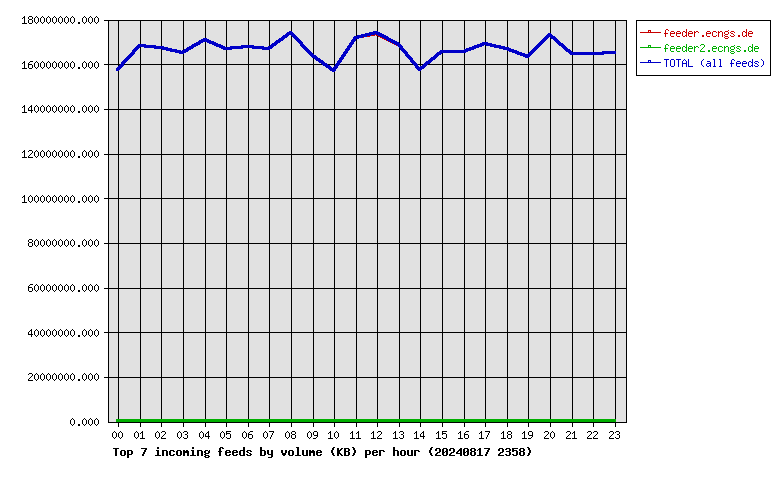
| 1 | feeder.ecngs.de | 3.72TB | 99.96 | 369762.87 | 5712002 | 96.46 | 96.64 | 699.13 | 5921706 | 0 | 0 | 0 | 197 | 0 | |
| 2 | feeder2.ecngs.de | 1.42GB | 0.04 | 138.26 | 198502 | 91.91 | 3.36 | 7.49 | 215858 | 0 | 0 | 0 | 120 | 0 | |
| Total | 3.72TB | 100.00 | 369901.14 | 5910504 | 0.00 | 100.00 | 675.90 | 6137564 | 0 | 0 | 0 | 317 | 0 | ||
 |
| Incoming Feed (+ Top1000 #) | Rej. Vol. | %Vol | Kbps | Accepted | %Acc | %Tot | KB/art | Check | Ihave | Spam | TooOld | Rejs | Errs | ||
|---|---|---|---|---|---|---|---|---|---|---|---|---|---|---|---|
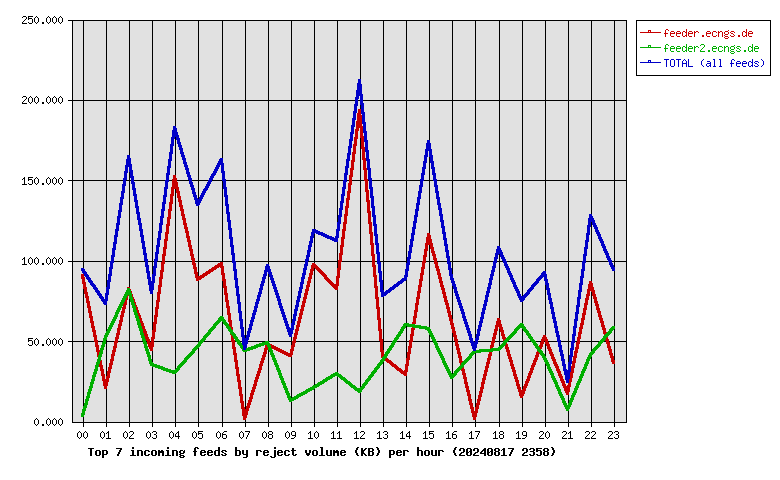
| 1 | feeder.ecngs.de | 1.52MB | 61.76 | 0.14 | 5712002 | 96.46 | 96.64 | 699.13 | 5921706 | 0 | 0 | 0 | 197 | 0 | |
| 2 | feeder2.ecngs.de | 965.17KB | 38.24 | 0.09 | 198502 | 91.91 | 3.36 | 7.49 | 215858 | 0 | 0 | 0 | 120 | 0 | |
| Total | 2.46MB | 100.00 | 0.23 | 5910504 | 0.00 | 100.00 | 675.90 | 6137564 | 0 | 0 | 0 | 317 | 0 | ||
 |
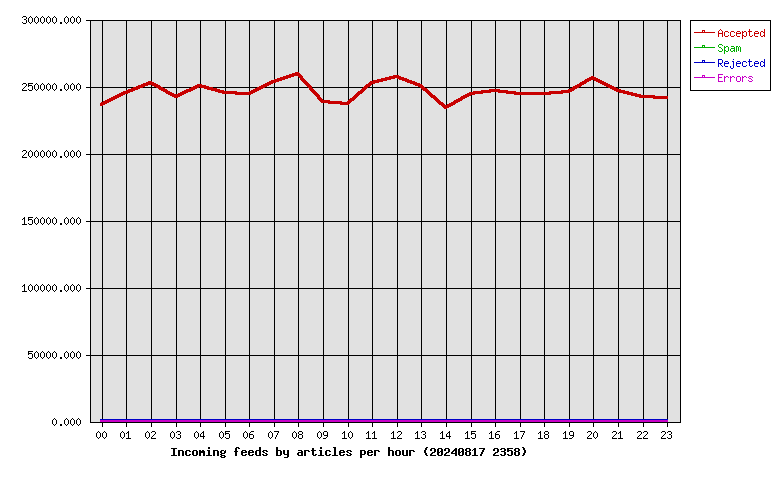
| Hour | Accepted | %Acc | Volume | %Vol | Check | Ihave | Spam | Rejs | Errs |
|---|---|---|---|---|---|---|---|---|---|
| 00 | 236315 | 4.00 | 150.31GB | 3.95 | 248118 | 0 | 0 | 11 | 0 |
| 01 | 245096 | 4.15 | 160.27GB | 4.21 | 251440 | 0 | 0 | 9 | 0 |
| 02 | 252894 | 4.28 | 159.52GB | 4.19 | 269086 | 0 | 0 | 19 | 0 |
| 03 | 241948 | 4.09 | 157.54GB | 4.14 | 246538 | 0 | 0 | 9 | 0 |
| 04 | 250737 | 4.24 | 162.96GB | 4.28 | 255076 | 0 | 0 | 16 | 0 |
| 05 | 245280 | 4.15 | 159.07GB | 4.18 | 252968 | 0 | 0 | 9 | 0 |
| 06 | 244539 | 4.14 | 159.98GB | 4.20 | 254267 | 0 | 0 | 12 | 0 |
| 07 | 253538 | 4.29 | 159.27GB | 4.18 | 264254 | 0 | 0 | 5 | 0 |
| 08 | 259651 | 4.39 | 165.96GB | 4.36 | 267781 | 0 | 0 | 11 | 0 |
| 09 | 238672 | 4.04 | 156.14GB | 4.10 | 246428 | 0 | 0 | 8 | 0 |
| 10 | 236869 | 4.01 | 149.68GB | 3.93 | 244578 | 0 | 0 | 13 | 0 |
| 11 | 252852 | 4.28 | 163.78GB | 4.30 | 259613 | 0 | 0 | 15 | 0 |
| 12 | 256781 | 4.34 | 165.69GB | 4.35 | 266594 | 0 | 0 | 21 | 0 |
| 13 | 250075 | 4.23 | 160.92GB | 4.22 | 264827 | 0 | 0 | 10 | 0 |
| 14 | 233925 | 3.96 | 150.16GB | 3.94 | 244486 | 0 | 0 | 15 | 0 |
| 15 | 244201 | 4.13 | 157.76GB | 4.14 | 251052 | 0 | 0 | 22 | 0 |
| 16 | 246453 | 4.17 | 157.82GB | 4.14 | 254241 | 0 | 0 | 17 | 0 |
| 17 | 244666 | 4.14 | 161.40GB | 4.24 | 253348 | 0 | 0 | 6 | 0 |
| 18 | 244410 | 4.14 | 159.17GB | 4.18 | 253633 | 0 | 0 | 15 | 0 |
| 19 | 245872 | 4.16 | 155.76GB | 4.09 | 262340 | 0 | 0 | 20 | 0 |
| 20 | 256293 | 4.34 | 165.15GB | 4.33 | 264305 | 0 | 0 | 14 | 0 |
| 21 | 246459 | 4.17 | 157.04GB | 4.12 | 262174 | 0 | 0 | 8 | 0 |
| 22 | 241898 | 4.09 | 157.12GB | 4.12 | 252203 | 0 | 0 | 19 | 0 |
| 23 | 241080 | 4.08 | 157.38GB | 4.13 | 248214 | 0 | 0 | 13 | 0 |
| Total | 5910504 | 100.00 | 3.72TB | 100.00 | 6137564 | 0 | 0 | 317 | 0 |
 |
| Outgoing Feed (+ Top1000 #) | Accepted | %Acc | %Tot | Art/sec | Volume | %Vol | KB/art | Dups | Rejs | % Ratio (Out/In) | ||
|---|---|---|---|---|---|---|---|---|---|---|---|---|
| 1 | 217.73.144.40 | 0 | 0.00 | 0.00 | 0.00 | 0.00KB | 0.00 | 0.00 | 5798577 | 0 | … | |
| Total | 0 | 0.00 | 0.00 | 0.00 | 0.00KB | 0.00 | 0.00 | 5798577 | 0 | |||
 |
| Outgoing Feed (+ Top1000 #) | Volume | %Vol | Kbps | Accepted | %Acc | %Tot | KB/art | Dups | Rejs | % Ratio (Out/In) | ||
|---|---|---|---|---|---|---|---|---|---|---|---|---|
| 1 | 217.73.144.40 | 0.00KB | 0.00 | 0.00 | 0 | 0.00 | 0.00 | 0.00 | 5798577 | 0 | … | |
| Total | 0.00KB | 0.00 | 0.00 | 0 | 0.00 | 0.00 | 0.00 | 5798577 | 0 | |||
 |
| Outgoing Feed (+ Top1000 #) | Rej. Vol. | %Vol | Kbps | Accepted | %Acc | %Tot | KB/art | Dups | Rejs | % Ratio (Out/In) | ||
|---|---|---|---|---|---|---|---|---|---|---|---|---|
| 1 | 217.73.144.40 | 0.00KB | 0.00 | 0.00 | 0 | 0.00 | 0.00 | 0.00 | 5798577 | 0 | … | |
| Total | 0.00KB | 0.00 | 0.00 | 0 | 0.00 | 0.00 | 0.00 | 5798577 | 0 | |||
 |
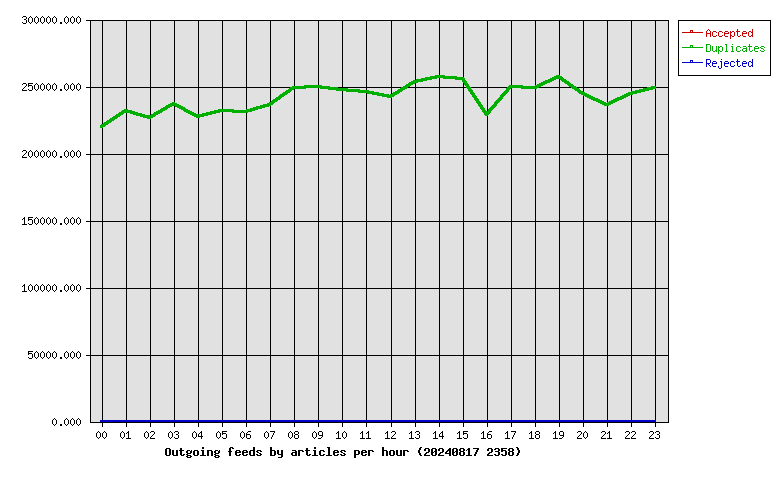
| Hour | Accepted | %Acc | Volume | %Vol | dups | Rejs |
|---|---|---|---|---|---|---|
| 00 | 0 | 0.00 | 0.00KB | 0.00 | 219585 | 0 |
| 01 | 0 | 0.00 | 0.00KB | 0.00 | 231436 | 0 |
| 02 | 0 | 0.00 | 0.00KB | 0.00 | 226652 | 0 |
| 03 | 0 | 0.00 | 0.00KB | 0.00 | 236874 | 0 |
| 04 | 0 | 0.00 | 0.00KB | 0.00 | 227098 | 0 |
| 05 | 0 | 0.00 | 0.00KB | 0.00 | 231829 | 0 |
| 06 | 0 | 0.00 | 0.00KB | 0.00 | 231280 | 0 |
| 07 | 0 | 0.00 | 0.00KB | 0.00 | 236270 | 0 |
| 08 | 0 | 0.00 | 0.00KB | 0.00 | 248664 | 0 |
| 09 | 0 | 0.00 | 0.00KB | 0.00 | 249660 | 0 |
| 10 | 0 | 0.00 | 0.00KB | 0.00 | 247049 | 0 |
| 11 | 0 | 0.00 | 0.00KB | 0.00 | 246077 | 0 |
| 12 | 0 | 0.00 | 0.00KB | 0.00 | 241980 | 0 |
| 13 | 0 | 0.00 | 0.00KB | 0.00 | 253514 | 0 |
| 14 | 0 | 0.00 | 0.00KB | 0.00 | 257287 | 0 |
| 15 | 0 | 0.00 | 0.00KB | 0.00 | 255743 | 0 |
| 16 | 0 | 0.00 | 0.00KB | 0.00 | 228587 | 0 |
| 17 | 0 | 0.00 | 0.00KB | 0.00 | 249787 | 0 |
| 18 | 0 | 0.00 | 0.00KB | 0.00 | 248723 | 0 |
| 19 | 0 | 0.00 | 0.00KB | 0.00 | 257196 | 0 |
| 20 | 0 | 0.00 | 0.00KB | 0.00 | 244188 | 0 |
| 21 | 0 | 0.00 | 0.00KB | 0.00 | 235897 | 0 |
| 22 | 0 | 0.00 | 0.00KB | 0.00 | 244428 | 0 |
| 23 | 0 | 0.00 | 0.00KB | 0.00 | 248773 | 0 |
| Total | 0 | 0.00 | 0.00KB | 0.00 | 5798577 | 0 |
 |
| >= 20% Full | >= 35% Full | >= 50% Full | >= 65% Full | >= 80% Full | >= 95% Full |
| Outgoing Feed | Batch Seq | Batch Num | Batch Max | %Full | Av. Pending |
|---|---|---|---|---|---|
| nbr.elbracht.net-o | 978847-978928 | 81 | 500 | 16 | 0.0 |
| text-spool-out | 0-0 | 0 | 500 | 0 | 0.0 |
| 1st Time | Last Time | # Msgs | Message |
|---|---|---|---|
| 14:33:08 | 14:33:15 | 3 | DNS Fwd/Rev mismatch: lookup of scanner-27.ch1.censys-scanner.com failed |
| 20:14:25 | 1 | DNS Fwd/Rev mismatch: iodimaxio.com/69.10.48.174 |