| |
DIABLO statistics for newsfeed.yoursite.com on Fri 16 Aug 2024 |
Generated on 20240816 2358 by feeder-stats v4.006. Copyright © 2002 The Diablo Project.
Diablo running processes:  81    Dnewslink running processes:  0


11:59PM  up 180 days,  7:18, 0 users, load averages: 1.02, 0.67, 0.61

Filesystem     Size    Used   Avail Capacity  Mounted on
/dev/da0s1g     94G    1.2G     85G     1%    /news
/dev/da1       7.3T    6.6T     84G    99%    /news2/spool/news/00
/dev/da2       7.3T    6.6T     84G    99%    /news2/spool/news/01
/dev/da3       3.7T    3.3T     64G    98%    /news2/spool/news/02
/dev/da4       5.5T    4.6T    421G    92%    /news2/spool/news/03
/dev/da8       7.3T    6.6T     88G    99%    /news2/spool/news/04
/dev/da9       7.3T    6.6T     85G    99%    /news2/spool/news/05
/dev/da10      7.3T    6.6T     88G    99%    /news2/spool/news/06
/dev/da11      5.5T      5T     64G    99%    /news2/spool/news/07
/dev/da12      5.5T    4.9T    104G    98%    /news2/spool/news/08
/dev/da13      7.3T    6.6T     86G    99%    /news2/spool/news/09
/dev/da14      7.3T    6.6T     86G    99%    /news2/spool/news/10
/dev/da15      7.3T    6.6T     83G    99%    /news2/spool/news/11
/dev/da16      7.3T    6.6T     88G    99%    /news2/spool/news/12
/dev/da17      7.3T    6.6T     85G    99%    /news2/spool/news/13
/dev/da18      7.3T    6.6T     88G    99%    /news2/spool/news/14
/dev/da19      7.3T    6.6T     85G    99%    /news2/spool/news/15
/dev/da20      7.3T    6.6T     86G    99%    /news2/spool/news/16
/dev/da21      7.3T    6.6T     84G    99%    /news2/spool/news/17
/dev/da22      7.3T    6.6T     85G    99%    /news2/spool/news/18
/dev/da23      7.3T    6.6T     87G    99%    /news2/spool/news/19
/dev/da24      7.3T    6.6T     87G    99%    /news2/spool/news/20
/dev/da25      7.3T    6.6T     84G    99%    /news2/spool/news/21
/dev/da26      7.3T    6.6T     87G    99%    /news2/spool/news/22
/dev/da5       221G     36G    167G    18%    /news1
/dev/md0        40G     14G     21G    40%    /news3
| Incoming Feed (+ Top1000 #) | Accepted | %Acc | %Tot | Art/sec | Volume | %Vol | KB/art | Check | Ihave | Spam | TooOld | Rejs | Errs | ||
|---|---|---|---|---|---|---|---|---|---|---|---|---|---|---|---|
| 1 | feeder.ecngs.de | 5529039 | 96.06 | 96.27 | 63.99 | 3.63TB | 99.96 | 705.92 | 5755834 | 0 | 0 | 0 | 204 | 0 | |
| 2 | feeder2.ecngs.de | 214312 | 90.99 | 3.73 | 2.48 | 1.64GB | 0.04 | 8.01 | 235418 | 0 | 0 | 0 | 115 | 0 | |
| Total | 5743351 | 0.00 | 100.00 | 66.47 | 3.64TB | 100.00 | 679.87 | 5991252 | 0 | 0 | 0 | 319 | 0 | ||
 |
| Incoming Feed (+ Top1000 #) | Volume | %Vol | Kbps | Accepted | %Acc | %Tot | KB/art | Check | Ihave | Spam | TooOld | Rejs | Errs | ||
|---|---|---|---|---|---|---|---|---|---|---|---|---|---|---|---|
| 1 | feeder.ecngs.de | 3.63TB | 99.96 | 361392.21 | 5529039 | 96.06 | 96.27 | 705.92 | 5755834 | 0 | 0 | 0 | 204 | 0 | |
| 2 | feeder2.ecngs.de | 1.64GB | 0.04 | 158.99 | 214312 | 90.99 | 3.73 | 8.01 | 235418 | 0 | 0 | 0 | 115 | 0 | |
| Total | 3.64TB | 100.00 | 361551.20 | 5743351 | 0.00 | 100.00 | 679.87 | 5991252 | 0 | 0 | 0 | 319 | 0 | ||
 |
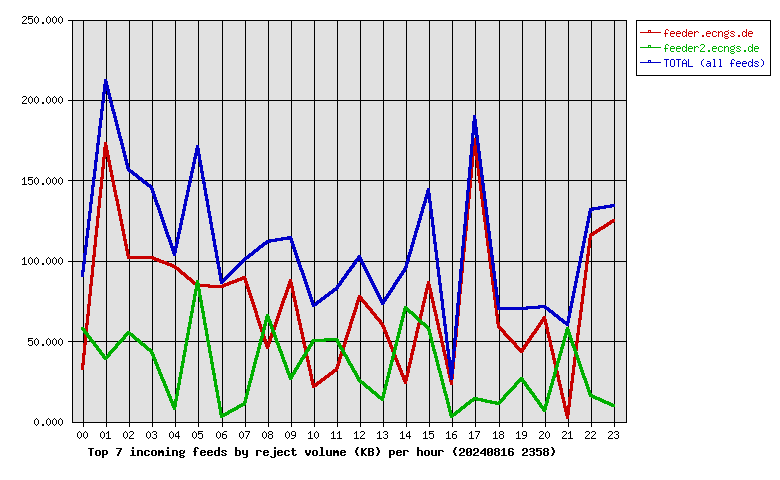
| Incoming Feed (+ Top1000 #) | Rej. Vol. | %Vol | Kbps | Accepted | %Acc | %Tot | KB/art | Check | Ihave | Spam | TooOld | Rejs | Errs | ||
|---|---|---|---|---|---|---|---|---|---|---|---|---|---|---|---|
| 1 | feeder.ecngs.de | 1.76MB | 69.10 | 0.17 | 5529039 | 96.06 | 96.27 | 705.92 | 5755834 | 0 | 0 | 0 | 204 | 0 | |
| 2 | feeder2.ecngs.de | 806.71KB | 30.90 | 0.07 | 214312 | 90.99 | 3.73 | 8.01 | 235418 | 0 | 0 | 0 | 115 | 0 | |
| Total | 2.55MB | 100.00 | 0.24 | 5743351 | 0.00 | 100.00 | 679.87 | 5991252 | 0 | 0 | 0 | 319 | 0 | ||
 |
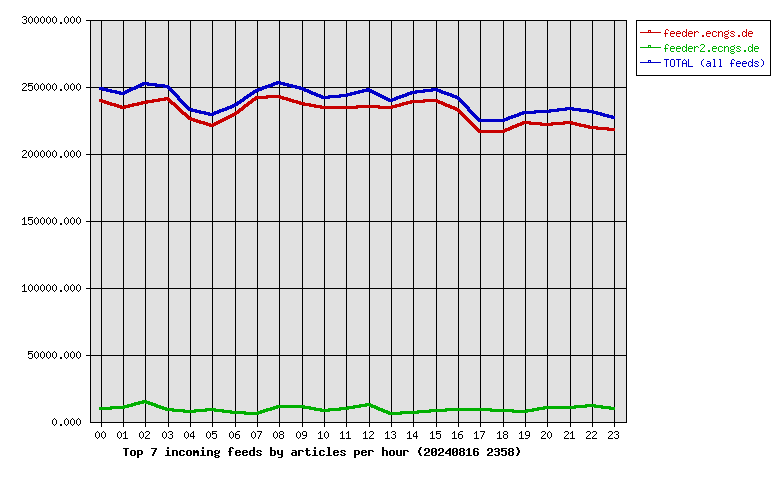
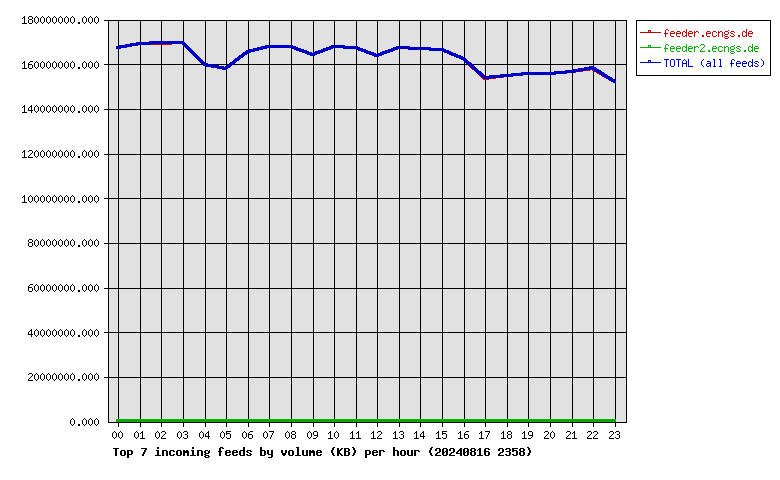
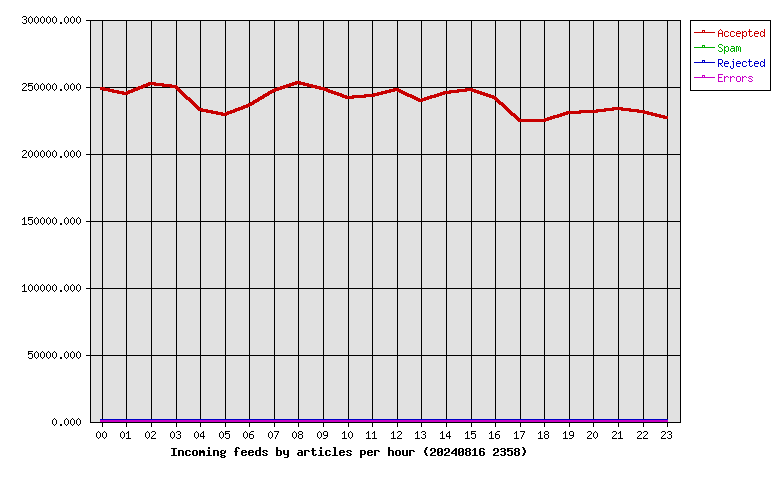
| Hour | Accepted | %Acc | Volume | %Vol | Check | Ihave | Spam | Rejs | Errs |
|---|---|---|---|---|---|---|---|---|---|
| 00 | 248483 | 4.33 | 159.68GB | 4.29 | 260748 | 0 | 0 | 11 | 0 |
| 01 | 244041 | 4.25 | 161.17GB | 4.33 | 255296 | 0 | 0 | 19 | 0 |
| 02 | 251861 | 4.39 | 161.46GB | 4.34 | 268368 | 0 | 0 | 21 | 0 |
| 03 | 249852 | 4.35 | 161.71GB | 4.34 | 258837 | 0 | 0 | 14 | 0 |
| 04 | 232252 | 4.04 | 152.35GB | 4.09 | 240954 | 0 | 0 | 15 | 0 |
| 05 | 228740 | 3.98 | 150.52GB | 4.04 | 242543 | 0 | 0 | 18 | 0 |
| 06 | 235276 | 4.10 | 157.63GB | 4.23 | 242180 | 0 | 0 | 8 | 0 |
| 07 | 246502 | 4.29 | 159.78GB | 4.29 | 252280 | 0 | 0 | 15 | 0 |
| 08 | 252451 | 4.40 | 159.99GB | 4.30 | 265121 | 0 | 0 | 17 | 0 |
| 09 | 248155 | 4.32 | 156.49GB | 4.20 | 260690 | 0 | 0 | 19 | 0 |
| 10 | 241686 | 4.21 | 159.83GB | 4.29 | 250470 | 0 | 0 | 9 | 0 |
| 11 | 243012 | 4.23 | 159.41GB | 4.28 | 253295 | 0 | 0 | 11 | 0 |
| 12 | 247378 | 4.31 | 155.97GB | 4.19 | 261712 | 0 | 0 | 17 | 0 |
| 13 | 239498 | 4.17 | 159.36GB | 4.28 | 245759 | 0 | 0 | 8 | 0 |
| 14 | 245312 | 4.27 | 159.27GB | 4.28 | 252678 | 0 | 0 | 16 | 0 |
| 15 | 247159 | 4.30 | 158.80GB | 4.26 | 254756 | 0 | 0 | 14 | 0 |
| 16 | 241464 | 4.20 | 154.75GB | 4.16 | 252604 | 0 | 0 | 8 | 0 |
| 17 | 224551 | 3.91 | 146.53GB | 3.93 | 234739 | 0 | 0 | 16 | 0 |
| 18 | 224040 | 3.90 | 147.71GB | 3.97 | 232893 | 0 | 0 | 8 | 0 |
| 19 | 230123 | 4.01 | 148.24GB | 3.98 | 238126 | 0 | 0 | 9 | 0 |
| 20 | 231091 | 4.02 | 148.31GB | 3.98 | 242423 | 0 | 0 | 9 | 0 |
| 21 | 232843 | 4.05 | 149.12GB | 4.00 | 244487 | 0 | 0 | 9 | 0 |
| 22 | 230798 | 4.02 | 150.75GB | 4.05 | 244189 | 0 | 0 | 15 | 0 |
| 23 | 226783 | 3.95 | 145.03GB | 3.89 | 236104 | 0 | 0 | 13 | 0 |
| Total | 5743351 | 100.00 | 3.64TB | 100.00 | 5991252 | 0 | 0 | 319 | 0 |
 |
| Outgoing Feed (+ Top1000 #) | Accepted | %Acc | %Tot | Art/sec | Volume | %Vol | KB/art | Dups | Rejs | % Ratio (Out/In) | ||
|---|---|---|---|---|---|---|---|---|---|---|---|---|
| 1 | 217.73.144.40 | 0 | 0.00 | 0.00 | 0.00 | 0.00KB | 0.00 | 0.00 | 5943003 | 0 | … | |
| Total | 0 | 0.00 | 0.00 | 0.00 | 0.00KB | 0.00 | 0.00 | 5943003 | 0 | |||
 |
| Outgoing Feed (+ Top1000 #) | Volume | %Vol | Kbps | Accepted | %Acc | %Tot | KB/art | Dups | Rejs | % Ratio (Out/In) | ||
|---|---|---|---|---|---|---|---|---|---|---|---|---|
| 1 | 217.73.144.40 | 0.00KB | 0.00 | 0.00 | 0 | 0.00 | 0.00 | 0.00 | 5943003 | 0 | … | |
| Total | 0.00KB | 0.00 | 0.00 | 0 | 0.00 | 0.00 | 0.00 | 5943003 | 0 | |||
 |
| Outgoing Feed (+ Top1000 #) | Rej. Vol. | %Vol | Kbps | Accepted | %Acc | %Tot | KB/art | Dups | Rejs | % Ratio (Out/In) | ||
|---|---|---|---|---|---|---|---|---|---|---|---|---|
| 1 | 217.73.144.40 | 0.00KB | 0.00 | 0.00 | 0 | 0.00 | 0.00 | 0.00 | 5943003 | 0 | … | |
| Total | 0.00KB | 0.00 | 0.00 | 0 | 0.00 | 0.00 | 0.00 | 5943003 | 0 | |||
 |
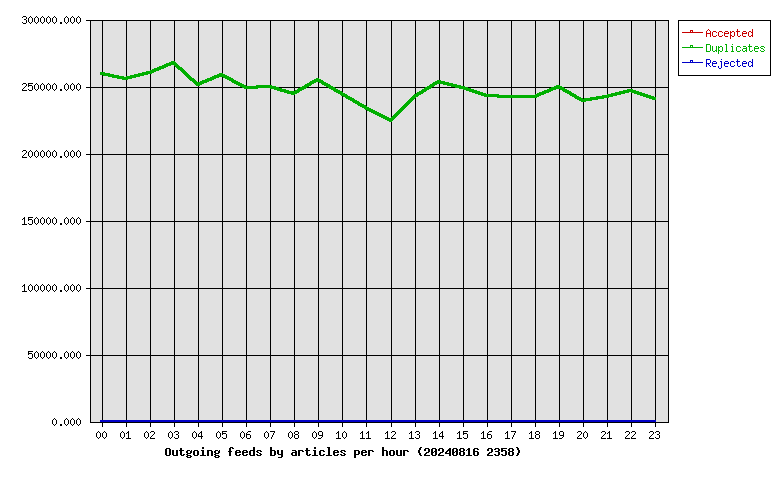
| Hour | Accepted | %Acc | Volume | %Vol | dups | Rejs |
|---|---|---|---|---|---|---|
| 00 | 0 | 0.00 | 0.00KB | 0.00 | 258986 | 0 |
| 01 | 0 | 0.00 | 0.00KB | 0.00 | 255533 | 0 |
| 02 | 0 | 0.00 | 0.00KB | 0.00 | 260368 | 0 |
| 03 | 0 | 0.00 | 0.00KB | 0.00 | 267393 | 0 |
| 04 | 0 | 0.00 | 0.00KB | 0.00 | 251277 | 0 |
| 05 | 0 | 0.00 | 0.00KB | 0.00 | 258712 | 0 |
| 06 | 0 | 0.00 | 0.00KB | 0.00 | 248754 | 0 |
| 07 | 0 | 0.00 | 0.00KB | 0.00 | 249314 | 0 |
| 08 | 0 | 0.00 | 0.00KB | 0.00 | 244057 | 0 |
| 09 | 0 | 0.00 | 0.00KB | 0.00 | 254803 | 0 |
| 10 | 0 | 0.00 | 0.00KB | 0.00 | 244573 | 0 |
| 11 | 0 | 0.00 | 0.00KB | 0.00 | 233833 | 0 |
| 12 | 0 | 0.00 | 0.00KB | 0.00 | 223981 | 0 |
| 13 | 0 | 0.00 | 0.00KB | 0.00 | 242510 | 0 |
| 14 | 0 | 0.00 | 0.00KB | 0.00 | 253549 | 0 |
| 15 | 0 | 0.00 | 0.00KB | 0.00 | 248842 | 0 |
| 16 | 0 | 0.00 | 0.00KB | 0.00 | 242927 | 0 |
| 17 | 0 | 0.00 | 0.00KB | 0.00 | 242402 | 0 |
| 18 | 0 | 0.00 | 0.00KB | 0.00 | 242508 | 0 |
| 19 | 0 | 0.00 | 0.00KB | 0.00 | 249934 | 0 |
| 20 | 0 | 0.00 | 0.00KB | 0.00 | 239477 | 0 |
| 21 | 0 | 0.00 | 0.00KB | 0.00 | 242301 | 0 |
| 22 | 0 | 0.00 | 0.00KB | 0.00 | 246405 | 0 |
| 23 | 0 | 0.00 | 0.00KB | 0.00 | 240564 | 0 |
| Total | 0 | 0.00 | 0.00KB | 0.00 | 5943003 | 0 |
 |
| >= 20% Full | >= 35% Full | >= 50% Full | >= 65% Full | >= 80% Full | >= 95% Full |
| Outgoing Feed | Batch Seq | Batch Num | Batch Max | %Full | Av. Pending |
|---|---|---|---|---|---|
| nbr.elbracht.net-o | 978559-978640 | 81 | 500 | 16 | 0.0 |
| text-spool-out | 0-0 | 0 | 500 | 0 | 0.0 |
| 1st Time | Last Time | # Msgs | Message |
|---|---|---|---|
| 12:37:38 | 12:37:40 | 4 | DNS Fwd/Rev mismatch: lookup of hfxgnjkphjhgrlqt.com failed |
| 12:37:39 | 12:37:40 | 2 | DNS Fwd/Rev mismatch: lookup of k6834j.cn failed |