| |
DIABLO statistics for newsfeed.yoursite.com on Wed 14 Aug 2024 |
Generated on 20240814 2358 by feeder-stats v4.006. Copyright © 2002 The Diablo Project.
Diablo running processes:  81    Dnewslink running processes:  0


11:59PM  up 178 days,  7:18, 0 users, load averages: 1.28, 1.07, 1.41

Filesystem     Size    Used   Avail Capacity  Mounted on
/dev/da0s1g     94G    1.2G     85G     1%    /news
/dev/da1       7.3T    6.6T     92G    99%    /news2/spool/news/00
/dev/da2       7.3T    6.6T     90G    99%    /news2/spool/news/01
/dev/da3       3.7T    3.3T     62G    98%    /news2/spool/news/02
/dev/da4       5.5T      5T     89G    98%    /news2/spool/news/03
/dev/da8       7.3T    6.6T     96G    99%    /news2/spool/news/04
/dev/da9       7.3T    6.6T     93G    99%    /news2/spool/news/05
/dev/da10      7.3T    6.6T     95G    99%    /news2/spool/news/06
/dev/da11      5.5T      5T     66G    99%    /news2/spool/news/07
/dev/da12      5.5T      5T     64G    99%    /news2/spool/news/08
/dev/da13      7.3T    6.6T     92G    99%    /news2/spool/news/09
/dev/da14      7.3T    6.6T     92G    99%    /news2/spool/news/10
/dev/da15      7.3T    6.6T     89G    99%    /news2/spool/news/11
/dev/da16      7.3T    6.6T     94G    99%    /news2/spool/news/12
/dev/da17      7.3T    6.6T     91G    99%    /news2/spool/news/13
/dev/da18      7.3T    6.6T     94G    99%    /news2/spool/news/14
/dev/da19      7.3T    6.6T     91G    99%    /news2/spool/news/15
/dev/da20      7.3T    6.6T     91G    99%    /news2/spool/news/16
/dev/da21      7.3T    6.6T     90G    99%    /news2/spool/news/17
/dev/da22      7.3T    6.6T     91G    99%    /news2/spool/news/18
/dev/da23      7.3T    6.6T     94G    99%    /news2/spool/news/19
/dev/da24      7.3T    6.6T     93G    99%    /news2/spool/news/20
/dev/da25      7.3T    6.6T     91G    99%    /news2/spool/news/21
/dev/da26      7.3T    6.6T     94G    99%    /news2/spool/news/22
/dev/da5       221G     36G    167G    18%    /news1
/dev/md0        40G     14G     21G    40%    /news3
| Incoming Feed (+ Top1000 #) | Accepted | %Acc | %Tot | Art/sec | Volume | %Vol | KB/art | Check | Ihave | Spam | TooOld | Rejs | Errs | ||
|---|---|---|---|---|---|---|---|---|---|---|---|---|---|---|---|
| 1 | feeder.ecngs.de | 5724884 | 96.53 | 96.69 | 66.26 | 3.82TB | 99.96 | 715.69 | 5930623 | 0 | 0 | 0 | 209 | 0 | |
| 2 | feeder2.ecngs.de | 196210 | 91.63 | 3.31 | 2.28 | 1.58GB | 0.04 | 8.45 | 213988 | 0 | 0 | 0 | 145 | 0 | |
| Total | 5921094 | 0.00 | 100.00 | 68.54 | 3.82TB | 100.00 | 692.25 | 6144611 | 0 | 0 | 0 | 354 | 0 | ||
 |
| Incoming Feed (+ Top1000 #) | Volume | %Vol | Kbps | Accepted | %Acc | %Tot | KB/art | Check | Ihave | Spam | TooOld | Rejs | Errs | ||
|---|---|---|---|---|---|---|---|---|---|---|---|---|---|---|---|
| 1 | feeder.ecngs.de | 3.82TB | 99.96 | 379372.23 | 5724884 | 96.53 | 96.69 | 715.69 | 5930623 | 0 | 0 | 0 | 209 | 0 | |
| 2 | feeder2.ecngs.de | 1.58GB | 0.04 | 154.09 | 196210 | 91.63 | 3.31 | 8.45 | 213988 | 0 | 0 | 0 | 145 | 0 | |
| Total | 3.82TB | 100.00 | 379526.32 | 5921094 | 0.00 | 100.00 | 692.25 | 6144611 | 0 | 0 | 0 | 354 | 0 | ||
 |
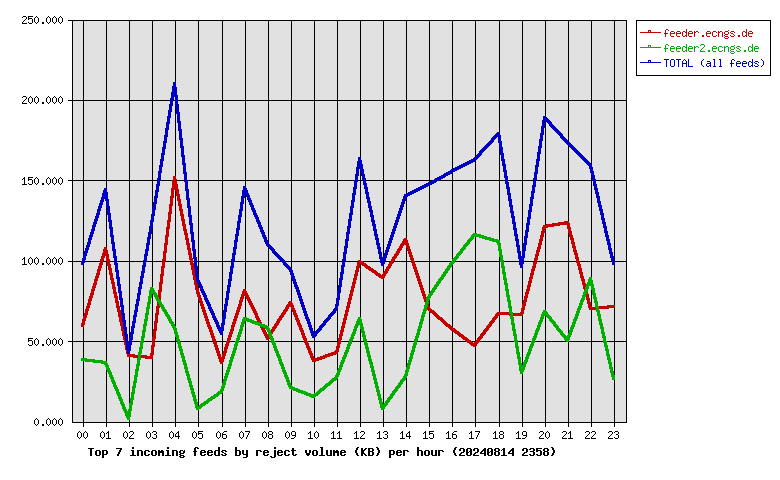
| Incoming Feed (+ Top1000 #) | Rej. Vol. | %Vol | Kbps | Accepted | %Acc | %Tot | KB/art | Check | Ihave | Spam | TooOld | Rejs | Errs | ||
|---|---|---|---|---|---|---|---|---|---|---|---|---|---|---|---|
| 1 | feeder.ecngs.de | 1.75MB | 60.09 | 0.17 | 5724884 | 96.53 | 96.69 | 715.69 | 5930623 | 0 | 0 | 0 | 209 | 0 | |
| 2 | feeder2.ecngs.de | 1.17MB | 39.91 | 0.11 | 196210 | 91.63 | 3.31 | 8.45 | 213988 | 0 | 0 | 0 | 145 | 0 | |
| Total | 2.92MB | 100.00 | 0.28 | 5921094 | 0.00 | 100.00 | 692.25 | 6144611 | 0 | 0 | 0 | 354 | 0 | ||
 |
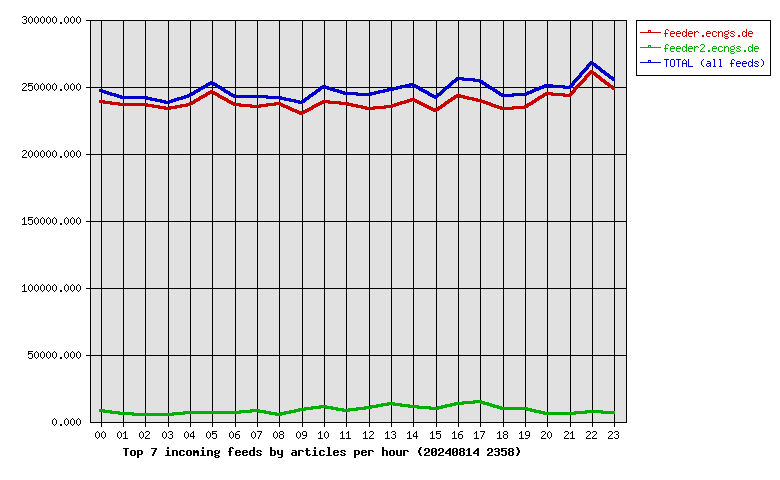
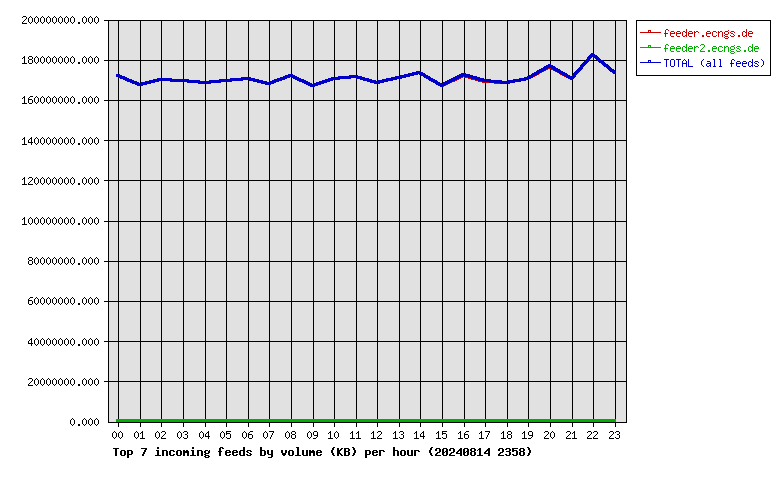
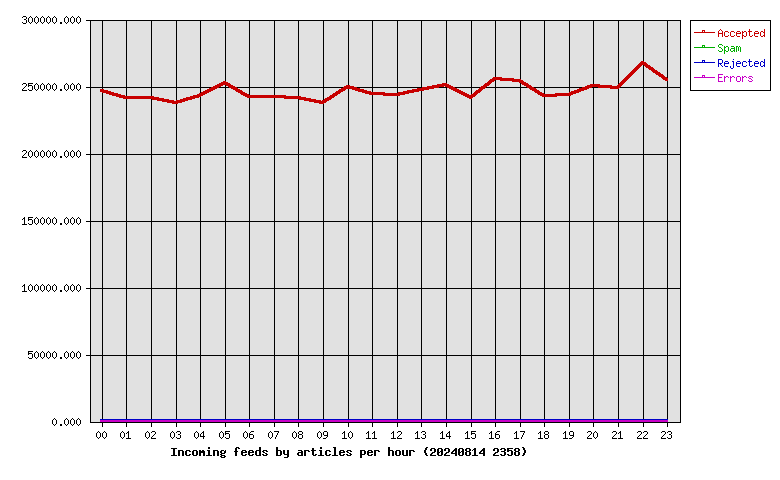
| Hour | Accepted | %Acc | Volume | %Vol | Check | Ihave | Spam | Rejs | Errs |
|---|---|---|---|---|---|---|---|---|---|
| 00 | 246415 | 4.16 | 163.95GB | 4.19 | 255223 | 0 | 0 | 13 | 0 |
| 01 | 241699 | 4.08 | 159.61GB | 4.08 | 248110 | 0 | 0 | 15 | 0 |
| 02 | 241415 | 4.08 | 162.20GB | 4.15 | 246890 | 0 | 0 | 7 | 0 |
| 03 | 237867 | 4.02 | 161.75GB | 4.14 | 242581 | 0 | 0 | 11 | 0 |
| 04 | 242570 | 4.10 | 160.75GB | 4.11 | 250585 | 0 | 0 | 17 | 0 |
| 05 | 252483 | 4.26 | 161.66GB | 4.14 | 260241 | 0 | 0 | 7 | 0 |
| 06 | 242525 | 4.10 | 162.60GB | 4.16 | 249408 | 0 | 0 | 9 | 0 |
| 07 | 242095 | 4.09 | 160.28GB | 4.10 | 250544 | 0 | 0 | 12 | 0 |
| 08 | 241465 | 4.08 | 163.82GB | 4.19 | 246805 | 0 | 0 | 13 | 0 |
| 09 | 238052 | 4.02 | 159.32GB | 4.08 | 247499 | 0 | 0 | 12 | 0 |
| 10 | 249285 | 4.21 | 162.43GB | 4.16 | 261964 | 0 | 0 | 10 | 0 |
| 11 | 244653 | 4.13 | 163.56GB | 4.18 | 253449 | 0 | 0 | 16 | 0 |
| 12 | 243722 | 4.12 | 160.51GB | 4.11 | 255347 | 0 | 0 | 20 | 0 |
| 13 | 247165 | 4.17 | 162.88GB | 4.17 | 261861 | 0 | 0 | 8 | 0 |
| 14 | 250790 | 4.24 | 165.28GB | 4.23 | 263325 | 0 | 0 | 11 | 0 |
| 15 | 241105 | 4.07 | 159.20GB | 4.07 | 251006 | 0 | 0 | 21 | 0 |
| 16 | 255841 | 4.32 | 164.24GB | 4.20 | 271625 | 0 | 0 | 22 | 0 |
| 17 | 253755 | 4.29 | 161.39GB | 4.13 | 270459 | 0 | 0 | 21 | 0 |
| 18 | 243025 | 4.10 | 160.51GB | 4.11 | 253786 | 0 | 0 | 19 | 0 |
| 19 | 243678 | 4.12 | 162.64GB | 4.16 | 254300 | 0 | 0 | 15 | 0 |
| 20 | 250406 | 4.23 | 168.47GB | 4.31 | 256670 | 0 | 0 | 18 | 0 |
| 21 | 248793 | 4.20 | 162.67GB | 4.16 | 255080 | 0 | 0 | 18 | 0 |
| 22 | 267649 | 4.52 | 174.09GB | 4.45 | 276099 | 0 | 0 | 24 | 0 |
| 23 | 254641 | 4.30 | 165.18GB | 4.23 | 261754 | 0 | 0 | 15 | 0 |
| Total | 5921094 | 100.00 | 3.82TB | 100.00 | 6144611 | 0 | 0 | 354 | 0 |
 |
| Outgoing Feed (+ Top1000 #) | Accepted | %Acc | %Tot | Art/sec | Volume | %Vol | KB/art | Dups | Rejs | % Ratio (Out/In) | ||
|---|---|---|---|---|---|---|---|---|---|---|---|---|
| 1 | 217.73.144.40 | 0 | 0.00 | 0.00 | 0.00 | 0.00KB | 0.00 | 0.00 | 5879422 | 0 | … | |
| Total | 0 | 0.00 | 0.00 | 0.00 | 0.00KB | 0.00 | 0.00 | 5879422 | 0 | |||
 |
| Outgoing Feed (+ Top1000 #) | Volume | %Vol | Kbps | Accepted | %Acc | %Tot | KB/art | Dups | Rejs | % Ratio (Out/In) | ||
|---|---|---|---|---|---|---|---|---|---|---|---|---|
| 1 | 217.73.144.40 | 0.00KB | 0.00 | 0.00 | 0 | 0.00 | 0.00 | 0.00 | 5879422 | 0 | … | |
| Total | 0.00KB | 0.00 | 0.00 | 0 | 0.00 | 0.00 | 0.00 | 5879422 | 0 | |||
 |
| Outgoing Feed (+ Top1000 #) | Rej. Vol. | %Vol | Kbps | Accepted | %Acc | %Tot | KB/art | Dups | Rejs | % Ratio (Out/In) | ||
|---|---|---|---|---|---|---|---|---|---|---|---|---|
| 1 | 217.73.144.40 | 0.00KB | 0.00 | 0.00 | 0 | 0.00 | 0.00 | 0.00 | 5879422 | 0 | … | |
| Total | 0.00KB | 0.00 | 0.00 | 0 | 0.00 | 0.00 | 0.00 | 5879422 | 0 | |||
 |
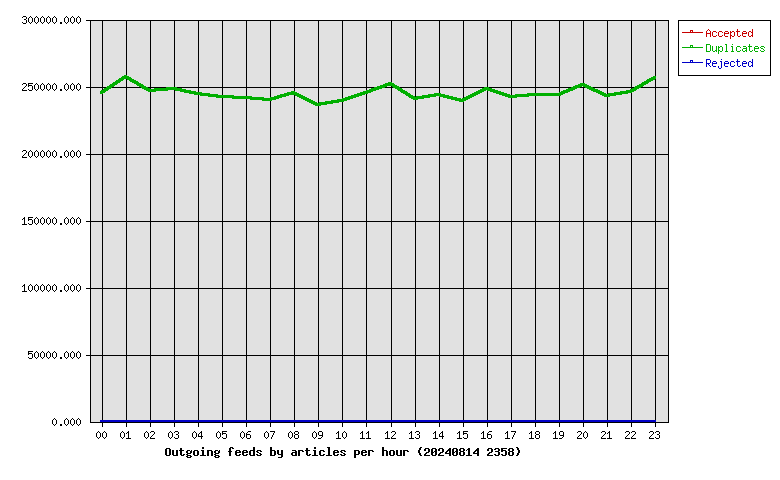
| Hour | Accepted | %Acc | Volume | %Vol | dups | Rejs |
|---|---|---|---|---|---|---|
| 00 | 0 | 0.00 | 0.00KB | 0.00 | 245255 | 0 |
| 01 | 0 | 0.00 | 0.00KB | 0.00 | 257381 | 0 |
| 02 | 0 | 0.00 | 0.00KB | 0.00 | 246598 | 0 |
| 03 | 0 | 0.00 | 0.00KB | 0.00 | 247916 | 0 |
| 04 | 0 | 0.00 | 0.00KB | 0.00 | 244370 | 0 |
| 05 | 0 | 0.00 | 0.00KB | 0.00 | 241843 | 0 |
| 06 | 0 | 0.00 | 0.00KB | 0.00 | 241519 | 0 |
| 07 | 0 | 0.00 | 0.00KB | 0.00 | 239879 | 0 |
| 08 | 0 | 0.00 | 0.00KB | 0.00 | 245278 | 0 |
| 09 | 0 | 0.00 | 0.00KB | 0.00 | 236375 | 0 |
| 10 | 0 | 0.00 | 0.00KB | 0.00 | 239410 | 0 |
| 11 | 0 | 0.00 | 0.00KB | 0.00 | 244865 | 0 |
| 12 | 0 | 0.00 | 0.00KB | 0.00 | 252160 | 0 |
| 13 | 0 | 0.00 | 0.00KB | 0.00 | 240496 | 0 |
| 14 | 0 | 0.00 | 0.00KB | 0.00 | 243796 | 0 |
| 15 | 0 | 0.00 | 0.00KB | 0.00 | 239170 | 0 |
| 16 | 0 | 0.00 | 0.00KB | 0.00 | 247828 | 0 |
| 17 | 0 | 0.00 | 0.00KB | 0.00 | 242495 | 0 |
| 18 | 0 | 0.00 | 0.00KB | 0.00 | 243847 | 0 |
| 19 | 0 | 0.00 | 0.00KB | 0.00 | 243489 | 0 |
| 20 | 0 | 0.00 | 0.00KB | 0.00 | 250839 | 0 |
| 21 | 0 | 0.00 | 0.00KB | 0.00 | 242622 | 0 |
| 22 | 0 | 0.00 | 0.00KB | 0.00 | 246018 | 0 |
| 23 | 0 | 0.00 | 0.00KB | 0.00 | 255973 | 0 |
| Total | 0 | 0.00 | 0.00KB | 0.00 | 5879422 | 0 |
 |
| >= 20% Full | >= 35% Full | >= 50% Full | >= 65% Full | >= 80% Full | >= 95% Full |
| Outgoing Feed | Batch Seq | Batch Num | Batch Max | %Full | Av. Pending |
|---|---|---|---|---|---|
| nbr.elbracht.net-o | 977983-978064 | 81 | 500 | 16 | 0.0 |
| text-spool-out | 0-0 | 0 | 500 | 0 | 0.0 |
| 1st Time | Last Time | # Msgs | Message |
|---|