| |
DIABLO statistics for newsfeed.yoursite.com on Tue 13 Aug 2024 |
Generated on 20240813 2358 by feeder-stats v4.006. Copyright © 2002 The Diablo Project.
Diablo running processes:  81    Dnewslink running processes:  0


11:59PM  up 177 days,  7:18, 0 users, load averages: 1.72, 1.14, 0.92

Filesystem     Size    Used   Avail Capacity  Mounted on
/dev/da0s1g     94G    1.2G     85G     1%    /news
/dev/da1       7.3T    6.6T     99G    99%    /news2/spool/news/00
/dev/da2       7.3T    6.6T     98G    99%    /news2/spool/news/01
/dev/da3       3.7T    3.3T     67G    98%    /news2/spool/news/02
/dev/da4       5.5T      5T     90G    98%    /news2/spool/news/03
/dev/da8       7.3T    6.6T    103G    98%    /news2/spool/news/04
/dev/da9       7.3T    6.6T    101G    99%    /news2/spool/news/05
/dev/da10      7.3T    6.6T    103G    98%    /news2/spool/news/06
/dev/da11      5.5T      5T     77G    98%    /news2/spool/news/07
/dev/da12      5.5T      5T     74G    99%    /news2/spool/news/08
/dev/da13      7.3T    6.6T    100G    99%    /news2/spool/news/09
/dev/da14      7.3T    6.6T     99G    99%    /news2/spool/news/10
/dev/da15      7.3T    6.6T     98G    99%    /news2/spool/news/11
/dev/da16      7.3T    6.6T    102G    99%    /news2/spool/news/12
/dev/da17      7.3T    6.6T     98G    99%    /news2/spool/news/13
/dev/da18      7.3T    6.6T    102G    99%    /news2/spool/news/14
/dev/da19      7.3T    6.6T     99G    99%    /news2/spool/news/15
/dev/da20      7.3T    6.6T     99G    99%    /news2/spool/news/16
/dev/da21      7.3T    6.6T     98G    99%    /news2/spool/news/17
/dev/da22      7.3T    6.6T     99G    99%    /news2/spool/news/18
/dev/da23      7.3T    6.6T    100G    99%    /news2/spool/news/19
/dev/da24      7.3T    6.6T    101G    99%    /news2/spool/news/20
/dev/da25      7.3T    6.6T     98G    99%    /news2/spool/news/21
/dev/da26      7.3T    6.6T    100G    99%    /news2/spool/news/22
/dev/da5       221G     36G    167G    18%    /news1
/dev/md0        40G     14G     21G    40%    /news3
| Incoming Feed (+ Top1000 #) | Accepted | %Acc | %Tot | Art/sec | Volume | %Vol | KB/art | Check | Ihave | Spam | TooOld | Rejs | Errs | ||
|---|---|---|---|---|---|---|---|---|---|---|---|---|---|---|---|
| 1 | feeder.ecngs.de | 5590634 | 95.05 | 95.35 | 64.71 | 3.69TB | 99.94 | 707.77 | 5881459 | 0 | 0 | 0 | 226 | 0 | |
| 2 | feeder2.ecngs.de | 272723 | 90.59 | 4.65 | 3.16 | 2.33GB | 0.06 | 8.97 | 300918 | 0 | 0 | 0 | 147 | 0 | |
| Total | 5863357 | 0.00 | 100.00 | 67.87 | 3.69TB | 100.00 | 675.26 | 6182377 | 0 | 0 | 0 | 373 | 0 | ||
 |
| Incoming Feed (+ Top1000 #) | Volume | %Vol | Kbps | Accepted | %Acc | %Tot | KB/art | Check | Ihave | Spam | TooOld | Rejs | Errs | ||
|---|---|---|---|---|---|---|---|---|---|---|---|---|---|---|---|
| 1 | feeder.ecngs.de | 3.69TB | 99.94 | 366376.86 | 5590634 | 95.05 | 95.35 | 707.77 | 5881459 | 0 | 0 | 0 | 226 | 0 | |
| 2 | feeder2.ecngs.de | 2.33GB | 0.06 | 227.15 | 272723 | 90.59 | 4.65 | 8.97 | 300918 | 0 | 0 | 0 | 147 | 0 | |
| Total | 3.69TB | 100.00 | 366604.01 | 5863357 | 0.00 | 100.00 | 675.26 | 6182377 | 0 | 0 | 0 | 373 | 0 | ||
 |
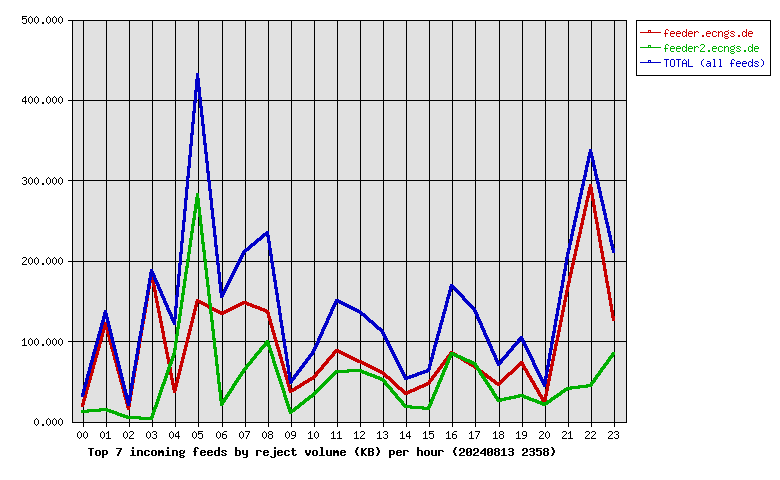
| Incoming Feed (+ Top1000 #) | Rej. Vol. | %Vol | Kbps | Accepted | %Acc | %Tot | KB/art | Check | Ihave | Spam | TooOld | Rejs | Errs | ||
|---|---|---|---|---|---|---|---|---|---|---|---|---|---|---|---|
| 1 | feeder.ecngs.de | 2.16MB | 64.13 | 0.21 | 5590634 | 95.05 | 95.35 | 707.77 | 5881459 | 0 | 0 | 0 | 226 | 0 | |
| 2 | feeder2.ecngs.de | 1.21MB | 35.87 | 0.12 | 272723 | 90.59 | 4.65 | 8.97 | 300918 | 0 | 0 | 0 | 147 | 0 | |
| Total | 3.37MB | 100.00 | 0.32 | 5863357 | 0.00 | 100.00 | 675.26 | 6182377 | 0 | 0 | 0 | 373 | 0 | ||
 |
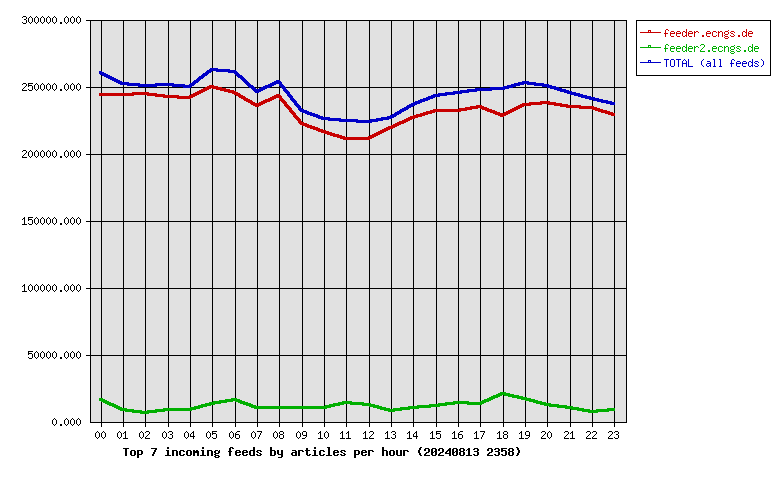
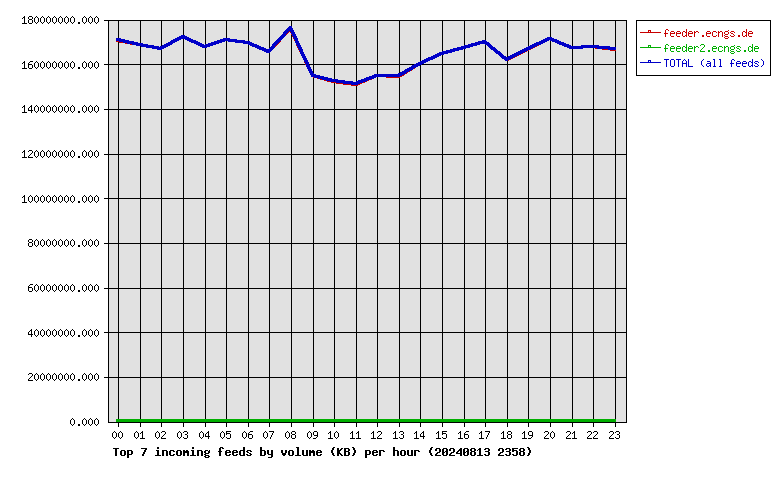
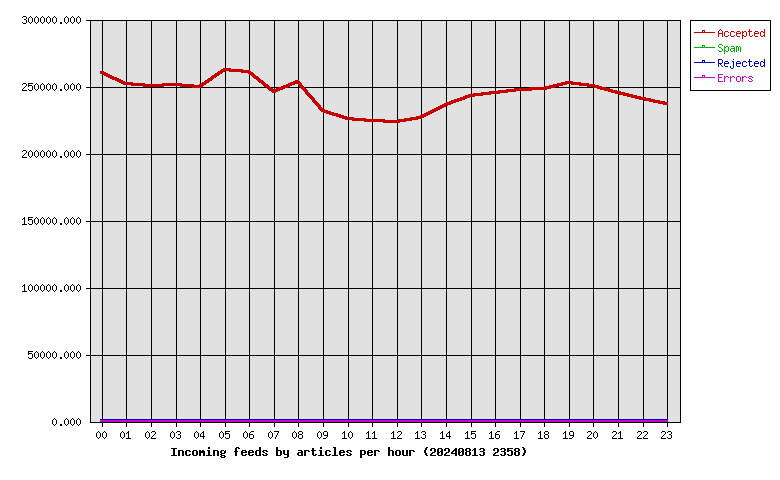
| Hour | Accepted | %Acc | Volume | %Vol | Check | Ihave | Spam | Rejs | Errs |
|---|---|---|---|---|---|---|---|---|---|
| 00 | 259808 | 4.43 | 162.80GB | 4.31 | 277509 | 0 | 0 | 8 | 0 |
| 01 | 252221 | 4.30 | 160.66GB | 4.25 | 261720 | 0 | 0 | 13 | 0 |
| 02 | 250426 | 4.27 | 159.13GB | 4.21 | 257222 | 0 | 0 | 6 | 0 |
| 03 | 250974 | 4.28 | 164.13GB | 4.35 | 259218 | 0 | 0 | 16 | 0 |
| 04 | 249968 | 4.26 | 160.11GB | 4.24 | 261529 | 0 | 0 | 15 | 0 |
| 05 | 262133 | 4.47 | 163.03GB | 4.32 | 283158 | 0 | 0 | 44 | 0 |
| 06 | 261178 | 4.45 | 161.69GB | 4.28 | 280533 | 0 | 0 | 19 | 0 |
| 07 | 245543 | 4.19 | 157.96GB | 4.18 | 256873 | 0 | 0 | 17 | 0 |
| 08 | 253007 | 4.32 | 167.82GB | 4.44 | 264431 | 0 | 0 | 19 | 0 |
| 09 | 231655 | 3.95 | 147.70GB | 3.91 | 242808 | 0 | 0 | 6 | 0 |
| 10 | 226070 | 3.86 | 145.21GB | 3.85 | 237620 | 0 | 0 | 12 | 0 |
| 11 | 224603 | 3.83 | 143.99GB | 3.81 | 240146 | 0 | 0 | 21 | 0 |
| 12 | 223208 | 3.81 | 147.67GB | 3.91 | 236736 | 0 | 0 | 13 | 0 |
| 13 | 226739 | 3.87 | 147.38GB | 3.90 | 235627 | 0 | 0 | 11 | 0 |
| 14 | 236303 | 4.03 | 152.79GB | 4.05 | 247440 | 0 | 0 | 12 | 0 |
| 15 | 242663 | 4.14 | 157.13GB | 4.16 | 254376 | 0 | 0 | 8 | 0 |
| 16 | 245491 | 4.19 | 159.50GB | 4.22 | 262096 | 0 | 0 | 17 | 0 |
| 17 | 247677 | 4.22 | 162.24GB | 4.30 | 262587 | 0 | 0 | 7 | 0 |
| 18 | 248197 | 4.23 | 154.39GB | 4.09 | 272054 | 0 | 0 | 8 | 0 |
| 19 | 252685 | 4.31 | 158.95GB | 4.21 | 272403 | 0 | 0 | 18 | 0 |
| 20 | 250378 | 4.27 | 163.30GB | 4.32 | 264656 | 0 | 0 | 8 | 0 |
| 21 | 244863 | 4.18 | 159.52GB | 4.22 | 256388 | 0 | 0 | 26 | 0 |
| 22 | 240584 | 4.10 | 159.91GB | 4.24 | 249002 | 0 | 0 | 35 | 0 |
| 23 | 236983 | 4.04 | 158.86GB | 4.21 | 246245 | 0 | 0 | 14 | 0 |
| Total | 5863357 | 100.00 | 3.69TB | 100.00 | 6182377 | 0 | 0 | 373 | 0 |
 |
| Outgoing Feed (+ Top1000 #) | Accepted | %Acc | %Tot | Art/sec | Volume | %Vol | KB/art | Dups | Rejs | % Ratio (Out/In) | ||
|---|---|---|---|---|---|---|---|---|---|---|---|---|
| 1 | 217.73.144.40 | 0 | 0.00 | 0.00 | 0.00 | 0.00KB | 0.00 | 0.00 | 5854740 | 0 | … | |
| Total | 0 | 0.00 | 0.00 | 0.00 | 0.00KB | 0.00 | 0.00 | 5854740 | 0 | |||
 |
| Outgoing Feed (+ Top1000 #) | Volume | %Vol | Kbps | Accepted | %Acc | %Tot | KB/art | Dups | Rejs | % Ratio (Out/In) | ||
|---|---|---|---|---|---|---|---|---|---|---|---|---|
| 1 | 217.73.144.40 | 0.00KB | 0.00 | 0.00 | 0 | 0.00 | 0.00 | 0.00 | 5854740 | 0 | … | |
| Total | 0.00KB | 0.00 | 0.00 | 0 | 0.00 | 0.00 | 0.00 | 5854740 | 0 | |||
 |
| Outgoing Feed (+ Top1000 #) | Rej. Vol. | %Vol | Kbps | Accepted | %Acc | %Tot | KB/art | Dups | Rejs | % Ratio (Out/In) | ||
|---|---|---|---|---|---|---|---|---|---|---|---|---|
| 1 | 217.73.144.40 | 0.00KB | 0.00 | 0.00 | 0 | 0.00 | 0.00 | 0.00 | 5854740 | 0 | … | |
| Total | 0.00KB | 0.00 | 0.00 | 0 | 0.00 | 0.00 | 0.00 | 5854740 | 0 | |||
 |
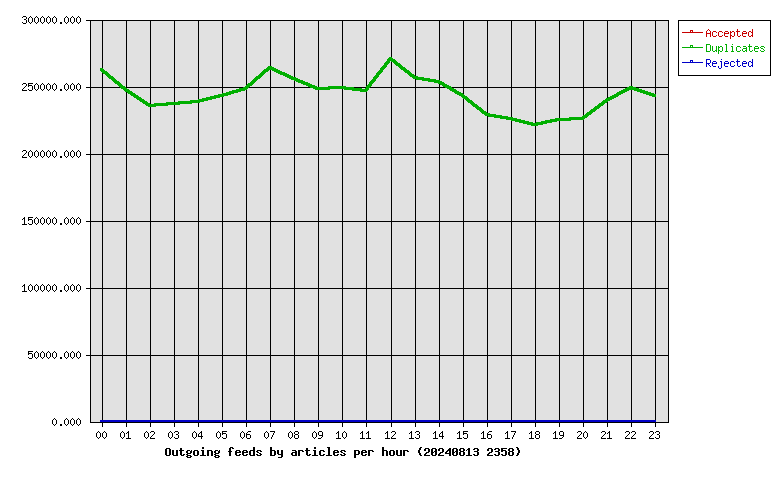
| Hour | Accepted | %Acc | Volume | %Vol | dups | Rejs |
|---|---|---|---|---|---|---|
| 00 | 0 | 0.00 | 0.00KB | 0.00 | 262008 | 0 |
| 01 | 0 | 0.00 | 0.00KB | 0.00 | 247519 | 0 |
| 02 | 0 | 0.00 | 0.00KB | 0.00 | 235326 | 0 |
| 03 | 0 | 0.00 | 0.00KB | 0.00 | 236911 | 0 |
| 04 | 0 | 0.00 | 0.00KB | 0.00 | 238606 | 0 |
| 05 | 0 | 0.00 | 0.00KB | 0.00 | 242653 | 0 |
| 06 | 0 | 0.00 | 0.00KB | 0.00 | 248183 | 0 |
| 07 | 0 | 0.00 | 0.00KB | 0.00 | 263604 | 0 |
| 08 | 0 | 0.00 | 0.00KB | 0.00 | 255718 | 0 |
| 09 | 0 | 0.00 | 0.00KB | 0.00 | 247980 | 0 |
| 10 | 0 | 0.00 | 0.00KB | 0.00 | 249027 | 0 |
| 11 | 0 | 0.00 | 0.00KB | 0.00 | 246804 | 0 |
| 12 | 0 | 0.00 | 0.00KB | 0.00 | 270426 | 0 |
| 13 | 0 | 0.00 | 0.00KB | 0.00 | 256543 | 0 |
| 14 | 0 | 0.00 | 0.00KB | 0.00 | 253288 | 0 |
| 15 | 0 | 0.00 | 0.00KB | 0.00 | 242545 | 0 |
| 16 | 0 | 0.00 | 0.00KB | 0.00 | 228458 | 0 |
| 17 | 0 | 0.00 | 0.00KB | 0.00 | 226020 | 0 |
| 18 | 0 | 0.00 | 0.00KB | 0.00 | 221133 | 0 |
| 19 | 0 | 0.00 | 0.00KB | 0.00 | 225116 | 0 |
| 20 | 0 | 0.00 | 0.00KB | 0.00 | 225763 | 0 |
| 21 | 0 | 0.00 | 0.00KB | 0.00 | 239252 | 0 |
| 22 | 0 | 0.00 | 0.00KB | 0.00 | 248605 | 0 |
| 23 | 0 | 0.00 | 0.00KB | 0.00 | 243252 | 0 |
| Total | 0 | 0.00 | 0.00KB | 0.00 | 5854740 | 0 |
 |
| >= 20% Full | >= 35% Full | >= 50% Full | >= 65% Full | >= 80% Full | >= 95% Full |
| Outgoing Feed | Batch Seq | Batch Num | Batch Max | %Full | Av. Pending |
|---|---|---|---|---|---|
| nbr.elbracht.net-o | 977695-977776 | 81 | 500 | 16 | 0.0 |
| text-spool-out | 0-0 | 0 | 500 | 0 | 0.0 |
| 1st Time | Last Time | # Msgs | Message |
|---|---|---|---|
| 11:43:28 | 11:43:38 | 3 | DNS Fwd/Rev mismatch: lookup of scanner-07.ch1.censys-scanner.com failed |
| 20:38:40 | 1 | DNS Fwd/Rev mismatch: internettl.org/104.152.52.224 | |
| 20:39:09 | 1 | DNS Fwd/Rev mismatch: internettl.org/104.152.52.216 |