| |
DIABLO statistics for newsfeed.yoursite.com on Sun 11 Aug 2024 |
Generated on 20240811 2358 by feeder-stats v4.006. Copyright © 2002 The Diablo Project.
Diablo running processes:  81    Dnewslink running processes:  0


11:59PM  up 175 days,  7:18, 0 users, load averages: 1.15, 0.72, 0.58

Filesystem     Size    Used   Avail Capacity  Mounted on
/dev/da0s1g     94G    1.2G     85G     1%    /news
/dev/da1       7.3T    6.6T    102G    99%    /news2/spool/news/00
/dev/da2       7.3T    6.6T    100G    99%    /news2/spool/news/01
/dev/da3       3.7T    3.3T     62G    98%    /news2/spool/news/02
/dev/da4       5.5T      5T     68G    99%    /news2/spool/news/03
/dev/da8       7.3T    6.6T    106G    98%    /news2/spool/news/04
/dev/da9       7.3T    6.6T    102G    98%    /news2/spool/news/05
/dev/da10      7.3T    6.6T    104G    98%    /news2/spool/news/06
/dev/da11      5.5T      5T     86G    98%    /news2/spool/news/07
/dev/da12      5.5T      5T     71G    99%    /news2/spool/news/08
/dev/da13      7.3T    6.6T    102G    99%    /news2/spool/news/09
/dev/da14      7.3T    6.6T    100G    99%    /news2/spool/news/10
/dev/da15      7.3T    6.6T    100G    99%    /news2/spool/news/11
/dev/da16      7.3T    6.6T    105G    98%    /news2/spool/news/12
/dev/da17      7.3T    6.6T    101G    99%    /news2/spool/news/13
/dev/da18      7.3T    6.6T    104G    98%    /news2/spool/news/14
/dev/da19      7.3T    6.6T    102G    99%    /news2/spool/news/15
/dev/da20      7.3T    6.6T    101G    99%    /news2/spool/news/16
/dev/da21      7.3T    6.6T    100G    99%    /news2/spool/news/17
/dev/da22      7.3T    6.6T    103G    98%    /news2/spool/news/18
/dev/da23      7.3T    6.6T    103G    98%    /news2/spool/news/19
/dev/da24      7.3T    6.6T    103G    98%    /news2/spool/news/20
/dev/da25      7.3T    6.6T    101G    99%    /news2/spool/news/21
/dev/da26      7.3T    6.6T    102G    99%    /news2/spool/news/22
/dev/da5       221G     36G    167G    18%    /news1
/dev/md0        40G     14G     21G    40%    /news3
| Incoming Feed (+ Top1000 #) | Accepted | %Acc | %Tot | Art/sec | Volume | %Vol | KB/art | Check | Ihave | Spam | TooOld | Rejs | Errs | ||
|---|---|---|---|---|---|---|---|---|---|---|---|---|---|---|---|
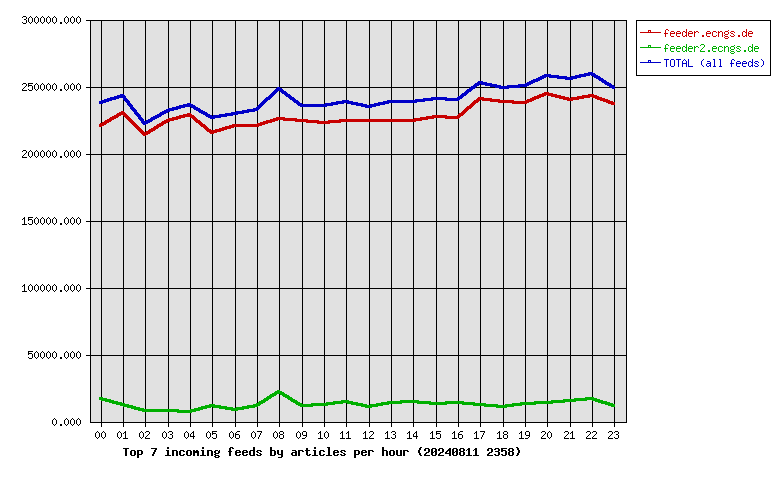
| 1 | feeder.ecngs.de | 5478612 | 94.38 | 94.75 | 63.41 | 3.60TB | 99.93 | 706.00 | 5804363 | 0 | 0 | 0 | 226 | 0 | |
| 2 | feeder2.ecngs.de | 303590 | 91.08 | 5.25 | 3.52 | 2.44GB | 0.07 | 8.42 | 333151 | 0 | 0 | 0 | 165 | 0 | |
| Total | 5782202 | 0.00 | 100.00 | 66.93 | 3.60TB | 100.00 | 669.37 | 6137514 | 0 | 0 | 0 | 391 | 0 | ||
 |
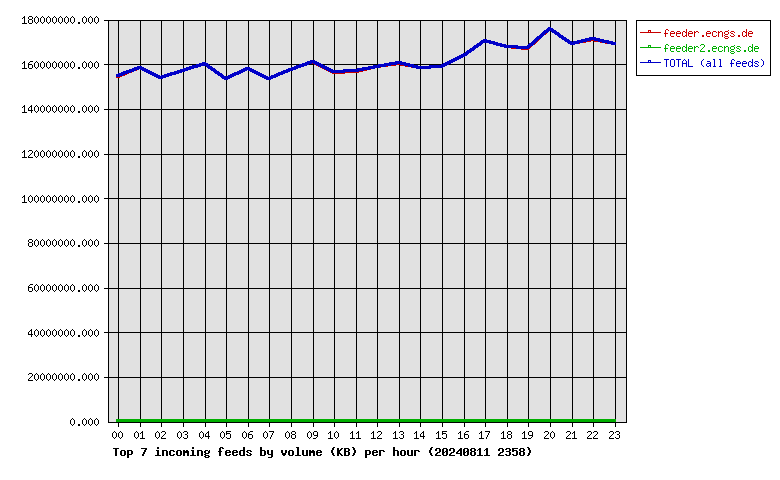
| Incoming Feed (+ Top1000 #) | Volume | %Vol | Kbps | Accepted | %Acc | %Tot | KB/art | Check | Ihave | Spam | TooOld | Rejs | Errs | ||
|---|---|---|---|---|---|---|---|---|---|---|---|---|---|---|---|
| 1 | feeder.ecngs.de | 3.60TB | 99.93 | 358136.87 | 5478612 | 94.38 | 94.75 | 706.00 | 5804363 | 0 | 0 | 0 | 226 | 0 | |
| 2 | feeder2.ecngs.de | 2.44GB | 0.07 | 237.37 | 303590 | 91.08 | 5.25 | 8.42 | 333151 | 0 | 0 | 0 | 165 | 0 | |
| Total | 3.60TB | 100.00 | 358374.24 | 5782202 | 0.00 | 100.00 | 669.37 | 6137514 | 0 | 0 | 0 | 391 | 0 | ||
 |
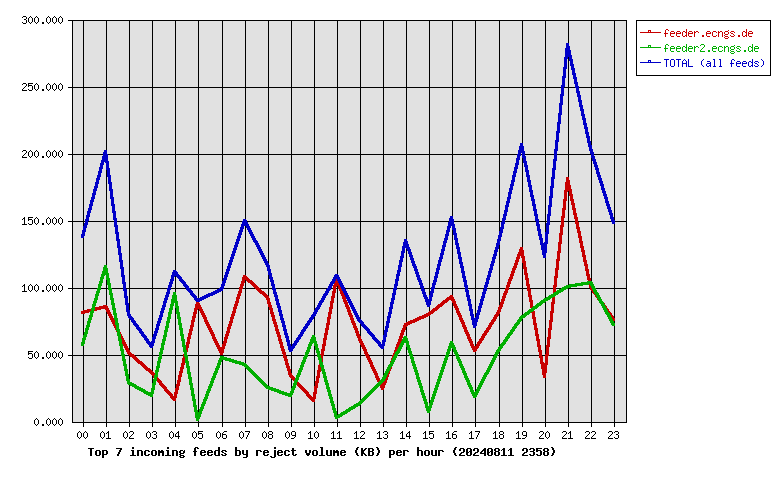
| Incoming Feed (+ Top1000 #) | Rej. Vol. | %Vol | Kbps | Accepted | %Acc | %Tot | KB/art | Check | Ihave | Spam | TooOld | Rejs | Errs | ||
|---|---|---|---|---|---|---|---|---|---|---|---|---|---|---|---|
| 1 | feeder.ecngs.de | 1.70MB | 59.24 | 0.16 | 5478612 | 94.38 | 94.75 | 706.00 | 5804363 | 0 | 0 | 0 | 226 | 0 | |
| 2 | feeder2.ecngs.de | 1.17MB | 40.76 | 0.11 | 303590 | 91.08 | 5.25 | 8.42 | 333151 | 0 | 0 | 0 | 165 | 0 | |
| Total | 2.88MB | 100.00 | 0.27 | 5782202 | 0.00 | 100.00 | 669.37 | 6137514 | 0 | 0 | 0 | 391 | 0 | ||
 |
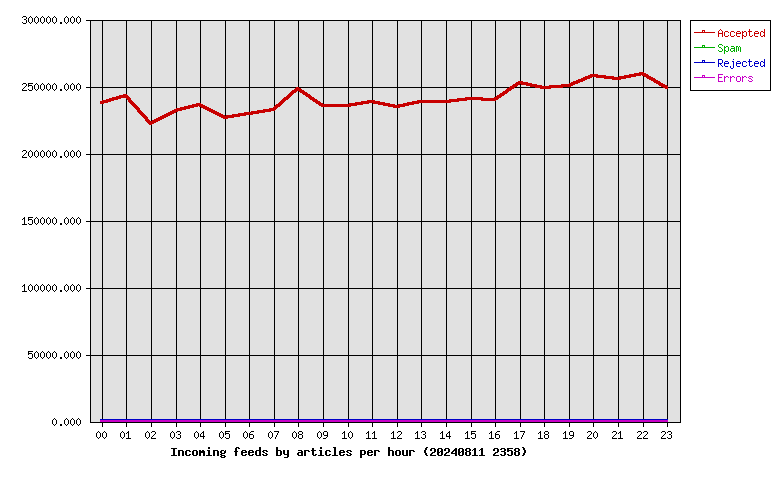
| Hour | Accepted | %Acc | Volume | %Vol | Check | Ihave | Spam | Rejs | Errs |
|---|---|---|---|---|---|---|---|---|---|
| 00 | 237708 | 4.11 | 147.41GB | 3.99 | 257353 | 0 | 0 | 17 | 0 |
| 01 | 242729 | 4.20 | 150.89GB | 4.09 | 257128 | 0 | 0 | 14 | 0 |
| 02 | 221686 | 3.83 | 146.54GB | 3.97 | 230419 | 0 | 0 | 10 | 0 |
| 03 | 232051 | 4.01 | 149.53GB | 4.05 | 240448 | 0 | 0 | 8 | 0 |
| 04 | 235930 | 4.08 | 152.81GB | 4.14 | 244677 | 0 | 0 | 12 | 0 |
| 05 | 226672 | 3.92 | 146.34GB | 3.96 | 246783 | 0 | 0 | 11 | 0 |
| 06 | 229458 | 3.97 | 150.41GB | 4.07 | 239395 | 0 | 0 | 17 | 0 |
| 07 | 232499 | 4.02 | 146.23GB | 3.96 | 245625 | 0 | 0 | 16 | 0 |
| 08 | 247987 | 4.29 | 150.28GB | 4.07 | 272845 | 0 | 0 | 29 | 0 |
| 09 | 235387 | 4.07 | 153.61GB | 4.16 | 248177 | 0 | 0 | 11 | 0 |
| 10 | 235559 | 4.07 | 149.09GB | 4.04 | 249910 | 0 | 0 | 8 | 0 |
| 11 | 238707 | 4.13 | 149.54GB | 4.05 | 255570 | 0 | 0 | 17 | 0 |
| 12 | 235007 | 4.06 | 151.35GB | 4.10 | 247035 | 0 | 0 | 14 | 0 |
| 13 | 238212 | 4.12 | 152.88GB | 4.14 | 254893 | 0 | 0 | 14 | 0 |
| 14 | 238513 | 4.12 | 151.11GB | 4.09 | 254883 | 0 | 0 | 17 | 0 |
| 15 | 240513 | 4.16 | 151.36GB | 4.10 | 254494 | 0 | 0 | 12 | 0 |
| 16 | 240153 | 4.15 | 156.01GB | 4.23 | 256769 | 0 | 0 | 19 | 0 |
| 17 | 252468 | 4.37 | 162.66GB | 4.41 | 265955 | 0 | 0 | 14 | 0 |
| 18 | 249005 | 4.31 | 160.07GB | 4.34 | 261174 | 0 | 0 | 17 | 0 |
| 19 | 250449 | 4.33 | 159.32GB | 4.32 | 264878 | 0 | 0 | 26 | 0 |
| 20 | 258171 | 4.46 | 167.80GB | 4.55 | 274009 | 0 | 0 | 16 | 0 |
| 21 | 255506 | 4.42 | 161.34GB | 4.37 | 273654 | 0 | 0 | 26 | 0 |
| 22 | 259249 | 4.48 | 163.25GB | 4.42 | 279780 | 0 | 0 | 25 | 0 |
| 23 | 248583 | 4.30 | 161.28GB | 4.37 | 261660 | 0 | 0 | 21 | 0 |
| Total | 5782202 | 100.00 | 3.60TB | 100.00 | 6137514 | 0 | 0 | 391 | 0 |
 |
| Outgoing Feed (+ Top1000 #) | Accepted | %Acc | %Tot | Art/sec | Volume | %Vol | KB/art | Dups | Rejs | % Ratio (Out/In) | ||
|---|---|---|---|---|---|---|---|---|---|---|---|---|
| 1 | 217.73.144.40 | 0 | 0.00 | 0.00 | 0.00 | 0.00KB | 0.00 | 0.00 | 5591081 | 0 | … | |
| Total | 0 | 0.00 | 0.00 | 0.00 | 0.00KB | 0.00 | 0.00 | 5591081 | 0 | |||
 |
| Outgoing Feed (+ Top1000 #) | Volume | %Vol | Kbps | Accepted | %Acc | %Tot | KB/art | Dups | Rejs | % Ratio (Out/In) | ||
|---|---|---|---|---|---|---|---|---|---|---|---|---|
| 1 | 217.73.144.40 | 0.00KB | 0.00 | 0.00 | 0 | 0.00 | 0.00 | 0.00 | 5591081 | 0 | … | |
| Total | 0.00KB | 0.00 | 0.00 | 0 | 0.00 | 0.00 | 0.00 | 5591081 | 0 | |||
 |
| Outgoing Feed (+ Top1000 #) | Rej. Vol. | %Vol | Kbps | Accepted | %Acc | %Tot | KB/art | Dups | Rejs | % Ratio (Out/In) | ||
|---|---|---|---|---|---|---|---|---|---|---|---|---|
| 1 | 217.73.144.40 | 0.00KB | 0.00 | 0.00 | 0 | 0.00 | 0.00 | 0.00 | 5591081 | 0 | … | |
| Total | 0.00KB | 0.00 | 0.00 | 0 | 0.00 | 0.00 | 0.00 | 5591081 | 0 | |||
 |
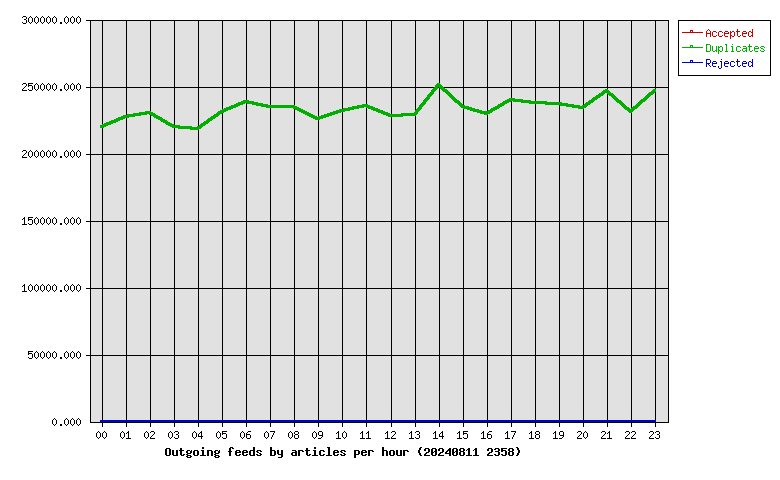
| Hour | Accepted | %Acc | Volume | %Vol | dups | Rejs |
|---|---|---|---|---|---|---|
| 00 | 0 | 0.00 | 0.00KB | 0.00 | 219793 | 0 |
| 01 | 0 | 0.00 | 0.00KB | 0.00 | 227180 | 0 |
| 02 | 0 | 0.00 | 0.00KB | 0.00 | 230036 | 0 |
| 03 | 0 | 0.00 | 0.00KB | 0.00 | 219911 | 0 |
| 04 | 0 | 0.00 | 0.00KB | 0.00 | 218283 | 0 |
| 05 | 0 | 0.00 | 0.00KB | 0.00 | 230756 | 0 |
| 06 | 0 | 0.00 | 0.00KB | 0.00 | 238286 | 0 |
| 07 | 0 | 0.00 | 0.00KB | 0.00 | 234649 | 0 |
| 08 | 0 | 0.00 | 0.00KB | 0.00 | 234620 | 0 |
| 09 | 0 | 0.00 | 0.00KB | 0.00 | 226055 | 0 |
| 10 | 0 | 0.00 | 0.00KB | 0.00 | 231926 | 0 |
| 11 | 0 | 0.00 | 0.00KB | 0.00 | 235345 | 0 |
| 12 | 0 | 0.00 | 0.00KB | 0.00 | 227814 | 0 |
| 13 | 0 | 0.00 | 0.00KB | 0.00 | 228629 | 0 |
| 14 | 0 | 0.00 | 0.00KB | 0.00 | 251189 | 0 |
| 15 | 0 | 0.00 | 0.00KB | 0.00 | 234352 | 0 |
| 16 | 0 | 0.00 | 0.00KB | 0.00 | 229187 | 0 |
| 17 | 0 | 0.00 | 0.00KB | 0.00 | 240141 | 0 |
| 18 | 0 | 0.00 | 0.00KB | 0.00 | 237752 | 0 |
| 19 | 0 | 0.00 | 0.00KB | 0.00 | 237096 | 0 |
| 20 | 0 | 0.00 | 0.00KB | 0.00 | 234044 | 0 |
| 21 | 0 | 0.00 | 0.00KB | 0.00 | 246408 | 0 |
| 22 | 0 | 0.00 | 0.00KB | 0.00 | 230815 | 0 |
| 23 | 0 | 0.00 | 0.00KB | 0.00 | 246814 | 0 |
| Total | 0 | 0.00 | 0.00KB | 0.00 | 5591081 | 0 |
 |
| >= 20% Full | >= 35% Full | >= 50% Full | >= 65% Full | >= 80% Full | >= 95% Full |
| Outgoing Feed | Batch Seq | Batch Num | Batch Max | %Full | Av. Pending |
|---|---|---|---|---|---|
| nbr.elbracht.net-o | 977119-977200 | 81 | 500 | 16 | 0.0 |
| text-spool-out | 0-0 | 0 | 500 | 0 | 0.0 |
| 1st Time | Last Time | # Msgs | Message |
|---|