| |
DIABLO statistics for newsfeed.yoursite.com on Sat 10 Aug 2024 |
Generated on 20240810 2358 by feeder-stats v4.006. Copyright © 2002 The Diablo Project.
Diablo running processes:  81    Dnewslink running processes:  0


11:59PM  up 174 days,  7:18, 0 users, load averages: 1.12, 0.77, 0.71

Filesystem     Size    Used   Avail Capacity  Mounted on
/dev/da0s1g     94G    1.2G     85G     1%    /news
/dev/da1       7.3T    6.6T     90G    99%    /news2/spool/news/00
/dev/da2       7.3T    6.6T     89G    99%    /news2/spool/news/01
/dev/da3       3.7T    3.3T     66G    98%    /news2/spool/news/02
/dev/da4       5.5T      5T     67G    99%    /news2/spool/news/03
/dev/da8       7.3T    6.6T     94G    99%    /news2/spool/news/04
/dev/da9       7.3T    6.6T     90G    99%    /news2/spool/news/05
/dev/da10      7.3T    6.6T     91G    99%    /news2/spool/news/06
/dev/da11      5.5T      5T     85G    98%    /news2/spool/news/07
/dev/da12      5.5T      5T     64G    99%    /news2/spool/news/08
/dev/da13      7.3T    6.6T     90G    99%    /news2/spool/news/09
/dev/da14      7.3T    6.6T     89G    99%    /news2/spool/news/10
/dev/da15      7.3T    6.6T     88G    99%    /news2/spool/news/11
/dev/da16      7.3T    6.6T     93G    99%    /news2/spool/news/12
/dev/da17      7.3T    6.6T     88G    99%    /news2/spool/news/13
/dev/da18      7.3T    6.6T     92G    99%    /news2/spool/news/14
/dev/da19      7.3T    6.6T     90G    99%    /news2/spool/news/15
/dev/da20      7.3T    6.6T     88G    99%    /news2/spool/news/16
/dev/da21      7.3T    6.6T     88G    99%    /news2/spool/news/17
/dev/da22      7.3T    6.6T     90G    99%    /news2/spool/news/18
/dev/da23      7.3T    6.6T     91G    99%    /news2/spool/news/19
/dev/da24      7.3T    6.6T     90G    99%    /news2/spool/news/20
/dev/da25      7.3T    6.6T     89G    99%    /news2/spool/news/21
/dev/da26      7.3T    6.6T     91G    99%    /news2/spool/news/22
/dev/da5       221G     36G    167G    18%    /news1
/dev/md0        40G     14G     21G    40%    /news3
| Incoming Feed (+ Top1000 #) | Accepted | %Acc | %Tot | Art/sec | Volume | %Vol | KB/art | Check | Ihave | Spam | TooOld | Rejs | Errs | ||
|---|---|---|---|---|---|---|---|---|---|---|---|---|---|---|---|
| 1 | feeder.ecngs.de | 5332187 | 95.01 | 95.30 | 61.72 | 3.64TB | 99.94 | 732.42 | 5612064 | 0 | 0 | 0 | 187 | 0 | |
| 2 | feeder2.ecngs.de | 262841 | 91.69 | 4.70 | 3.05 | 2.17GB | 0.06 | 8.68 | 286547 | 0 | 0 | 0 | 103 | 0 | |
| Total | 5595028 | 0.00 | 100.00 | 64.77 | 3.64TB | 100.00 | 698.42 | 5898611 | 0 | 0 | 0 | 290 | 0 | ||
 |
| Incoming Feed (+ Top1000 #) | Volume | %Vol | Kbps | Accepted | %Acc | %Tot | KB/art | Check | Ihave | Spam | TooOld | Rejs | Errs | ||
|---|---|---|---|---|---|---|---|---|---|---|---|---|---|---|---|
| 1 | feeder.ecngs.de | 3.64TB | 99.94 | 361609.41 | 5332187 | 95.01 | 95.30 | 732.42 | 5612064 | 0 | 0 | 0 | 187 | 0 | |
| 2 | feeder2.ecngs.de | 2.17GB | 0.06 | 211.94 | 262841 | 91.69 | 4.70 | 8.68 | 286547 | 0 | 0 | 0 | 103 | 0 | |
| Total | 3.64TB | 100.00 | 361821.35 | 5595028 | 0.00 | 100.00 | 698.42 | 5898611 | 0 | 0 | 0 | 290 | 0 | ||
 |
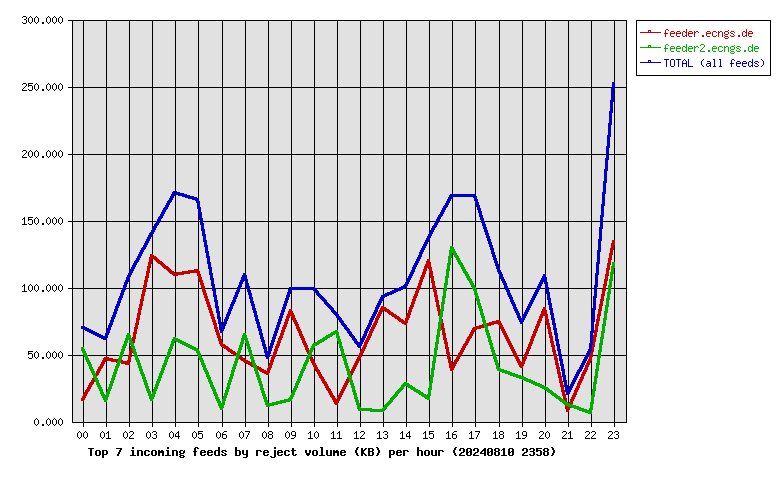
| Incoming Feed (+ Top1000 #) | Rej. Vol. | %Vol | Kbps | Accepted | %Acc | %Tot | KB/art | Check | Ihave | Spam | TooOld | Rejs | Errs | ||
|---|---|---|---|---|---|---|---|---|---|---|---|---|---|---|---|
| 1 | feeder.ecngs.de | 1.51MB | 60.38 | 0.14 | 5332187 | 95.01 | 95.30 | 732.42 | 5612064 | 0 | 0 | 0 | 187 | 0 | |
| 2 | feeder2.ecngs.de | 1014.10KB | 39.62 | 0.09 | 262841 | 91.69 | 4.70 | 8.68 | 286547 | 0 | 0 | 0 | 103 | 0 | |
| Total | 2.50MB | 100.00 | 0.24 | 5595028 | 0.00 | 100.00 | 698.42 | 5898611 | 0 | 0 | 0 | 290 | 0 | ||
 |
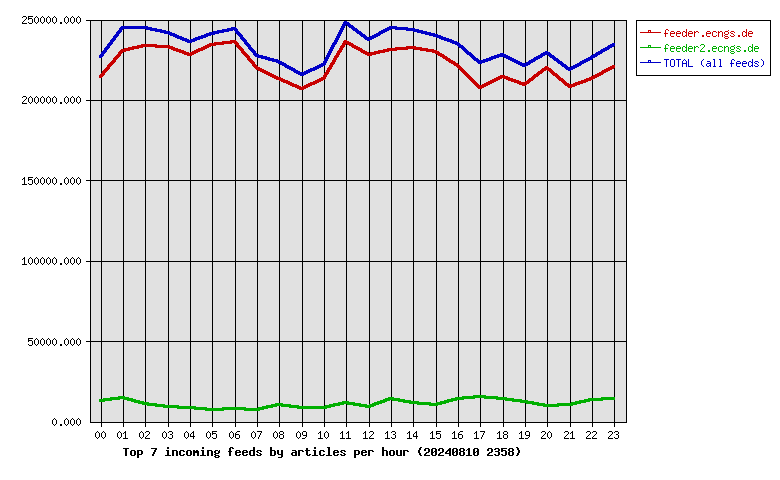
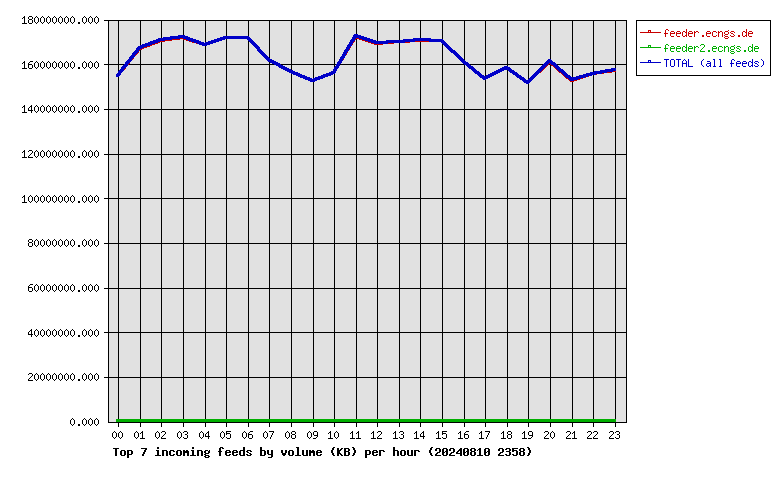
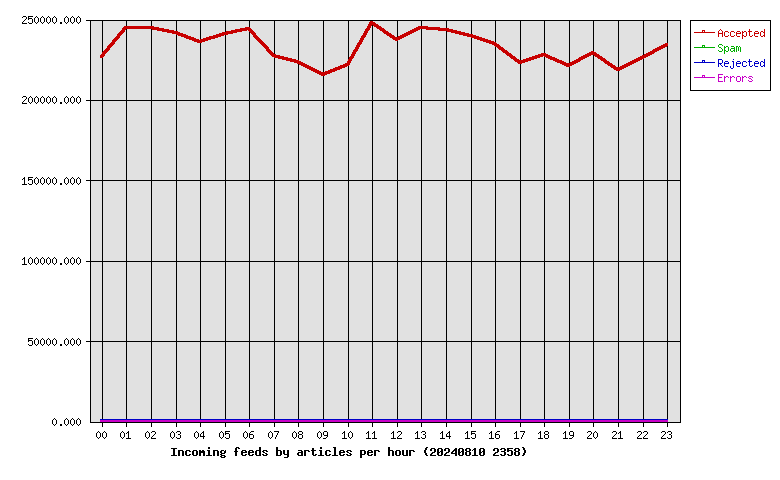
| Hour | Accepted | %Acc | Volume | %Vol | Check | Ihave | Spam | Rejs | Errs |
|---|---|---|---|---|---|---|---|---|---|
| 00 | 226451 | 4.05 | 147.63GB | 3.96 | 240655 | 0 | 0 | 9 | 0 |
| 01 | 244803 | 4.38 | 159.36GB | 4.28 | 261016 | 0 | 0 | 15 | 0 |
| 02 | 244503 | 4.37 | 162.74GB | 4.37 | 256758 | 0 | 0 | 13 | 0 |
| 03 | 241887 | 4.32 | 164.01GB | 4.40 | 251181 | 0 | 0 | 13 | 0 |
| 04 | 236298 | 4.22 | 160.66GB | 4.31 | 247301 | 0 | 0 | 17 | 0 |
| 05 | 241257 | 4.31 | 163.67GB | 4.39 | 253534 | 0 | 0 | 15 | 0 |
| 06 | 243918 | 4.36 | 163.83GB | 4.40 | 252952 | 0 | 0 | 10 | 0 |
| 07 | 227118 | 4.06 | 154.33GB | 4.14 | 235767 | 0 | 0 | 12 | 0 |
| 08 | 223718 | 4.00 | 149.44GB | 4.01 | 235897 | 0 | 0 | 12 | 0 |
| 09 | 215470 | 3.85 | 145.46GB | 3.90 | 224824 | 0 | 0 | 10 | 0 |
| 10 | 221675 | 3.96 | 148.68GB | 3.99 | 231504 | 0 | 0 | 12 | 0 |
| 11 | 247846 | 4.43 | 164.44GB | 4.41 | 260949 | 0 | 0 | 6 | 0 |
| 12 | 237430 | 4.24 | 161.45GB | 4.33 | 248020 | 0 | 0 | 6 | 0 |
| 13 | 244917 | 4.38 | 162.17GB | 4.35 | 260304 | 0 | 0 | 9 | 0 |
| 14 | 243498 | 4.35 | 162.77GB | 4.37 | 256268 | 0 | 0 | 9 | 0 |
| 15 | 240032 | 4.29 | 162.61GB | 4.36 | 251753 | 0 | 0 | 13 | 0 |
| 16 | 234950 | 4.20 | 153.62GB | 4.12 | 250575 | 0 | 0 | 13 | 0 |
| 17 | 222721 | 3.98 | 146.33GB | 3.93 | 239924 | 0 | 0 | 20 | 0 |
| 18 | 228175 | 4.08 | 150.94GB | 4.05 | 243794 | 0 | 0 | 15 | 0 |
| 19 | 221018 | 3.95 | 144.70GB | 3.88 | 234811 | 0 | 0 | 7 | 0 |
| 20 | 229007 | 4.09 | 153.80GB | 4.13 | 239543 | 0 | 0 | 13 | 0 |
| 21 | 218310 | 3.90 | 145.64GB | 3.91 | 230275 | 0 | 0 | 5 | 0 |
| 22 | 225990 | 4.04 | 148.43GB | 3.98 | 240878 | 0 | 0 | 17 | 0 |
| 23 | 234036 | 4.18 | 149.94GB | 4.02 | 250128 | 0 | 0 | 19 | 0 |
| Total | 5595028 | 100.00 | 3.64TB | 100.00 | 5898611 | 0 | 0 | 290 | 0 |
 |
| Outgoing Feed (+ Top1000 #) | Accepted | %Acc | %Tot | Art/sec | Volume | %Vol | KB/art | Dups | Rejs | % Ratio (Out/In) | ||
|---|---|---|---|---|---|---|---|---|---|---|---|---|
| 1 | 217.73.144.40 | 0 | 0.00 | 0.00 | 0.00 | 0.00KB | 0.00 | 0.00 | 5614912 | 0 | … | |
| Total | 0 | 0.00 | 0.00 | 0.00 | 0.00KB | 0.00 | 0.00 | 5614912 | 0 | |||
 |
| Outgoing Feed (+ Top1000 #) | Volume | %Vol | Kbps | Accepted | %Acc | %Tot | KB/art | Dups | Rejs | % Ratio (Out/In) | ||
|---|---|---|---|---|---|---|---|---|---|---|---|---|
| 1 | 217.73.144.40 | 0.00KB | 0.00 | 0.00 | 0 | 0.00 | 0.00 | 0.00 | 5614912 | 0 | … | |
| Total | 0.00KB | 0.00 | 0.00 | 0 | 0.00 | 0.00 | 0.00 | 5614912 | 0 | |||
 |
| Outgoing Feed (+ Top1000 #) | Rej. Vol. | %Vol | Kbps | Accepted | %Acc | %Tot | KB/art | Dups | Rejs | % Ratio (Out/In) | ||
|---|---|---|---|---|---|---|---|---|---|---|---|---|
| 1 | 217.73.144.40 | 0.00KB | 0.00 | 0.00 | 0 | 0.00 | 0.00 | 0.00 | 5614912 | 0 | … | |
| Total | 0.00KB | 0.00 | 0.00 | 0 | 0.00 | 0.00 | 0.00 | 5614912 | 0 | |||
 |
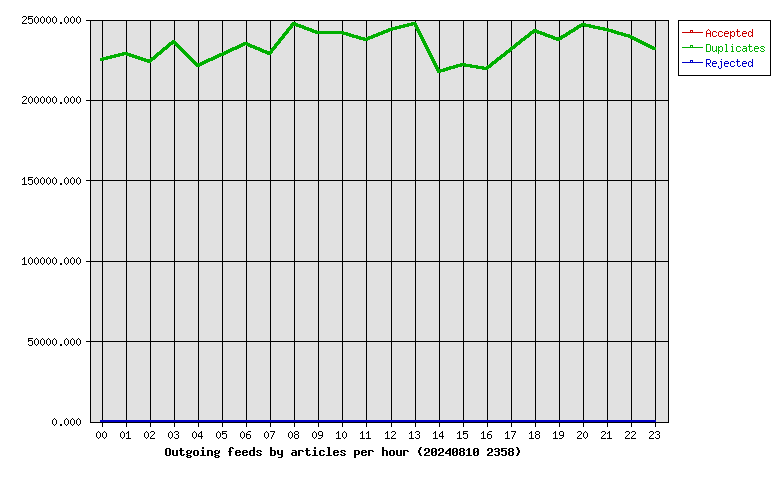
| Hour | Accepted | %Acc | Volume | %Vol | dups | Rejs |
|---|---|---|---|---|---|---|
| 00 | 0 | 0.00 | 0.00KB | 0.00 | 224902 | 0 |
| 01 | 0 | 0.00 | 0.00KB | 0.00 | 228565 | 0 |
| 02 | 0 | 0.00 | 0.00KB | 0.00 | 223659 | 0 |
| 03 | 0 | 0.00 | 0.00KB | 0.00 | 235814 | 0 |
| 04 | 0 | 0.00 | 0.00KB | 0.00 | 221282 | 0 |
| 05 | 0 | 0.00 | 0.00KB | 0.00 | 228156 | 0 |
| 06 | 0 | 0.00 | 0.00KB | 0.00 | 234977 | 0 |
| 07 | 0 | 0.00 | 0.00KB | 0.00 | 228469 | 0 |
| 08 | 0 | 0.00 | 0.00KB | 0.00 | 246947 | 0 |
| 09 | 0 | 0.00 | 0.00KB | 0.00 | 241356 | 0 |
| 10 | 0 | 0.00 | 0.00KB | 0.00 | 241723 | 0 |
| 11 | 0 | 0.00 | 0.00KB | 0.00 | 237415 | 0 |
| 12 | 0 | 0.00 | 0.00KB | 0.00 | 243616 | 0 |
| 13 | 0 | 0.00 | 0.00KB | 0.00 | 247367 | 0 |
| 14 | 0 | 0.00 | 0.00KB | 0.00 | 217570 | 0 |
| 15 | 0 | 0.00 | 0.00KB | 0.00 | 221775 | 0 |
| 16 | 0 | 0.00 | 0.00KB | 0.00 | 218928 | 0 |
| 17 | 0 | 0.00 | 0.00KB | 0.00 | 231215 | 0 |
| 18 | 0 | 0.00 | 0.00KB | 0.00 | 242753 | 0 |
| 19 | 0 | 0.00 | 0.00KB | 0.00 | 237193 | 0 |
| 20 | 0 | 0.00 | 0.00KB | 0.00 | 246847 | 0 |
| 21 | 0 | 0.00 | 0.00KB | 0.00 | 243683 | 0 |
| 22 | 0 | 0.00 | 0.00KB | 0.00 | 239147 | 0 |
| 23 | 0 | 0.00 | 0.00KB | 0.00 | 231553 | 0 |
| Total | 0 | 0.00 | 0.00KB | 0.00 | 5614912 | 0 |
 |
| >= 20% Full | >= 35% Full | >= 50% Full | >= 65% Full | >= 80% Full | >= 95% Full |
| Outgoing Feed | Batch Seq | Batch Num | Batch Max | %Full | Av. Pending |
|---|---|---|---|---|---|
| nbr.elbracht.net-o | 976831-976912 | 81 | 500 | 16 | 0.0 |
| text-spool-out | 0-0 | 0 | 500 | 0 | 0.0 |
| 1st Time | Last Time | # Msgs | Message |
|---|---|---|---|
| 18:57:42 | 18:59:47 | 2 | DNS Fwd/Rev mismatch: lookup of ip232.208-100-26.static.steadfastdns.net failed |