| |
DIABLO statistics for newsfeed.yoursite.com on Fri 09 Aug 2024 |
Generated on 20240809 2358 by feeder-stats v4.006. Copyright © 2002 The Diablo Project.
Diablo running processes:  81    Dnewslink running processes:  0


11:59PM  up 173 days,  7:18, 0 users, load averages: 1.19, 0.93, 0.75

Filesystem     Size    Used   Avail Capacity  Mounted on
/dev/da0s1g     94G    1.2G     85G     1%    /news
/dev/da1       7.3T    6.6T     91G    99%    /news2/spool/news/00
/dev/da2       7.3T    6.6T     89G    99%    /news2/spool/news/01
/dev/da3       3.7T    3.3T     65G    98%    /news2/spool/news/02
/dev/da4       5.5T      5T     66G    99%    /news2/spool/news/03
/dev/da8       7.3T    6.6T     93G    99%    /news2/spool/news/04
/dev/da9       7.3T    6.6T     90G    99%    /news2/spool/news/05
/dev/da10      7.3T    6.6T     92G    99%    /news2/spool/news/06
/dev/da11      5.5T      5T     88G    98%    /news2/spool/news/07
/dev/da12      5.5T      5T     63G    99%    /news2/spool/news/08
/dev/da13      7.3T    6.6T     90G    99%    /news2/spool/news/09
/dev/da14      7.3T    6.6T     89G    99%    /news2/spool/news/10
/dev/da15      7.3T    6.6T     88G    99%    /news2/spool/news/11
/dev/da16      7.3T    6.6T     93G    99%    /news2/spool/news/12
/dev/da17      7.3T    6.6T     89G    99%    /news2/spool/news/13
/dev/da18      7.3T    6.6T     91G    99%    /news2/spool/news/14
/dev/da19      7.3T    6.6T     89G    99%    /news2/spool/news/15
/dev/da20      7.3T    6.6T     88G    99%    /news2/spool/news/16
/dev/da21      7.3T    6.6T     87G    99%    /news2/spool/news/17
/dev/da22      7.3T    6.6T     90G    99%    /news2/spool/news/18
/dev/da23      7.3T    6.6T     90G    99%    /news2/spool/news/19
/dev/da24      7.3T    6.6T     91G    99%    /news2/spool/news/20
/dev/da25      7.3T    6.6T     89G    99%    /news2/spool/news/21
/dev/da26      7.3T    6.6T     90G    99%    /news2/spool/news/22
/dev/da5       221G     36G    167G    18%    /news1
/dev/md0        40G     14G     21G    40%    /news3
| Incoming Feed (+ Top1000 #) | Accepted | %Acc | %Tot | Art/sec | Volume | %Vol | KB/art | Check | Ihave | Spam | TooOld | Rejs | Errs | ||
|---|---|---|---|---|---|---|---|---|---|---|---|---|---|---|---|
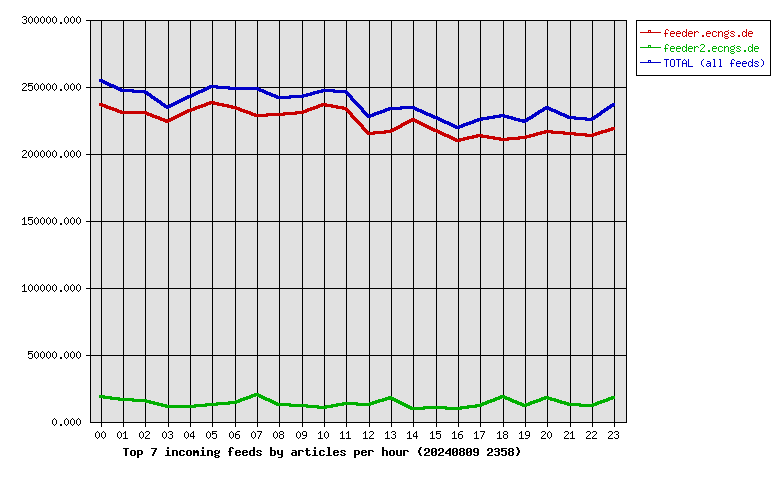
| 1 | feeder.ecngs.de | 5360231 | 93.92 | 94.33 | 62.04 | 3.51TB | 99.93 | 703.27 | 5707060 | 0 | 0 | 0 | 212 | 0 | |
| 2 | feeder2.ecngs.de | 321907 | 91.34 | 5.67 | 3.74 | 2.70GB | 0.07 | 8.78 | 352298 | 0 | 0 | 0 | 147 | 0 | |
| Total | 5682138 | 0.00 | 100.00 | 65.78 | 3.51TB | 100.00 | 663.93 | 6059358 | 0 | 0 | 0 | 359 | 0 | ||
 |
| Incoming Feed (+ Top1000 #) | Volume | %Vol | Kbps | Accepted | %Acc | %Tot | KB/art | Check | Ihave | Spam | TooOld | Rejs | Errs | ||
|---|---|---|---|---|---|---|---|---|---|---|---|---|---|---|---|
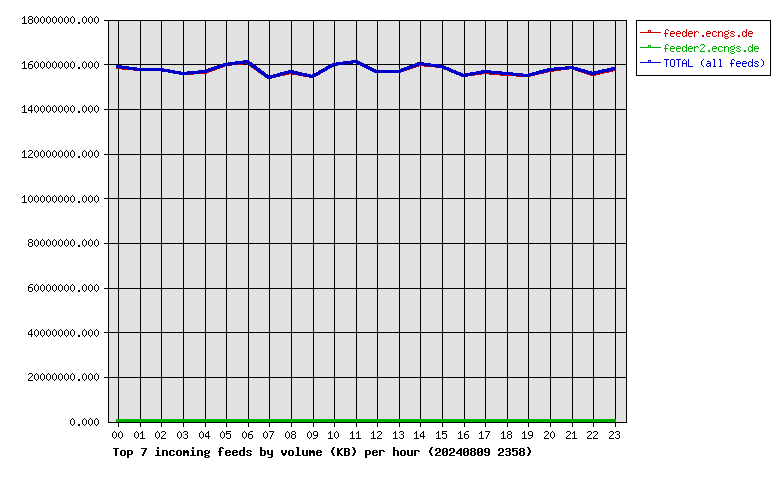
| 1 | feeder.ecngs.de | 3.51TB | 99.93 | 349045.55 | 5360231 | 93.92 | 94.33 | 703.27 | 5707060 | 0 | 0 | 0 | 212 | 0 | |
| 2 | feeder2.ecngs.de | 2.70GB | 0.07 | 262.67 | 321907 | 91.34 | 5.67 | 8.78 | 352298 | 0 | 0 | 0 | 147 | 0 | |
| Total | 3.51TB | 100.00 | 349308.21 | 5682138 | 0.00 | 100.00 | 663.93 | 6059358 | 0 | 0 | 0 | 359 | 0 | ||
 |
| Incoming Feed (+ Top1000 #) | Rej. Vol. | %Vol | Kbps | Accepted | %Acc | %Tot | KB/art | Check | Ihave | Spam | TooOld | Rejs | Errs | ||
|---|---|---|---|---|---|---|---|---|---|---|---|---|---|---|---|
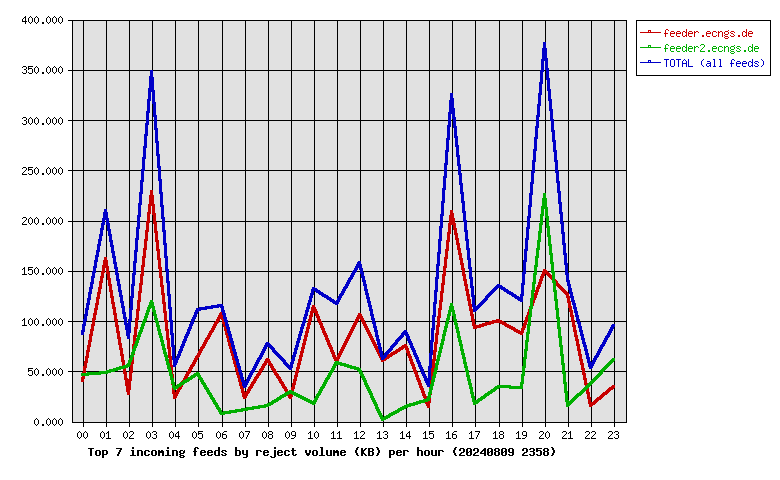
| 1 | feeder.ecngs.de | 1.96MB | 64.16 | 0.19 | 5360231 | 93.92 | 94.33 | 703.27 | 5707060 | 0 | 0 | 0 | 212 | 0 | |
| 2 | feeder2.ecngs.de | 1.09MB | 35.84 | 0.10 | 321907 | 91.34 | 5.67 | 8.78 | 352298 | 0 | 0 | 0 | 147 | 0 | |
| Total | 3.05MB | 100.00 | 0.29 | 5682138 | 0.00 | 100.00 | 663.93 | 6059358 | 0 | 0 | 0 | 359 | 0 | ||
 |
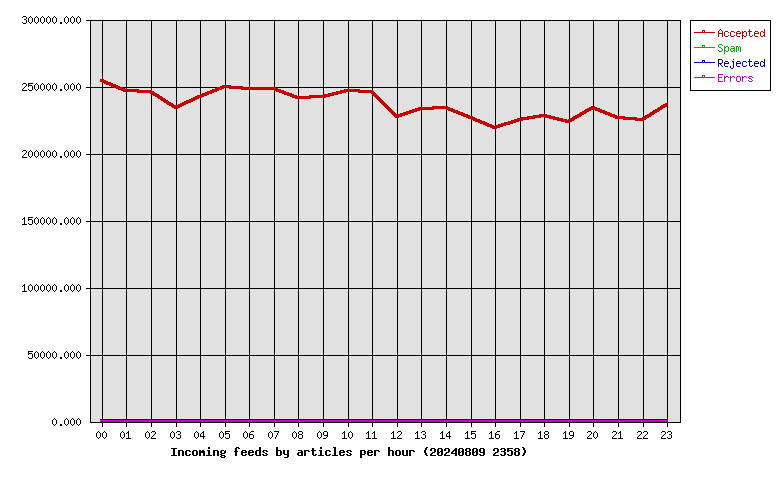
| Hour | Accepted | %Acc | Volume | %Vol | Check | Ihave | Spam | Rejs | Errs |
|---|---|---|---|---|---|---|---|---|---|
| 00 | 253768 | 4.47 | 151.26GB | 4.20 | 274097 | 0 | 0 | 8 | 0 |
| 01 | 246444 | 4.34 | 150.31GB | 4.18 | 264801 | 0 | 0 | 15 | 0 |
| 02 | 245616 | 4.32 | 150.04GB | 4.17 | 262776 | 0 | 0 | 15 | 0 |
| 03 | 234018 | 4.12 | 148.41GB | 4.12 | 245686 | 0 | 0 | 24 | 0 |
| 04 | 242483 | 4.27 | 149.11GB | 4.14 | 255201 | 0 | 0 | 11 | 0 |
| 05 | 249709 | 4.39 | 152.36GB | 4.23 | 271116 | 0 | 0 | 11 | 0 |
| 06 | 248122 | 4.37 | 153.38GB | 4.26 | 263538 | 0 | 0 | 11 | 0 |
| 07 | 248028 | 4.37 | 146.59GB | 4.07 | 271041 | 0 | 0 | 11 | 0 |
| 08 | 241565 | 4.25 | 149.12GB | 4.14 | 256107 | 0 | 0 | 8 | 0 |
| 09 | 242282 | 4.26 | 147.20GB | 4.09 | 257026 | 0 | 0 | 8 | 0 |
| 10 | 246727 | 4.34 | 152.19GB | 4.23 | 258285 | 0 | 0 | 14 | 0 |
| 11 | 245972 | 4.33 | 153.54GB | 4.27 | 262311 | 0 | 0 | 16 | 0 |
| 12 | 226897 | 3.99 | 149.23GB | 4.15 | 240988 | 0 | 0 | 20 | 0 |
| 13 | 233520 | 4.11 | 149.33GB | 4.15 | 253129 | 0 | 0 | 8 | 0 |
| 14 | 233618 | 4.11 | 152.49GB | 4.24 | 243954 | 0 | 0 | 14 | 0 |
| 15 | 226480 | 3.99 | 151.42GB | 4.21 | 235306 | 0 | 0 | 4 | 0 |
| 16 | 218887 | 3.85 | 147.55GB | 4.10 | 230920 | 0 | 0 | 25 | 0 |
| 17 | 224682 | 3.95 | 149.10GB | 4.14 | 237513 | 0 | 0 | 16 | 0 |
| 18 | 228248 | 4.02 | 148.24GB | 4.12 | 248653 | 0 | 0 | 31 | 0 |
| 19 | 223639 | 3.94 | 147.41GB | 4.10 | 237380 | 0 | 0 | 16 | 0 |
| 20 | 233653 | 4.11 | 150.00GB | 4.17 | 254406 | 0 | 0 | 37 | 0 |
| 21 | 226724 | 3.99 | 150.92GB | 4.19 | 240717 | 0 | 0 | 11 | 0 |
| 22 | 224768 | 3.96 | 148.22GB | 4.12 | 237761 | 0 | 0 | 10 | 0 |
| 23 | 236288 | 4.16 | 150.34GB | 4.18 | 256646 | 0 | 0 | 15 | 0 |
| Total | 5682138 | 100.00 | 3.51TB | 100.00 | 6059358 | 0 | 0 | 359 | 0 |
 |
| Outgoing Feed (+ Top1000 #) | Accepted | %Acc | %Tot | Art/sec | Volume | %Vol | KB/art | Dups | Rejs | % Ratio (Out/In) | ||
|---|---|---|---|---|---|---|---|---|---|---|---|---|
| 1 | 217.73.144.40 | 0 | 0.00 | 0.00 | 0.00 | 0.00KB | 0.00 | 0.00 | 5836468 | 0 | … | |
| Total | 0 | 0.00 | 0.00 | 0.00 | 0.00KB | 0.00 | 0.00 | 5836468 | 0 | |||
 |
| Outgoing Feed (+ Top1000 #) | Volume | %Vol | Kbps | Accepted | %Acc | %Tot | KB/art | Dups | Rejs | % Ratio (Out/In) | ||
|---|---|---|---|---|---|---|---|---|---|---|---|---|
| 1 | 217.73.144.40 | 0.00KB | 0.00 | 0.00 | 0 | 0.00 | 0.00 | 0.00 | 5836468 | 0 | … | |
| Total | 0.00KB | 0.00 | 0.00 | 0 | 0.00 | 0.00 | 0.00 | 5836468 | 0 | |||
 |
| Outgoing Feed (+ Top1000 #) | Rej. Vol. | %Vol | Kbps | Accepted | %Acc | %Tot | KB/art | Dups | Rejs | % Ratio (Out/In) | ||
|---|---|---|---|---|---|---|---|---|---|---|---|---|
| 1 | 217.73.144.40 | 0.00KB | 0.00 | 0.00 | 0 | 0.00 | 0.00 | 0.00 | 5836468 | 0 | … | |
| Total | 0.00KB | 0.00 | 0.00 | 0 | 0.00 | 0.00 | 0.00 | 5836468 | 0 | |||
 |
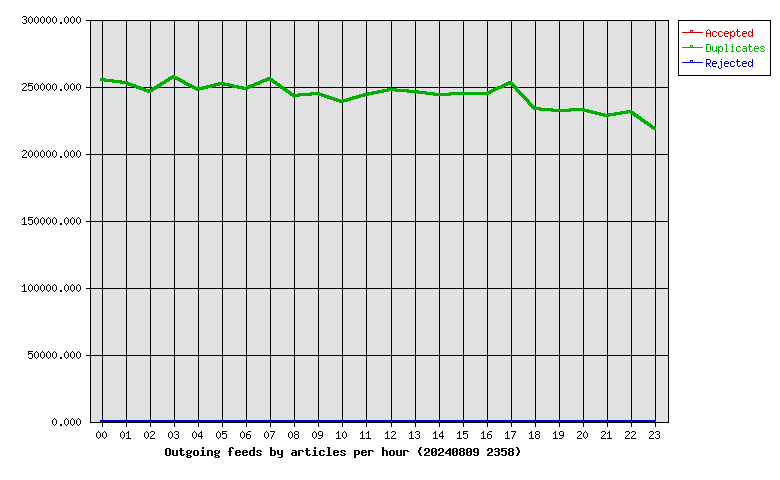
| Hour | Accepted | %Acc | Volume | %Vol | dups | Rejs |
|---|---|---|---|---|---|---|
| 00 | 0 | 0.00 | 0.00KB | 0.00 | 254692 | 0 |
| 01 | 0 | 0.00 | 0.00KB | 0.00 | 252847 | 0 |
| 02 | 0 | 0.00 | 0.00KB | 0.00 | 246191 | 0 |
| 03 | 0 | 0.00 | 0.00KB | 0.00 | 256914 | 0 |
| 04 | 0 | 0.00 | 0.00KB | 0.00 | 247368 | 0 |
| 05 | 0 | 0.00 | 0.00KB | 0.00 | 252184 | 0 |
| 06 | 0 | 0.00 | 0.00KB | 0.00 | 248281 | 0 |
| 07 | 0 | 0.00 | 0.00KB | 0.00 | 255568 | 0 |
| 08 | 0 | 0.00 | 0.00KB | 0.00 | 243025 | 0 |
| 09 | 0 | 0.00 | 0.00KB | 0.00 | 244412 | 0 |
| 10 | 0 | 0.00 | 0.00KB | 0.00 | 238314 | 0 |
| 11 | 0 | 0.00 | 0.00KB | 0.00 | 243601 | 0 |
| 12 | 0 | 0.00 | 0.00KB | 0.00 | 247407 | 0 |
| 13 | 0 | 0.00 | 0.00KB | 0.00 | 246150 | 0 |
| 14 | 0 | 0.00 | 0.00KB | 0.00 | 243851 | 0 |
| 15 | 0 | 0.00 | 0.00KB | 0.00 | 244201 | 0 |
| 16 | 0 | 0.00 | 0.00KB | 0.00 | 244126 | 0 |
| 17 | 0 | 0.00 | 0.00KB | 0.00 | 252904 | 0 |
| 18 | 0 | 0.00 | 0.00KB | 0.00 | 232921 | 0 |
| 19 | 0 | 0.00 | 0.00KB | 0.00 | 231705 | 0 |
| 20 | 0 | 0.00 | 0.00KB | 0.00 | 232720 | 0 |
| 21 | 0 | 0.00 | 0.00KB | 0.00 | 227985 | 0 |
| 22 | 0 | 0.00 | 0.00KB | 0.00 | 230621 | 0 |
| 23 | 0 | 0.00 | 0.00KB | 0.00 | 218480 | 0 |
| Total | 0 | 0.00 | 0.00KB | 0.00 | 5836468 | 0 |
 |
| >= 20% Full | >= 35% Full | >= 50% Full | >= 65% Full | >= 80% Full | >= 95% Full |
| Outgoing Feed | Batch Seq | Batch Num | Batch Max | %Full | Av. Pending |
|---|---|---|---|---|---|
| nbr.elbracht.net-o | 976543-976624 | 81 | 500 | 16 | 0.0 |
| text-spool-out | 0-0 | 0 | 500 | 0 | 0.0 |
| 1st Time | Last Time | # Msgs | Message |
|---|---|---|---|
| 07:46:57 | 16:45:36 | 6 | DNS Fwd/Rev mismatch: lookup of scanner-07.ch1.censys-scanner.com failed |