| |
DIABLO statistics for newsfeed.yoursite.com on Thu 08 Aug 2024 |
Generated on 20240808 2358 by feeder-stats v4.006. Copyright © 2002 The Diablo Project.
Diablo running processes:  81    Dnewslink running processes:  0


11:59PM  up 172 days,  7:18, 0 users, load averages: 1.46, 1.02, 0.86

Filesystem     Size    Used   Avail Capacity  Mounted on
/dev/da0s1g     94G    1.2G     85G     1%    /news
/dev/da1       7.3T    6.6T     78G    99%    /news2/spool/news/00
/dev/da2       7.3T    6.6T     78G    99%    /news2/spool/news/01
/dev/da3       3.7T    3.3T     68G    98%    /news2/spool/news/02
/dev/da4       5.5T      5T     91G    98%    /news2/spool/news/03
/dev/da8       7.3T    6.6T     82G    99%    /news2/spool/news/04
/dev/da9       7.3T    6.6T     78G    99%    /news2/spool/news/05
/dev/da10      7.3T    6.6T     80G    99%    /news2/spool/news/06
/dev/da11      5.5T      5T     73G    99%    /news2/spool/news/07
/dev/da12      5.5T    4.9T     98G    98%    /news2/spool/news/08
/dev/da13      7.3T    6.6T     78G    99%    /news2/spool/news/09
/dev/da14      7.3T    6.6T     77G    99%    /news2/spool/news/10
/dev/da15      7.3T    6.6T     77G    99%    /news2/spool/news/11
/dev/da16      7.3T    6.6T     80G    99%    /news2/spool/news/12
/dev/da17      7.3T    6.6T     77G    99%    /news2/spool/news/13
/dev/da18      7.3T    6.6T     80G    99%    /news2/spool/news/14
/dev/da19      7.3T    6.6T     77G    99%    /news2/spool/news/15
/dev/da20      7.3T    6.6T     76G    99%    /news2/spool/news/16
/dev/da21      7.3T    6.6T     74G    99%    /news2/spool/news/17
/dev/da22      7.3T    6.6T     77G    99%    /news2/spool/news/18
/dev/da23      7.3T    6.6T     78G    99%    /news2/spool/news/19
/dev/da24      7.3T    6.6T     80G    99%    /news2/spool/news/20
/dev/da25      7.3T    6.6T     78G    99%    /news2/spool/news/21
/dev/da26      7.3T    6.6T     79G    99%    /news2/spool/news/22
/dev/da5       221G     36G    167G    18%    /news1
/dev/md0        40G     14G     21G    40%    /news3
| Incoming Feed (+ Top1000 #) | Accepted | %Acc | %Tot | Art/sec | Volume | %Vol | KB/art | Check | Ihave | Spam | TooOld | Rejs | Errs | ||
|---|---|---|---|---|---|---|---|---|---|---|---|---|---|---|---|
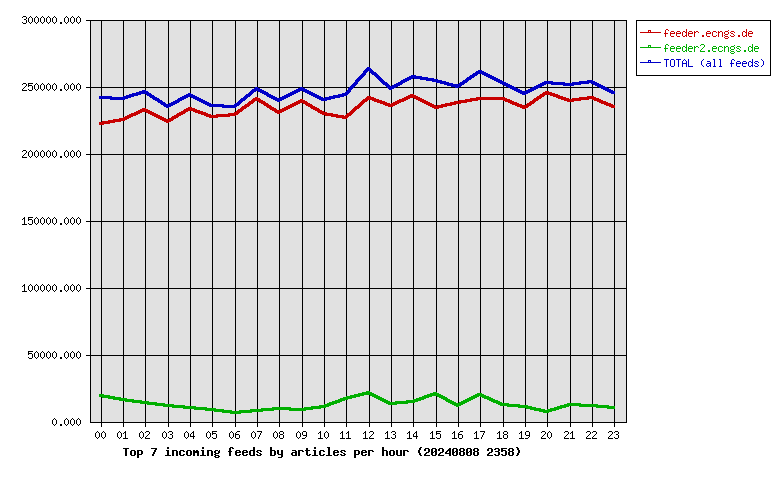
| 1 | feeder.ecngs.de | 5625228 | 94.61 | 94.90 | 65.11 | 3.49TB | 99.93 | 666.16 | 5945520 | 0 | 0 | 0 | 156 | 0 | |
| 2 | feeder2.ecngs.de | 302519 | 91.78 | 5.10 | 3.51 | 2.46GB | 0.07 | 8.53 | 329521 | 0 | 0 | 0 | 110 | 0 | |
| Total | 5927747 | 0.00 | 100.00 | 68.62 | 3.49TB | 100.00 | 632.60 | 6275041 | 0 | 0 | 0 | 266 | 0 | ||
 |
| Incoming Feed (+ Top1000 #) | Volume | %Vol | Kbps | Accepted | %Acc | %Tot | KB/art | Check | Ihave | Spam | TooOld | Rejs | Errs | ||
|---|---|---|---|---|---|---|---|---|---|---|---|---|---|---|---|
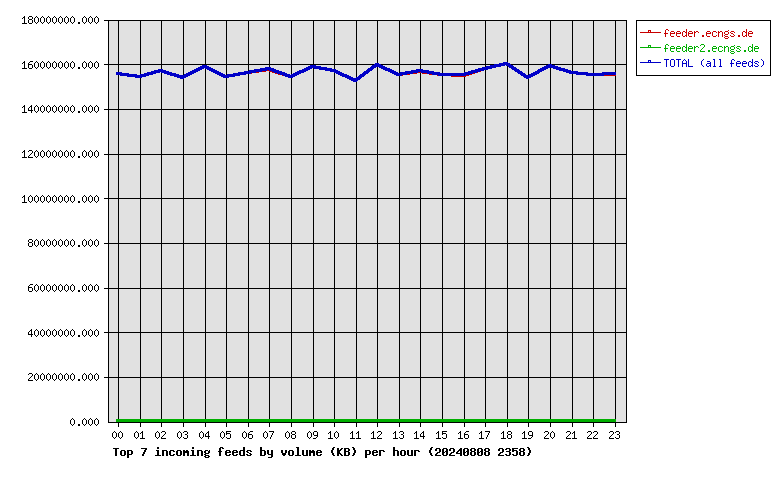
| 1 | feeder.ecngs.de | 3.49TB | 99.93 | 346971.78 | 5625228 | 94.61 | 94.90 | 666.16 | 5945520 | 0 | 0 | 0 | 156 | 0 | |
| 2 | feeder2.ecngs.de | 2.46GB | 0.07 | 239.89 | 302519 | 91.78 | 5.10 | 8.53 | 329521 | 0 | 0 | 0 | 110 | 0 | |
| Total | 3.49TB | 100.00 | 347211.66 | 5927747 | 0.00 | 100.00 | 632.60 | 6275041 | 0 | 0 | 0 | 266 | 0 | ||
 |
| Incoming Feed (+ Top1000 #) | Rej. Vol. | %Vol | Kbps | Accepted | %Acc | %Tot | KB/art | Check | Ihave | Spam | TooOld | Rejs | Errs | ||
|---|---|---|---|---|---|---|---|---|---|---|---|---|---|---|---|
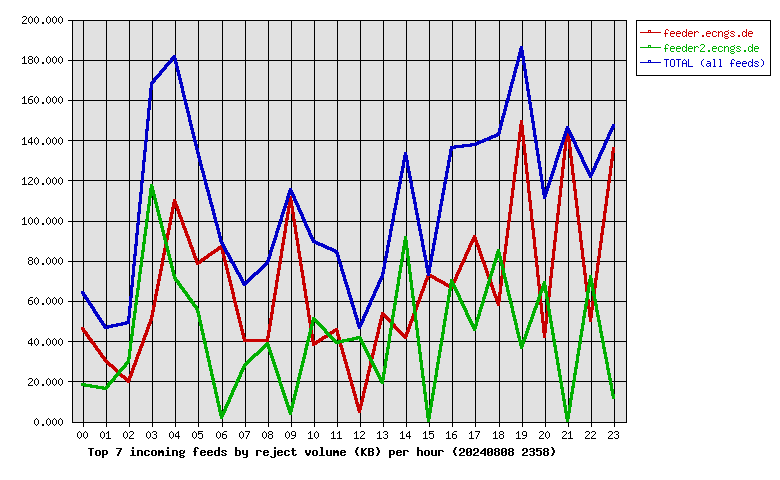
| 1 | feeder.ecngs.de | 1.57MB | 61.40 | 0.15 | 5625228 | 94.61 | 94.90 | 666.16 | 5945520 | 0 | 0 | 0 | 156 | 0 | |
| 2 | feeder2.ecngs.de | 1010.92KB | 38.60 | 0.09 | 302519 | 91.78 | 5.10 | 8.53 | 329521 | 0 | 0 | 0 | 110 | 0 | |
| Total | 2.56MB | 100.00 | 0.24 | 5927747 | 0.00 | 100.00 | 632.60 | 6275041 | 0 | 0 | 0 | 266 | 0 | ||
 |
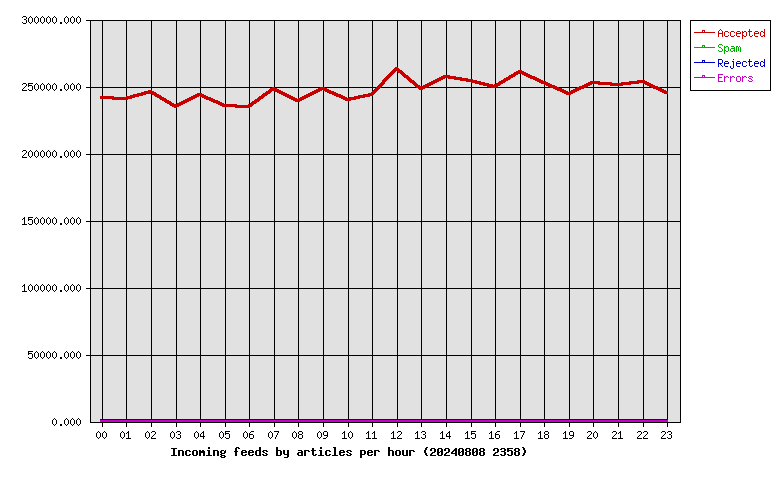
| Hour | Accepted | %Acc | Volume | %Vol | Check | Ihave | Spam | Rejs | Errs |
|---|---|---|---|---|---|---|---|---|---|
| 00 | 241327 | 4.07 | 148.60GB | 4.16 | 263517 | 0 | 0 | 9 | 0 |
| 01 | 240973 | 4.07 | 147.05GB | 4.11 | 259007 | 0 | 0 | 5 | 0 |
| 02 | 246241 | 4.15 | 149.67GB | 4.19 | 262131 | 0 | 0 | 4 | 0 |
| 03 | 234567 | 3.96 | 146.75GB | 4.10 | 246614 | 0 | 0 | 10 | 0 |
| 04 | 243640 | 4.11 | 151.38GB | 4.23 | 256009 | 0 | 0 | 12 | 0 |
| 05 | 235287 | 3.97 | 146.97GB | 4.11 | 248220 | 0 | 0 | 10 | 0 |
| 06 | 235041 | 3.97 | 148.95GB | 4.17 | 242540 | 0 | 0 | 7 | 0 |
| 07 | 248190 | 4.19 | 150.36GB | 4.20 | 257090 | 0 | 0 | 8 | 0 |
| 08 | 239507 | 4.04 | 147.08GB | 4.11 | 250249 | 0 | 0 | 11 | 0 |
| 09 | 247808 | 4.18 | 151.39GB | 4.23 | 256979 | 0 | 0 | 11 | 0 |
| 10 | 239826 | 4.05 | 149.72GB | 4.19 | 252000 | 0 | 0 | 13 | 0 |
| 11 | 243569 | 4.11 | 145.54GB | 4.07 | 262181 | 0 | 0 | 17 | 0 |
| 12 | 263159 | 4.44 | 152.40GB | 4.26 | 286832 | 0 | 0 | 8 | 0 |
| 13 | 248291 | 4.19 | 148.01GB | 4.14 | 262757 | 0 | 0 | 9 | 0 |
| 14 | 257144 | 4.34 | 149.52GB | 4.18 | 273475 | 0 | 0 | 17 | 0 |
| 15 | 254123 | 4.29 | 148.14GB | 4.14 | 274956 | 0 | 0 | 7 | 0 |
| 16 | 249651 | 4.21 | 147.80GB | 4.13 | 264971 | 0 | 0 | 14 | 0 |
| 17 | 260454 | 4.39 | 150.47GB | 4.21 | 283131 | 0 | 0 | 18 | 0 |
| 18 | 252738 | 4.26 | 152.66GB | 4.27 | 267696 | 0 | 0 | 15 | 0 |
| 19 | 244137 | 4.12 | 146.66GB | 4.10 | 256346 | 0 | 0 | 18 | 0 |
| 20 | 252379 | 4.26 | 151.84GB | 4.25 | 260443 | 0 | 0 | 10 | 0 |
| 21 | 251300 | 4.24 | 148.94GB | 4.16 | 265309 | 0 | 0 | 10 | 0 |
| 22 | 252986 | 4.27 | 148.00GB | 4.14 | 265777 | 0 | 0 | 10 | 0 |
| 23 | 245409 | 4.14 | 148.25GB | 4.15 | 256811 | 0 | 0 | 13 | 0 |
| Total | 5927747 | 100.00 | 3.49TB | 100.00 | 6275041 | 0 | 0 | 266 | 0 |
 |
| Outgoing Feed (+ Top1000 #) | Accepted | %Acc | %Tot | Art/sec | Volume | %Vol | KB/art | Dups | Rejs | % Ratio (Out/In) | ||
|---|---|---|---|---|---|---|---|---|---|---|---|---|
| 1 | 217.73.144.40 | 0 | 0.00 | 0.00 | 0.00 | 0.00KB | 0.00 | 0.00 | 5853305 | 0 | … | |
| Total | 0 | 0.00 | 0.00 | 0.00 | 0.00KB | 0.00 | 0.00 | 5853305 | 0 | |||
 |
| Outgoing Feed (+ Top1000 #) | Volume | %Vol | Kbps | Accepted | %Acc | %Tot | KB/art | Dups | Rejs | % Ratio (Out/In) | ||
|---|---|---|---|---|---|---|---|---|---|---|---|---|
| 1 | 217.73.144.40 | 0.00KB | 0.00 | 0.00 | 0 | 0.00 | 0.00 | 0.00 | 5853305 | 0 | … | |
| Total | 0.00KB | 0.00 | 0.00 | 0 | 0.00 | 0.00 | 0.00 | 5853305 | 0 | |||
 |
| Outgoing Feed (+ Top1000 #) | Rej. Vol. | %Vol | Kbps | Accepted | %Acc | %Tot | KB/art | Dups | Rejs | % Ratio (Out/In) | ||
|---|---|---|---|---|---|---|---|---|---|---|---|---|
| 1 | 217.73.144.40 | 0.00KB | 0.00 | 0.00 | 0 | 0.00 | 0.00 | 0.00 | 5853305 | 0 | … | |
| Total | 0.00KB | 0.00 | 0.00 | 0 | 0.00 | 0.00 | 0.00 | 5853305 | 0 | |||
 |
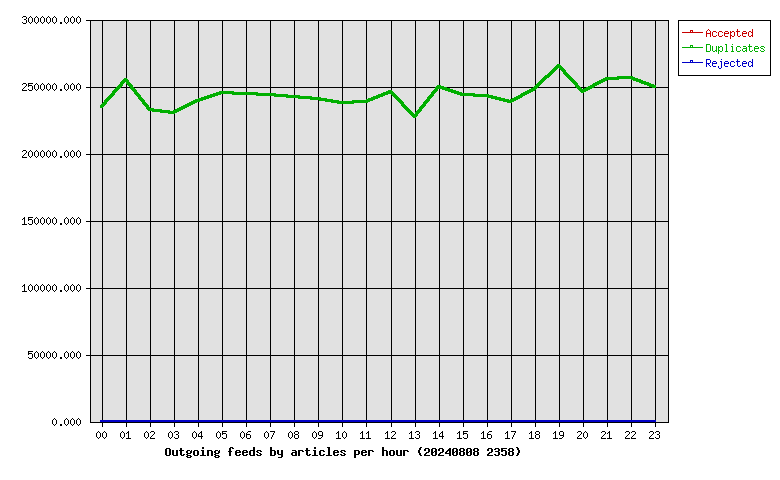
| Hour | Accepted | %Acc | Volume | %Vol | dups | Rejs |
|---|---|---|---|---|---|---|
| 00 | 0 | 0.00 | 0.00KB | 0.00 | 234398 | 0 |
| 01 | 0 | 0.00 | 0.00KB | 0.00 | 254809 | 0 |
| 02 | 0 | 0.00 | 0.00KB | 0.00 | 232725 | 0 |
| 03 | 0 | 0.00 | 0.00KB | 0.00 | 230184 | 0 |
| 04 | 0 | 0.00 | 0.00KB | 0.00 | 239462 | 0 |
| 05 | 0 | 0.00 | 0.00KB | 0.00 | 245183 | 0 |
| 06 | 0 | 0.00 | 0.00KB | 0.00 | 244197 | 0 |
| 07 | 0 | 0.00 | 0.00KB | 0.00 | 243785 | 0 |
| 08 | 0 | 0.00 | 0.00KB | 0.00 | 242182 | 0 |
| 09 | 0 | 0.00 | 0.00KB | 0.00 | 241031 | 0 |
| 10 | 0 | 0.00 | 0.00KB | 0.00 | 237959 | 0 |
| 11 | 0 | 0.00 | 0.00KB | 0.00 | 238449 | 0 |
| 12 | 0 | 0.00 | 0.00KB | 0.00 | 246146 | 0 |
| 13 | 0 | 0.00 | 0.00KB | 0.00 | 227544 | 0 |
| 14 | 0 | 0.00 | 0.00KB | 0.00 | 249266 | 0 |
| 15 | 0 | 0.00 | 0.00KB | 0.00 | 243698 | 0 |
| 16 | 0 | 0.00 | 0.00KB | 0.00 | 243231 | 0 |
| 17 | 0 | 0.00 | 0.00KB | 0.00 | 238625 | 0 |
| 18 | 0 | 0.00 | 0.00KB | 0.00 | 247982 | 0 |
| 19 | 0 | 0.00 | 0.00KB | 0.00 | 265128 | 0 |
| 20 | 0 | 0.00 | 0.00KB | 0.00 | 245731 | 0 |
| 21 | 0 | 0.00 | 0.00KB | 0.00 | 255469 | 0 |
| 22 | 0 | 0.00 | 0.00KB | 0.00 | 256293 | 0 |
| 23 | 0 | 0.00 | 0.00KB | 0.00 | 249828 | 0 |
| Total | 0 | 0.00 | 0.00KB | 0.00 | 5853305 | 0 |
 |
| >= 20% Full | >= 35% Full | >= 50% Full | >= 65% Full | >= 80% Full | >= 95% Full |
| Outgoing Feed | Batch Seq | Batch Num | Batch Max | %Full | Av. Pending |
|---|---|---|---|---|---|
| nbr.elbracht.net-o | 976255-976336 | 81 | 500 | 16 | 0.0 |
| text-spool-out | 0-0 | 0 | 500 | 0 | 0.0 |
| 1st Time | Last Time | # Msgs | Message |
|---|---|---|---|
| 08:08:47 | 1 | DNS Fwd/Rev mismatch: internettl.org/104.152.52.133 | |
| 08:08:17 | 1 | DNS Fwd/Rev mismatch: internettl.org/104.152.52.132 |