| |
DIABLO statistics for newsfeed.yoursite.com on Wed 07 Aug 2024 |
Generated on 20240807 2358 by feeder-stats v4.006. Copyright © 2002 The Diablo Project.
Diablo running processes:  81    Dnewslink running processes:  0


11:59PM  up 171 days,  7:18, 0 users, load averages: 1.49, 0.96, 0.83

Filesystem     Size    Used   Avail Capacity  Mounted on
/dev/da0s1g     94G    1.2G     85G     1%    /news
/dev/da1       7.3T    6.6T     69G    99%    /news2/spool/news/00
/dev/da2       7.3T    6.6T     70G    99%    /news2/spool/news/01
/dev/da3       3.7T    3.3T     63G    98%    /news2/spool/news/02
/dev/da4       5.5T      5T     85G    98%    /news2/spool/news/03
/dev/da8       7.3T    6.6T     73G    99%    /news2/spool/news/04
/dev/da9       7.3T    6.6T     69G    99%    /news2/spool/news/05
/dev/da10      7.3T    6.6T     71G    99%    /news2/spool/news/06
/dev/da11      5.5T    4.9T    121G    98%    /news2/spool/news/07
/dev/da12      5.5T      5T     92G    98%    /news2/spool/news/08
/dev/da13      7.3T    6.6T     69G    99%    /news2/spool/news/09
/dev/da14      7.3T    6.6T     68G    99%    /news2/spool/news/10
/dev/da15      7.3T    6.6T     68G    99%    /news2/spool/news/11
/dev/da16      7.3T    6.6T     71G    99%    /news2/spool/news/12
/dev/da17      7.3T    6.6T     68G    99%    /news2/spool/news/13
/dev/da18      7.3T    6.6T     71G    99%    /news2/spool/news/14
/dev/da19      7.3T    6.6T     68G    99%    /news2/spool/news/15
/dev/da20      7.3T    6.6T     69G    99%    /news2/spool/news/16
/dev/da21      7.3T    6.6T     66G    99%    /news2/spool/news/17
/dev/da22      7.3T    6.6T     69G    99%    /news2/spool/news/18
/dev/da23      7.3T    6.6T     70G    99%    /news2/spool/news/19
/dev/da24      7.3T    6.6T     71G    99%    /news2/spool/news/20
/dev/da25      7.3T    6.6T     69G    99%    /news2/spool/news/21
/dev/da26      7.3T    6.6T     71G    99%    /news2/spool/news/22
/dev/da5       221G     36G    167G    18%    /news1
/dev/md0        40G     14G     21G    39%    /news3
| Incoming Feed (+ Top1000 #) | Accepted | %Acc | %Tot | Art/sec | Volume | %Vol | KB/art | Check | Ihave | Spam | TooOld | Rejs | Errs | ||
|---|---|---|---|---|---|---|---|---|---|---|---|---|---|---|---|
| 1 | feeder.ecngs.de | 5605422 | 94.25 | 94.67 | 64.88 | 3.47TB | 99.92 | 665.15 | 5947492 | 0 | 0 | 0 | 162 | 0 | |
| 2 | feeder2.ecngs.de | 315435 | 91.41 | 5.33 | 3.65 | 2.85GB | 0.08 | 9.47 | 344892 | 0 | 0 | 0 | 195 | 0 | |
| Total | 5920857 | 0.00 | 100.00 | 68.53 | 3.48TB | 100.00 | 630.22 | 6292384 | 0 | 0 | 0 | 357 | 0 | ||
 |
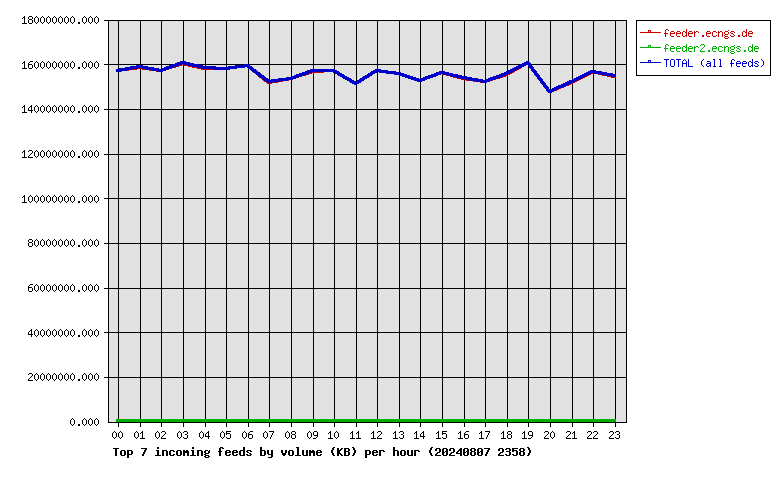
| Incoming Feed (+ Top1000 #) | Volume | %Vol | Kbps | Accepted | %Acc | %Tot | KB/art | Check | Ihave | Spam | TooOld | Rejs | Errs | ||
|---|---|---|---|---|---|---|---|---|---|---|---|---|---|---|---|
| 1 | feeder.ecngs.de | 3.47TB | 99.92 | 345227.52 | 5605422 | 94.25 | 94.67 | 665.15 | 5947492 | 0 | 0 | 0 | 162 | 0 | |
| 2 | feeder2.ecngs.de | 2.85GB | 0.08 | 276.69 | 315435 | 91.41 | 5.33 | 9.47 | 344892 | 0 | 0 | 0 | 195 | 0 | |
| Total | 3.48TB | 100.00 | 345504.21 | 5920857 | 0.00 | 100.00 | 630.22 | 6292384 | 0 | 0 | 0 | 357 | 0 | ||
 |
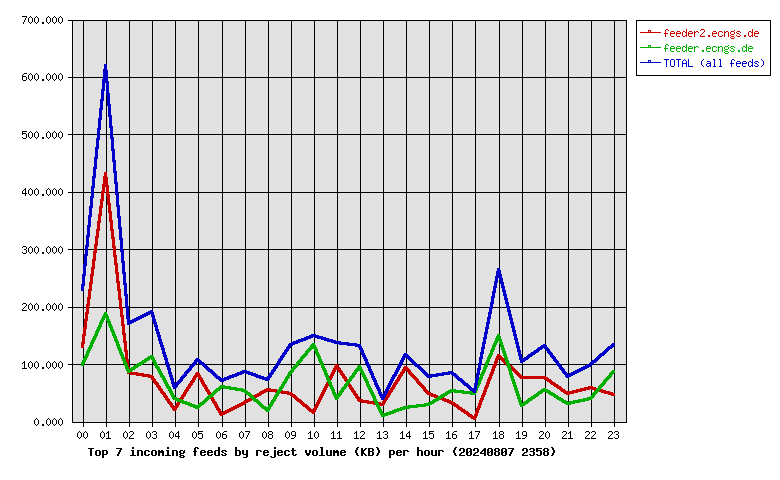
| Incoming Feed (+ Top1000 #) | Rej. Vol. | %Vol | Kbps | Accepted | %Acc | %Tot | KB/art | Check | Ihave | Spam | TooOld | Rejs | Errs | ||
|---|---|---|---|---|---|---|---|---|---|---|---|---|---|---|---|
| 1 | feeder2.ecngs.de | 1.70MB | 52.47 | 0.16 | 315435 | 91.41 | 5.33 | 9.47 | 344892 | 0 | 0 | 0 | 195 | 0 | |
| 2 | feeder.ecngs.de | 1.54MB | 47.53 | 0.15 | 5605422 | 94.25 | 94.67 | 665.15 | 5947492 | 0 | 0 | 0 | 162 | 0 | |
| Total | 3.25MB | 100.00 | 0.31 | 5920857 | 0.00 | 100.00 | 630.22 | 6292384 | 0 | 0 | 0 | 357 | 0 | ||
 |
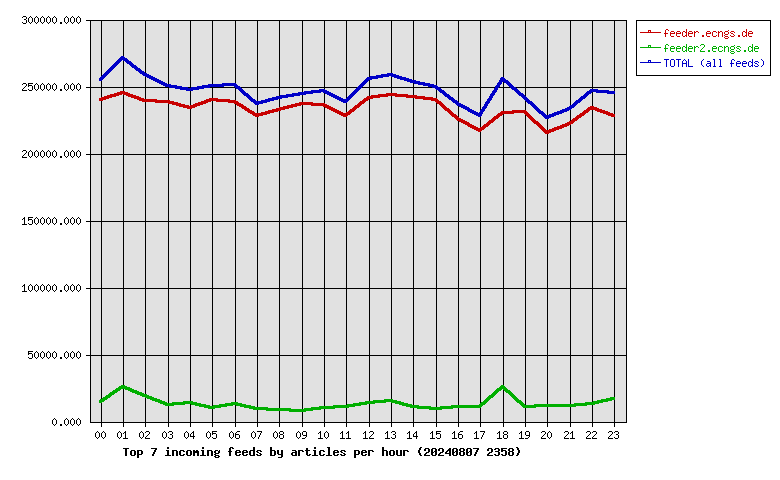
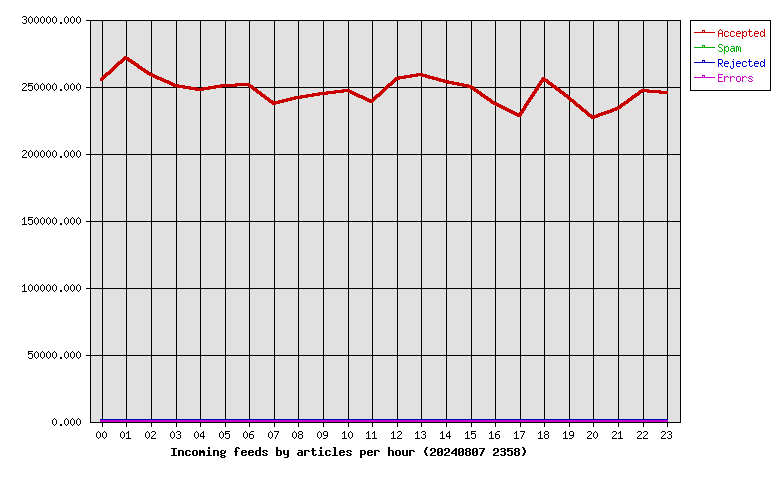
| Hour | Accepted | %Acc | Volume | %Vol | Check | Ihave | Spam | Rejs | Errs |
|---|---|---|---|---|---|---|---|---|---|
| 00 | 254959 | 4.31 | 149.73GB | 4.21 | 271646 | 0 | 0 | 19 | 0 |
| 01 | 271038 | 4.58 | 151.19GB | 4.25 | 302353 | 0 | 0 | 63 | 0 |
| 02 | 258246 | 4.36 | 149.68GB | 4.21 | 280342 | 0 | 0 | 20 | 0 |
| 03 | 250141 | 4.22 | 152.95GB | 4.30 | 263211 | 0 | 0 | 12 | 0 |
| 04 | 247426 | 4.18 | 150.84GB | 4.24 | 263522 | 0 | 0 | 8 | 0 |
| 05 | 250023 | 4.22 | 150.60GB | 4.23 | 270682 | 0 | 0 | 9 | 0 |
| 06 | 251434 | 4.25 | 151.93GB | 4.27 | 265771 | 0 | 0 | 9 | 0 |
| 07 | 237204 | 4.01 | 144.82GB | 4.07 | 248115 | 0 | 0 | 12 | 0 |
| 08 | 241053 | 4.07 | 146.32GB | 4.11 | 251231 | 0 | 0 | 6 | 0 |
| 09 | 244587 | 4.13 | 149.46GB | 4.20 | 254030 | 0 | 0 | 13 | 0 |
| 10 | 246369 | 4.16 | 149.75GB | 4.21 | 258294 | 0 | 0 | 10 | 0 |
| 11 | 238711 | 4.03 | 144.18GB | 4.05 | 251044 | 0 | 0 | 15 | 0 |
| 12 | 255299 | 4.31 | 149.58GB | 4.20 | 270844 | 0 | 0 | 13 | 0 |
| 13 | 258746 | 4.37 | 148.35GB | 4.17 | 275255 | 0 | 0 | 9 | 0 |
| 14 | 253235 | 4.28 | 145.50GB | 4.09 | 266312 | 0 | 0 | 18 | 0 |
| 15 | 249254 | 4.21 | 148.77GB | 4.18 | 258981 | 0 | 0 | 14 | 0 |
| 16 | 236615 | 4.00 | 146.49GB | 4.12 | 249404 | 0 | 0 | 8 | 0 |
| 17 | 227697 | 3.85 | 144.95GB | 4.07 | 240346 | 0 | 0 | 8 | 0 |
| 18 | 255695 | 4.32 | 148.31GB | 4.17 | 285742 | 0 | 0 | 34 | 0 |
| 19 | 241263 | 4.07 | 152.98GB | 4.30 | 253289 | 0 | 0 | 16 | 0 |
| 20 | 226814 | 3.83 | 140.74GB | 3.95 | 240229 | 0 | 0 | 14 | 0 |
| 21 | 233413 | 3.94 | 144.84GB | 4.07 | 246317 | 0 | 0 | 7 | 0 |
| 22 | 246646 | 4.17 | 149.17GB | 4.19 | 261412 | 0 | 0 | 10 | 0 |
| 23 | 244989 | 4.14 | 147.46GB | 4.14 | 264012 | 0 | 0 | 10 | 0 |
| Total | 5920857 | 100.00 | 3.48TB | 100.00 | 6292384 | 0 | 0 | 357 | 0 |
 |
| Outgoing Feed (+ Top1000 #) | Accepted | %Acc | %Tot | Art/sec | Volume | %Vol | KB/art | Dups | Rejs | % Ratio (Out/In) | ||
|---|---|---|---|---|---|---|---|---|---|---|---|---|
| 1 | 217.73.144.40 | 0 | 0.00 | 0.00 | 0.00 | 0.00KB | 0.00 | 0.00 | 6041096 | 0 | … | |
| Total | 0 | 0.00 | 0.00 | 0.00 | 0.00KB | 0.00 | 0.00 | 6041096 | 0 | |||
 |
| Outgoing Feed (+ Top1000 #) | Volume | %Vol | Kbps | Accepted | %Acc | %Tot | KB/art | Dups | Rejs | % Ratio (Out/In) | ||
|---|---|---|---|---|---|---|---|---|---|---|---|---|
| 1 | 217.73.144.40 | 0.00KB | 0.00 | 0.00 | 0 | 0.00 | 0.00 | 0.00 | 6041096 | 0 | … | |
| Total | 0.00KB | 0.00 | 0.00 | 0 | 0.00 | 0.00 | 0.00 | 6041096 | 0 | |||
 |
| Outgoing Feed (+ Top1000 #) | Rej. Vol. | %Vol | Kbps | Accepted | %Acc | %Tot | KB/art | Dups | Rejs | % Ratio (Out/In) | ||
|---|---|---|---|---|---|---|---|---|---|---|---|---|
| 1 | 217.73.144.40 | 0.00KB | 0.00 | 0.00 | 0 | 0.00 | 0.00 | 0.00 | 6041096 | 0 | … | |
| Total | 0.00KB | 0.00 | 0.00 | 0 | 0.00 | 0.00 | 0.00 | 6041096 | 0 | |||
 |
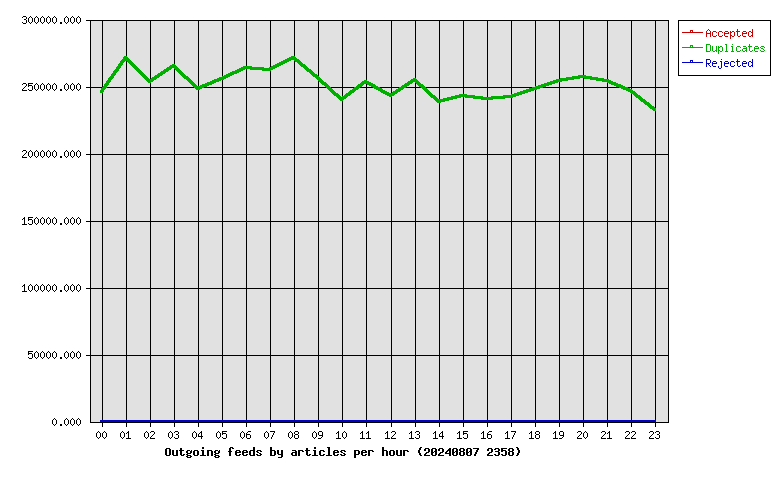
| Hour | Accepted | %Acc | Volume | %Vol | dups | Rejs |
|---|---|---|---|---|---|---|
| 00 | 0 | 0.00 | 0.00KB | 0.00 | 245666 | 0 |
| 01 | 0 | 0.00 | 0.00KB | 0.00 | 271379 | 0 |
| 02 | 0 | 0.00 | 0.00KB | 0.00 | 253028 | 0 |
| 03 | 0 | 0.00 | 0.00KB | 0.00 | 265336 | 0 |
| 04 | 0 | 0.00 | 0.00KB | 0.00 | 248378 | 0 |
| 05 | 0 | 0.00 | 0.00KB | 0.00 | 255627 | 0 |
| 06 | 0 | 0.00 | 0.00KB | 0.00 | 263985 | 0 |
| 07 | 0 | 0.00 | 0.00KB | 0.00 | 262283 | 0 |
| 08 | 0 | 0.00 | 0.00KB | 0.00 | 271410 | 0 |
| 09 | 0 | 0.00 | 0.00KB | 0.00 | 256637 | 0 |
| 10 | 0 | 0.00 | 0.00KB | 0.00 | 240228 | 0 |
| 11 | 0 | 0.00 | 0.00KB | 0.00 | 253132 | 0 |
| 12 | 0 | 0.00 | 0.00KB | 0.00 | 242547 | 0 |
| 13 | 0 | 0.00 | 0.00KB | 0.00 | 255223 | 0 |
| 14 | 0 | 0.00 | 0.00KB | 0.00 | 238539 | 0 |
| 15 | 0 | 0.00 | 0.00KB | 0.00 | 243214 | 0 |
| 16 | 0 | 0.00 | 0.00KB | 0.00 | 240324 | 0 |
| 17 | 0 | 0.00 | 0.00KB | 0.00 | 242497 | 0 |
| 18 | 0 | 0.00 | 0.00KB | 0.00 | 248359 | 0 |
| 19 | 0 | 0.00 | 0.00KB | 0.00 | 253781 | 0 |
| 20 | 0 | 0.00 | 0.00KB | 0.00 | 256798 | 0 |
| 21 | 0 | 0.00 | 0.00KB | 0.00 | 254210 | 0 |
| 22 | 0 | 0.00 | 0.00KB | 0.00 | 246404 | 0 |
| 23 | 0 | 0.00 | 0.00KB | 0.00 | 232111 | 0 |
| Total | 0 | 0.00 | 0.00KB | 0.00 | 6041096 | 0 |
 |
| >= 20% Full | >= 35% Full | >= 50% Full | >= 65% Full | >= 80% Full | >= 95% Full |
| Outgoing Feed | Batch Seq | Batch Num | Batch Max | %Full | Av. Pending |
|---|---|---|---|---|---|
| nbr.elbracht.net-o | 975967-976048 | 81 | 500 | 16 | 0.0 |
| text-spool-out | 0-0 | 0 | 500 | 0 | 0.0 |
| 1st Time | Last Time | # Msgs | Message |
|---|