| |
DIABLO statistics for newsfeed.yoursite.com on Tue 06 Aug 2024 |
Generated on 20240806 2358 by feeder-stats v4.006. Copyright © 2002 The Diablo Project.
Diablo running processes:  81    Dnewslink running processes:  0


11:59PM  up 170 days,  7:18, 0 users, load averages: 1.50, 0.85, 0.75

Filesystem     Size    Used   Avail Capacity  Mounted on
/dev/da0s1g     94G    1.2G     85G     1%    /news
/dev/da1       7.3T    6.6T     64G    99%    /news2/spool/news/00
/dev/da2       7.3T    6.6T     64G    99%    /news2/spool/news/01
/dev/da3       3.7T    3.3T     61G    98%    /news2/spool/news/02
/dev/da4       5.5T      5T     77G    98%    /news2/spool/news/03
/dev/da8       7.3T    6.6T     67G    99%    /news2/spool/news/04
/dev/da9       7.3T    6.6T     64G    99%    /news2/spool/news/05
/dev/da10      7.3T    6.6T     66G    99%    /news2/spool/news/06
/dev/da11      5.5T    4.9T    106G    98%    /news2/spool/news/07
/dev/da12      5.5T      5T     88G    98%    /news2/spool/news/08
/dev/da13      7.3T    6.6T     64G    99%    /news2/spool/news/09
/dev/da14      7.3T    6.6T     63G    99%    /news2/spool/news/10
/dev/da15      7.3T    6.6T     62G    99%    /news2/spool/news/11
/dev/da16      7.3T    6.6T     65G    99%    /news2/spool/news/12
/dev/da17      7.3T    6.6T     63G    99%    /news2/spool/news/13
/dev/da18      7.3T    6.6T     65G    99%    /news2/spool/news/14
/dev/da19      7.3T    6.6T     63G    99%    /news2/spool/news/15
/dev/da20      7.3T    6.6T     63G    99%    /news2/spool/news/16
/dev/da21      7.3T    6.6T    117G    98%    /news2/spool/news/17
/dev/da22      7.3T    6.6T     63G    99%    /news2/spool/news/18
/dev/da23      7.3T    6.6T     65G    99%    /news2/spool/news/19
/dev/da24      7.3T    6.6T     66G    99%    /news2/spool/news/20
/dev/da25      7.3T    6.6T     63G    99%    /news2/spool/news/21
/dev/da26      7.3T    6.6T     66G    99%    /news2/spool/news/22
/dev/da5       221G     36G    167G    18%    /news1
/dev/md0        40G     14G     21G    39%    /news3
| Incoming Feed (+ Top1000 #) | Accepted | %Acc | %Tot | Art/sec | Volume | %Vol | KB/art | Check | Ihave | Spam | TooOld | Rejs | Errs | ||
|---|---|---|---|---|---|---|---|---|---|---|---|---|---|---|---|
| 1 | feeder.ecngs.de | 5640114 | 94.63 | 95.02 | 65.28 | 3.49TB | 99.93 | 663.64 | 5959775 | 0 | 0 | 0 | 212 | 0 | |
| 2 | feeder2.ecngs.de | 295596 | 90.80 | 4.98 | 3.42 | 2.52GB | 0.07 | 8.96 | 325420 | 0 | 0 | 0 | 128 | 0 | |
| Total | 5935710 | 0.00 | 100.00 | 68.70 | 3.49TB | 100.00 | 631.03 | 6285195 | 0 | 0 | 0 | 340 | 0 | ||
 |
| Incoming Feed (+ Top1000 #) | Volume | %Vol | Kbps | Accepted | %Acc | %Tot | KB/art | Check | Ihave | Spam | TooOld | Rejs | Errs | ||
|---|---|---|---|---|---|---|---|---|---|---|---|---|---|---|---|
| 1 | feeder.ecngs.de | 3.49TB | 99.93 | 346573.01 | 5640114 | 94.63 | 95.02 | 663.64 | 5959775 | 0 | 0 | 0 | 212 | 0 | |
| 2 | feeder2.ecngs.de | 2.52GB | 0.07 | 245.41 | 295596 | 90.80 | 4.98 | 8.96 | 325420 | 0 | 0 | 0 | 128 | 0 | |
| Total | 3.49TB | 100.00 | 346818.42 | 5935710 | 0.00 | 100.00 | 631.03 | 6285195 | 0 | 0 | 0 | 340 | 0 | ||
 |
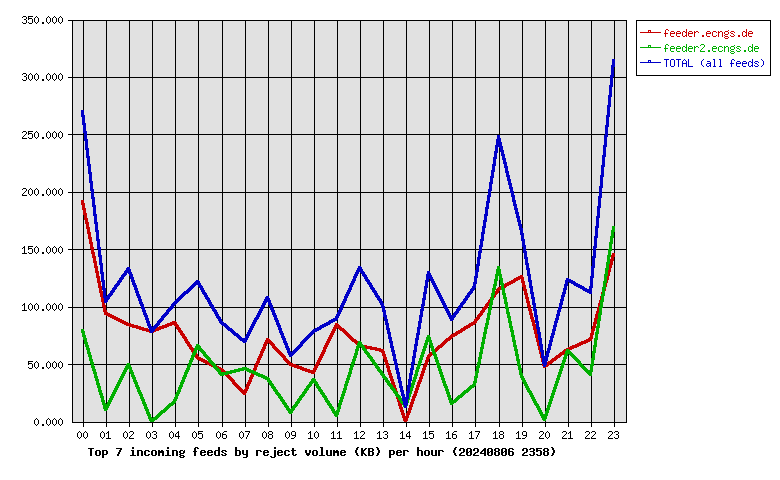
| Incoming Feed (+ Top1000 #) | Rej. Vol. | %Vol | Kbps | Accepted | %Acc | %Tot | KB/art | Check | Ihave | Spam | TooOld | Rejs | Errs | ||
|---|---|---|---|---|---|---|---|---|---|---|---|---|---|---|---|
| 1 | feeder.ecngs.de | 1.77MB | 62.73 | 0.17 | 5640114 | 94.63 | 95.02 | 663.64 | 5959775 | 0 | 0 | 0 | 212 | 0 | |
| 2 | feeder2.ecngs.de | 1.05MB | 37.27 | 0.10 | 295596 | 90.80 | 4.98 | 8.96 | 325420 | 0 | 0 | 0 | 128 | 0 | |
| Total | 2.82MB | 100.00 | 0.27 | 5935710 | 0.00 | 100.00 | 631.03 | 6285195 | 0 | 0 | 0 | 340 | 0 | ||
 |
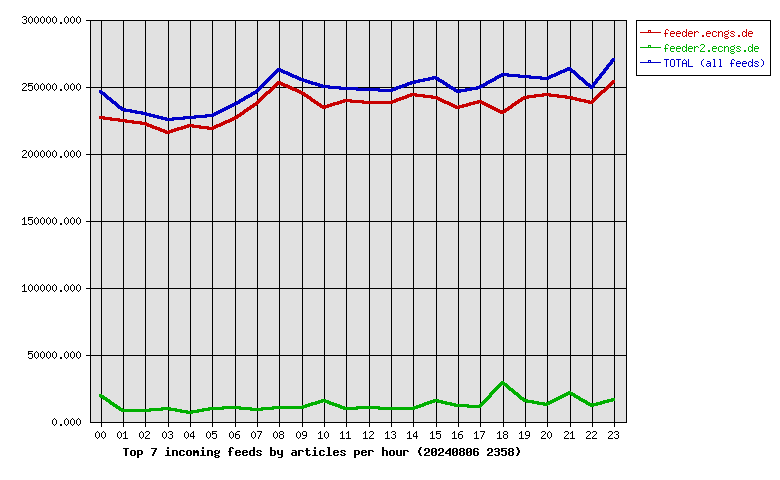
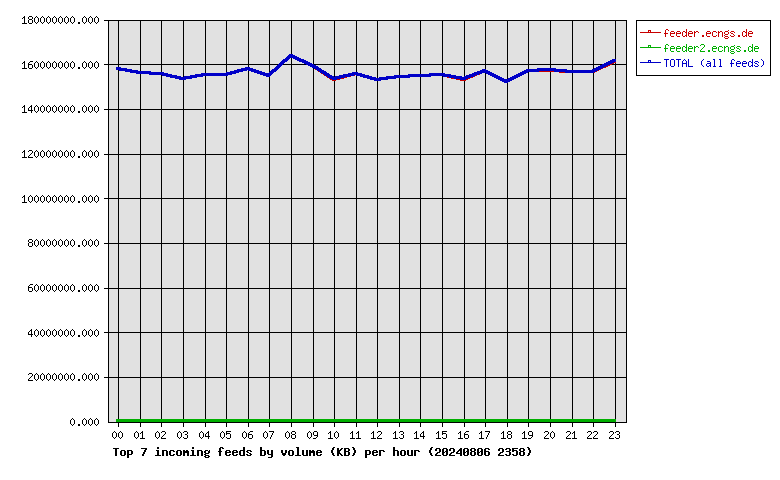
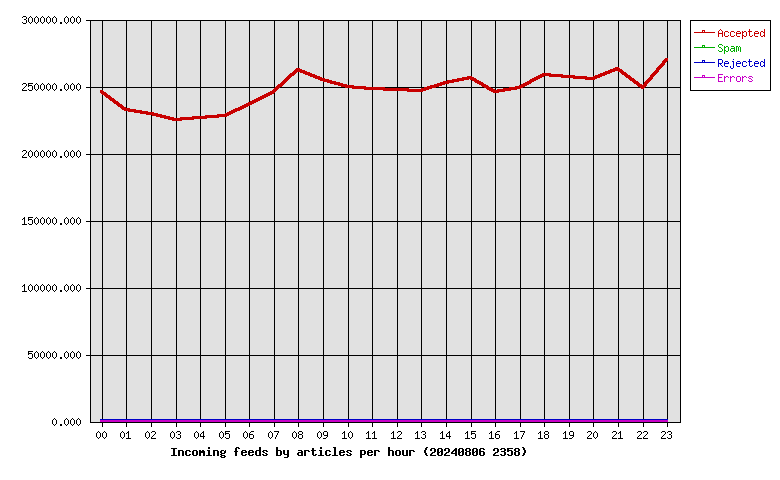
| Hour | Accepted | %Acc | Volume | %Vol | Check | Ihave | Spam | Rejs | Errs |
|---|---|---|---|---|---|---|---|---|---|
| 00 | 245708 | 4.14 | 150.51GB | 4.21 | 268001 | 0 | 0 | 39 | 0 |
| 01 | 232283 | 3.91 | 148.71GB | 4.16 | 241487 | 0 | 0 | 10 | 0 |
| 02 | 229395 | 3.86 | 148.52GB | 4.16 | 238243 | 0 | 0 | 14 | 0 |
| 03 | 225063 | 3.79 | 146.43GB | 4.10 | 235666 | 0 | 0 | 4 | 0 |
| 04 | 226683 | 3.82 | 147.81GB | 4.14 | 233953 | 0 | 0 | 12 | 0 |
| 05 | 228048 | 3.84 | 148.03GB | 4.14 | 245758 | 0 | 0 | 15 | 0 |
| 06 | 236305 | 3.98 | 150.46GB | 4.21 | 248443 | 0 | 0 | 12 | 0 |
| 07 | 245806 | 4.14 | 147.56GB | 4.13 | 256178 | 0 | 0 | 10 | 0 |
| 08 | 262409 | 4.42 | 156.18GB | 4.37 | 273784 | 0 | 0 | 11 | 0 |
| 09 | 255070 | 4.30 | 151.88GB | 4.25 | 266539 | 0 | 0 | 6 | 0 |
| 10 | 249505 | 4.20 | 146.08GB | 4.09 | 267753 | 0 | 0 | 7 | 0 |
| 11 | 248427 | 4.19 | 148.31GB | 4.15 | 259477 | 0 | 0 | 12 | 0 |
| 12 | 247662 | 4.17 | 145.96GB | 4.09 | 259522 | 0 | 0 | 18 | 0 |
| 13 | 246796 | 4.16 | 147.28GB | 4.12 | 257469 | 0 | 0 | 16 | 0 |
| 14 | 252821 | 4.26 | 147.60GB | 4.13 | 263368 | 0 | 0 | 1 | 0 |
| 15 | 256652 | 4.32 | 147.99GB | 4.14 | 273365 | 0 | 0 | 10 | 0 |
| 16 | 245645 | 4.14 | 146.12GB | 4.09 | 260280 | 0 | 0 | 16 | 0 |
| 17 | 249036 | 4.20 | 149.61GB | 4.19 | 261450 | 0 | 0 | 6 | 0 |
| 18 | 258568 | 4.36 | 145.07GB | 4.06 | 290758 | 0 | 0 | 35 | 0 |
| 19 | 256901 | 4.33 | 149.70GB | 4.19 | 276124 | 0 | 0 | 25 | 0 |
| 20 | 255306 | 4.30 | 149.92GB | 4.20 | 268863 | 0 | 0 | 9 | 0 |
| 21 | 262777 | 4.43 | 149.20GB | 4.18 | 287388 | 0 | 0 | 15 | 0 |
| 22 | 249106 | 4.20 | 149.44GB | 4.18 | 262194 | 0 | 0 | 11 | 0 |
| 23 | 269738 | 4.54 | 153.76GB | 4.30 | 289132 | 0 | 0 | 26 | 0 |
| Total | 5935710 | 100.00 | 3.49TB | 100.00 | 6285195 | 0 | 0 | 340 | 0 |
 |
| Outgoing Feed (+ Top1000 #) | Accepted | %Acc | %Tot | Art/sec | Volume | %Vol | KB/art | Dups | Rejs | % Ratio (Out/In) | ||
|---|---|---|---|---|---|---|---|---|---|---|---|---|
| 1 | 217.73.144.40 | 0 | 0.00 | 0.00 | 0.00 | 0.00KB | 0.00 | 0.00 | 5855498 | 0 | … | |
| Total | 0 | 0.00 | 0.00 | 0.00 | 0.00KB | 0.00 | 0.00 | 5855498 | 0 | |||
 |
| Outgoing Feed (+ Top1000 #) | Volume | %Vol | Kbps | Accepted | %Acc | %Tot | KB/art | Dups | Rejs | % Ratio (Out/In) | ||
|---|---|---|---|---|---|---|---|---|---|---|---|---|
| 1 | 217.73.144.40 | 0.00KB | 0.00 | 0.00 | 0 | 0.00 | 0.00 | 0.00 | 5855498 | 0 | … | |
| Total | 0.00KB | 0.00 | 0.00 | 0 | 0.00 | 0.00 | 0.00 | 5855498 | 0 | |||
 |
| Outgoing Feed (+ Top1000 #) | Rej. Vol. | %Vol | Kbps | Accepted | %Acc | %Tot | KB/art | Dups | Rejs | % Ratio (Out/In) | ||
|---|---|---|---|---|---|---|---|---|---|---|---|---|
| 1 | 217.73.144.40 | 0.00KB | 0.00 | 0.00 | 0 | 0.00 | 0.00 | 0.00 | 5855498 | 0 | … | |
| Total | 0.00KB | 0.00 | 0.00 | 0 | 0.00 | 0.00 | 0.00 | 5855498 | 0 | |||
 |
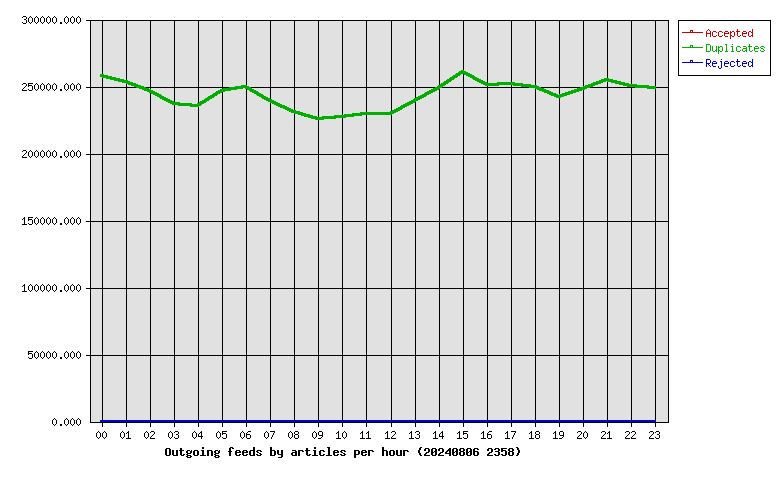
| Hour | Accepted | %Acc | Volume | %Vol | dups | Rejs |
|---|---|---|---|---|---|---|
| 00 | 0 | 0.00 | 0.00KB | 0.00 | 257759 | 0 |
| 01 | 0 | 0.00 | 0.00KB | 0.00 | 253685 | 0 |
| 02 | 0 | 0.00 | 0.00KB | 0.00 | 246481 | 0 |
| 03 | 0 | 0.00 | 0.00KB | 0.00 | 236650 | 0 |
| 04 | 0 | 0.00 | 0.00KB | 0.00 | 235729 | 0 |
| 05 | 0 | 0.00 | 0.00KB | 0.00 | 246601 | 0 |
| 06 | 0 | 0.00 | 0.00KB | 0.00 | 249973 | 0 |
| 07 | 0 | 0.00 | 0.00KB | 0.00 | 239540 | 0 |
| 08 | 0 | 0.00 | 0.00KB | 0.00 | 230686 | 0 |
| 09 | 0 | 0.00 | 0.00KB | 0.00 | 225427 | 0 |
| 10 | 0 | 0.00 | 0.00KB | 0.00 | 227102 | 0 |
| 11 | 0 | 0.00 | 0.00KB | 0.00 | 229716 | 0 |
| 12 | 0 | 0.00 | 0.00KB | 0.00 | 229813 | 0 |
| 13 | 0 | 0.00 | 0.00KB | 0.00 | 239367 | 0 |
| 14 | 0 | 0.00 | 0.00KB | 0.00 | 248748 | 0 |
| 15 | 0 | 0.00 | 0.00KB | 0.00 | 260580 | 0 |
| 16 | 0 | 0.00 | 0.00KB | 0.00 | 251490 | 0 |
| 17 | 0 | 0.00 | 0.00KB | 0.00 | 252031 | 0 |
| 18 | 0 | 0.00 | 0.00KB | 0.00 | 249255 | 0 |
| 19 | 0 | 0.00 | 0.00KB | 0.00 | 242313 | 0 |
| 20 | 0 | 0.00 | 0.00KB | 0.00 | 248090 | 0 |
| 21 | 0 | 0.00 | 0.00KB | 0.00 | 254683 | 0 |
| 22 | 0 | 0.00 | 0.00KB | 0.00 | 250608 | 0 |
| 23 | 0 | 0.00 | 0.00KB | 0.00 | 249171 | 0 |
| Total | 0 | 0.00 | 0.00KB | 0.00 | 5855498 | 0 |
 |
| >= 20% Full | >= 35% Full | >= 50% Full | >= 65% Full | >= 80% Full | >= 95% Full |
| Outgoing Feed | Batch Seq | Batch Num | Batch Max | %Full | Av. Pending |
|---|---|---|---|---|---|
| nbr.elbracht.net-o | 975679-975760 | 81 | 500 | 16 | 0.0 |
| text-spool-out | 0-0 | 0 | 500 | 0 | 0.0 |
| 1st Time | Last Time | # Msgs | Message |
|---|---|---|---|
| 07:08:06 | 07:09:54 | 26 | DNS Fwd/Rev mismatch: academyforinternetresearch.org/109.74.204.123 |
| 02:43:59 | 02:44:07 | 3 | DNS Fwd/Rev mismatch: lookup of unused-space.coop.net failed |
| 06:02:15 | 06:02:23 | 3 | DNS Fwd/Rev mismatch: lookup of scanner-07.ch1.censys-scanner.com failed |
| 17:55:17 | 17:55:24 | 3 | DNS Fwd/Rev mismatch: lookup of scanner-05.ch1.censys-scanner.com failed |