| |
DIABLO statistics for newsfeed.yoursite.com on Mon 05 Aug 2024 |
Generated on 20240805 2358 by feeder-stats v4.006. Copyright © 2002 The Diablo Project.
Diablo running processes:  81    Dnewslink running processes:  0


11:59PM  up 169 days,  7:18, 0 users, load averages: 1.51, 0.85, 0.73

Filesystem     Size    Used   Avail Capacity  Mounted on
/dev/da0s1g     94G    1.2G     85G     1%    /news
/dev/da1       7.3T    6.6T     62G    99%    /news2/spool/news/00
/dev/da2       7.3T    6.6T     62G    99%    /news2/spool/news/01
/dev/da3       3.7T    3.3T     62G    98%    /news2/spool/news/02
/dev/da4       5.5T      5T     68G    99%    /news2/spool/news/03
/dev/da8       7.3T    6.6T     63G    99%    /news2/spool/news/04
/dev/da9       7.3T    6.6T    118G    98%    /news2/spool/news/05
/dev/da10      7.3T    6.6T     62G    99%    /news2/spool/news/06
/dev/da11      5.5T    4.9T     95G    98%    /news2/spool/news/07
/dev/da12      5.5T      5T     86G    98%    /news2/spool/news/08
/dev/da13      7.3T    6.6T    119G    98%    /news2/spool/news/09
/dev/da14      7.3T    6.6T    117G    98%    /news2/spool/news/10
/dev/da15      7.3T    6.6T    117G    98%    /news2/spool/news/11
/dev/da16      7.3T    6.6T     62G    99%    /news2/spool/news/12
/dev/da17      7.3T    6.6T    118G    98%    /news2/spool/news/13
/dev/da18      7.3T    6.6T     62G    99%    /news2/spool/news/14
/dev/da19      7.3T    6.6T    118G    98%    /news2/spool/news/15
/dev/da20      7.3T    6.6T    119G    98%    /news2/spool/news/16
/dev/da21      7.3T    6.6T    115G    98%    /news2/spool/news/17
/dev/da22      7.3T    6.6T    118G    98%    /news2/spool/news/18
/dev/da23      7.3T    6.6T     62G    99%    /news2/spool/news/19
/dev/da24      7.3T    6.6T     63G    99%    /news2/spool/news/20
/dev/da25      7.3T    6.6T    119G    98%    /news2/spool/news/21
/dev/da26      7.3T    6.6T     62G    99%    /news2/spool/news/22
/dev/da5       221G     36G    167G    18%    /news1
/dev/md0        40G     14G     21G    39%    /news3
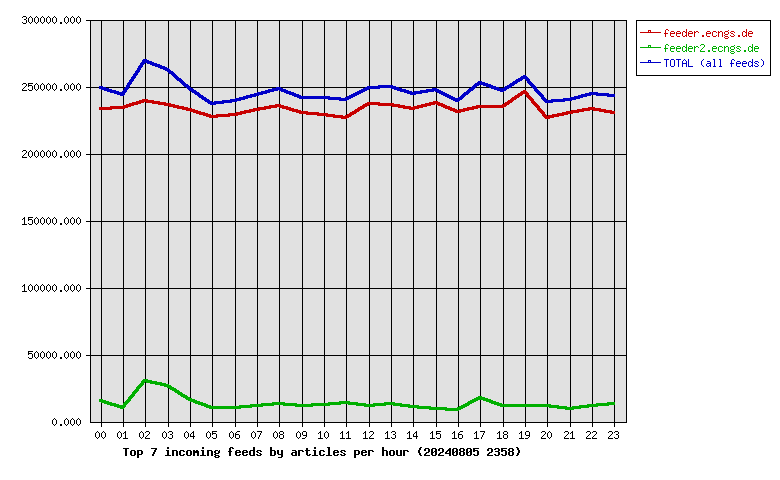
| Incoming Feed (+ Top1000 #) | Accepted | %Acc | %Tot | Art/sec | Volume | %Vol | KB/art | Check | Ihave | Spam | TooOld | Rejs | Errs | ||
|---|---|---|---|---|---|---|---|---|---|---|---|---|---|---|---|
| 1 | feeder.ecngs.de | 5594410 | 94.17 | 94.57 | 64.75 | 3.50TB | 99.92 | 672.21 | 5940691 | 0 | 0 | 0 | 214 | 0 | |
| 2 | feeder2.ecngs.de | 321263 | 90.98 | 5.43 | 3.73 | 2.81GB | 0.08 | 9.18 | 352931 | 0 | 0 | 0 | 171 | 0 | |
| Total | 5915673 | 0.00 | 100.00 | 68.48 | 3.51TB | 100.00 | 636.20 | 6293622 | 0 | 0 | 0 | 385 | 0 | ||
 |
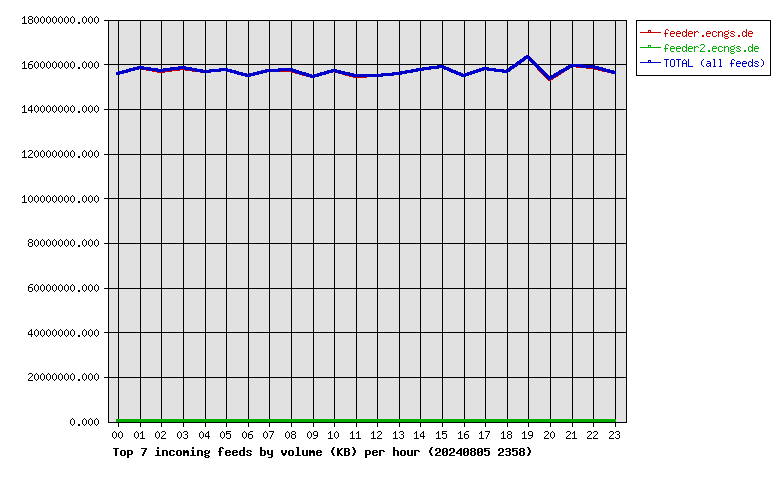
| Incoming Feed (+ Top1000 #) | Volume | %Vol | Kbps | Accepted | %Acc | %Tot | KB/art | Check | Ihave | Spam | TooOld | Rejs | Errs | ||
|---|---|---|---|---|---|---|---|---|---|---|---|---|---|---|---|
| 1 | feeder.ecngs.de | 3.50TB | 99.92 | 348204.30 | 5594410 | 94.17 | 94.57 | 672.21 | 5940691 | 0 | 0 | 0 | 214 | 0 | |
| 2 | feeder2.ecngs.de | 2.81GB | 0.08 | 274.21 | 321263 | 90.98 | 5.43 | 9.18 | 352931 | 0 | 0 | 0 | 171 | 0 | |
| Total | 3.51TB | 100.00 | 348478.51 | 5915673 | 0.00 | 100.00 | 636.20 | 6293622 | 0 | 0 | 0 | 385 | 0 | ||
 |
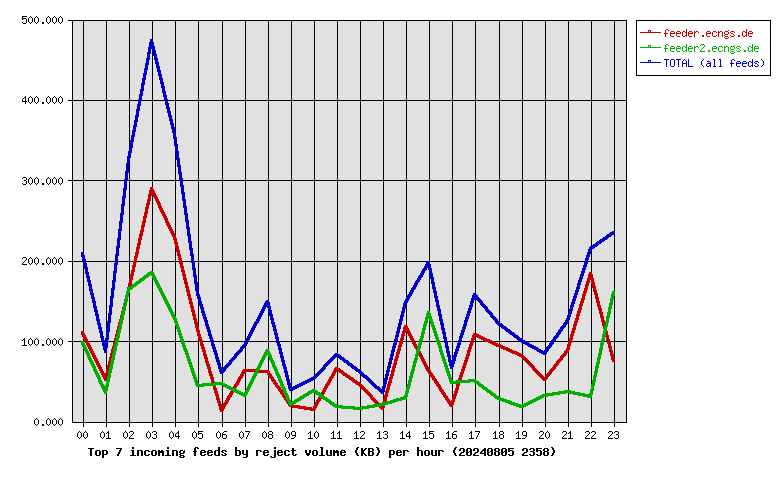
| Incoming Feed (+ Top1000 #) | Rej. Vol. | %Vol | Kbps | Accepted | %Acc | %Tot | KB/art | Check | Ihave | Spam | TooOld | Rejs | Errs | ||
|---|---|---|---|---|---|---|---|---|---|---|---|---|---|---|---|
| 1 | feeder.ecngs.de | 2.08MB | 58.76 | 0.20 | 5594410 | 94.17 | 94.57 | 672.21 | 5940691 | 0 | 0 | 0 | 214 | 0 | |
| 2 | feeder2.ecngs.de | 1.46MB | 41.24 | 0.14 | 321263 | 90.98 | 5.43 | 9.18 | 352931 | 0 | 0 | 0 | 171 | 0 | |
| Total | 3.55MB | 100.00 | 0.34 | 5915673 | 0.00 | 100.00 | 636.20 | 6293622 | 0 | 0 | 0 | 385 | 0 | ||
 |
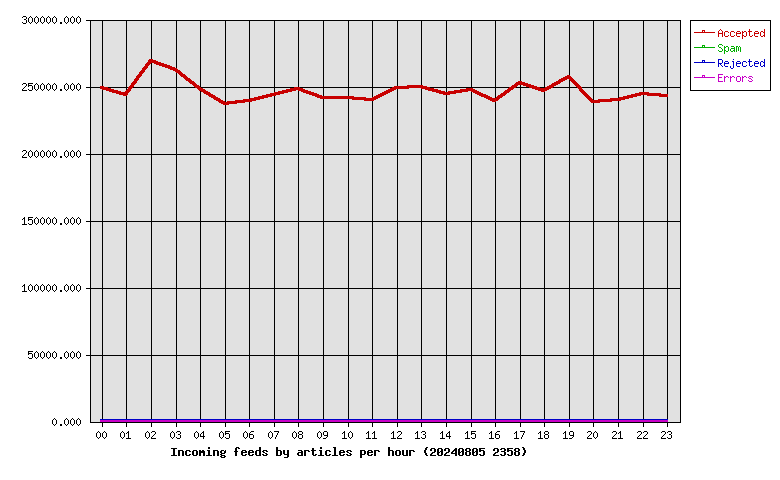
| Hour | Accepted | %Acc | Volume | %Vol | Check | Ihave | Spam | Rejs | Errs |
|---|---|---|---|---|---|---|---|---|---|
| 00 | 248650 | 4.20 | 148.31GB | 4.13 | 266682 | 0 | 0 | 20 | 0 |
| 01 | 243899 | 4.12 | 150.85GB | 4.20 | 255385 | 0 | 0 | 11 | 0 |
| 02 | 268944 | 4.55 | 149.61GB | 4.17 | 304059 | 0 | 0 | 32 | 0 |
| 03 | 262476 | 4.44 | 150.95GB | 4.21 | 291095 | 0 | 0 | 49 | 0 |
| 04 | 248343 | 4.20 | 149.32GB | 4.16 | 269306 | 0 | 0 | 31 | 0 |
| 05 | 237213 | 4.01 | 150.08GB | 4.18 | 255531 | 0 | 0 | 11 | 0 |
| 06 | 238815 | 4.04 | 147.46GB | 4.11 | 251349 | 0 | 0 | 8 | 0 |
| 07 | 243716 | 4.12 | 149.58GB | 4.17 | 256738 | 0 | 0 | 7 | 0 |
| 08 | 248419 | 4.20 | 149.99GB | 4.18 | 263044 | 0 | 0 | 11 | 0 |
| 09 | 241515 | 4.08 | 147.29GB | 4.10 | 254283 | 0 | 0 | 5 | 0 |
| 10 | 241353 | 4.08 | 149.56GB | 4.17 | 255763 | 0 | 0 | 7 | 0 |
| 11 | 240011 | 4.06 | 147.33GB | 4.10 | 256161 | 0 | 0 | 15 | 0 |
| 12 | 248839 | 4.21 | 147.61GB | 4.11 | 262318 | 0 | 0 | 8 | 0 |
| 13 | 249336 | 4.21 | 148.38GB | 4.13 | 264481 | 0 | 0 | 8 | 0 |
| 14 | 244769 | 4.14 | 150.03GB | 4.18 | 257286 | 0 | 0 | 14 | 0 |
| 15 | 247301 | 4.18 | 151.57GB | 4.22 | 257763 | 0 | 0 | 22 | 0 |
| 16 | 239548 | 4.05 | 147.73GB | 4.12 | 250337 | 0 | 0 | 8 | 0 |
| 17 | 252669 | 4.27 | 150.69GB | 4.20 | 272963 | 0 | 0 | 18 | 0 |
| 18 | 246499 | 4.17 | 149.43GB | 4.16 | 259894 | 0 | 0 | 15 | 0 |
| 19 | 257436 | 4.35 | 155.66GB | 4.34 | 270556 | 0 | 0 | 9 | 0 |
| 20 | 238551 | 4.03 | 146.09GB | 4.07 | 251509 | 0 | 0 | 8 | 0 |
| 21 | 239846 | 4.05 | 151.77GB | 4.23 | 250713 | 0 | 0 | 17 | 0 |
| 22 | 244335 | 4.13 | 151.20GB | 4.21 | 257310 | 0 | 0 | 18 | 0 |
| 23 | 243190 | 4.11 | 148.72GB | 4.14 | 259096 | 0 | 0 | 33 | 0 |
| Total | 5915673 | 100.00 | 3.51TB | 100.00 | 6293622 | 0 | 0 | 385 | 0 |
 |
| Outgoing Feed (+ Top1000 #) | Accepted | %Acc | %Tot | Art/sec | Volume | %Vol | KB/art | Dups | Rejs | % Ratio (Out/In) | ||
|---|---|---|---|---|---|---|---|---|---|---|---|---|
| 1 | 217.73.144.40 | 0 | 0.00 | 0.00 | 0.00 | 0.00KB | 0.00 | 0.00 | 5937885 | 0 | … | |
| Total | 0 | 0.00 | 0.00 | 0.00 | 0.00KB | 0.00 | 0.00 | 5937885 | 0 | |||
 |
| Outgoing Feed (+ Top1000 #) | Volume | %Vol | Kbps | Accepted | %Acc | %Tot | KB/art | Dups | Rejs | % Ratio (Out/In) | ||
|---|---|---|---|---|---|---|---|---|---|---|---|---|
| 1 | 217.73.144.40 | 0.00KB | 0.00 | 0.00 | 0 | 0.00 | 0.00 | 0.00 | 5937885 | 0 | … | |
| Total | 0.00KB | 0.00 | 0.00 | 0 | 0.00 | 0.00 | 0.00 | 5937885 | 0 | |||
 |
| Outgoing Feed (+ Top1000 #) | Rej. Vol. | %Vol | Kbps | Accepted | %Acc | %Tot | KB/art | Dups | Rejs | % Ratio (Out/In) | ||
|---|---|---|---|---|---|---|---|---|---|---|---|---|
| 1 | 217.73.144.40 | 0.00KB | 0.00 | 0.00 | 0 | 0.00 | 0.00 | 0.00 | 5937885 | 0 | … | |
| Total | 0.00KB | 0.00 | 0.00 | 0 | 0.00 | 0.00 | 0.00 | 5937885 | 0 | |||
 |
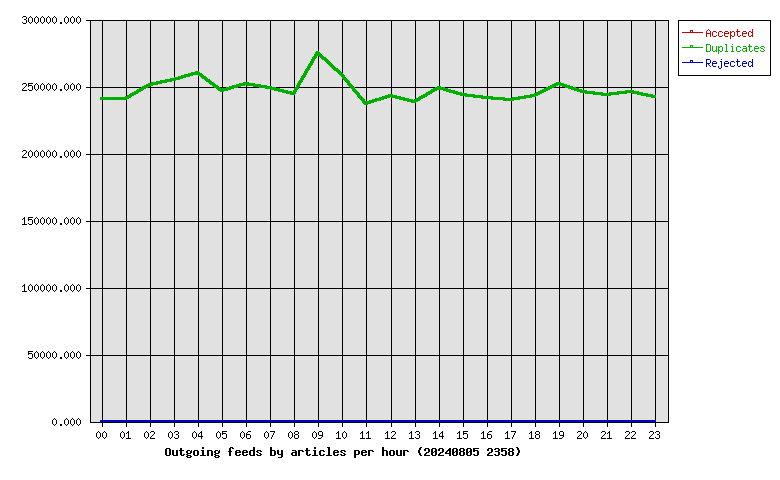
| Hour | Accepted | %Acc | Volume | %Vol | dups | Rejs |
|---|---|---|---|---|---|---|
| 00 | 0 | 0.00 | 0.00KB | 0.00 | 240413 | 0 |
| 01 | 0 | 0.00 | 0.00KB | 0.00 | 241008 | 0 |
| 02 | 0 | 0.00 | 0.00KB | 0.00 | 251004 | 0 |
| 03 | 0 | 0.00 | 0.00KB | 0.00 | 254626 | 0 |
| 04 | 0 | 0.00 | 0.00KB | 0.00 | 259986 | 0 |
| 05 | 0 | 0.00 | 0.00KB | 0.00 | 246556 | 0 |
| 06 | 0 | 0.00 | 0.00KB | 0.00 | 251633 | 0 |
| 07 | 0 | 0.00 | 0.00KB | 0.00 | 248640 | 0 |
| 08 | 0 | 0.00 | 0.00KB | 0.00 | 244723 | 0 |
| 09 | 0 | 0.00 | 0.00KB | 0.00 | 275269 | 0 |
| 10 | 0 | 0.00 | 0.00KB | 0.00 | 258723 | 0 |
| 11 | 0 | 0.00 | 0.00KB | 0.00 | 236704 | 0 |
| 12 | 0 | 0.00 | 0.00KB | 0.00 | 243132 | 0 |
| 13 | 0 | 0.00 | 0.00KB | 0.00 | 238727 | 0 |
| 14 | 0 | 0.00 | 0.00KB | 0.00 | 248889 | 0 |
| 15 | 0 | 0.00 | 0.00KB | 0.00 | 243335 | 0 |
| 16 | 0 | 0.00 | 0.00KB | 0.00 | 241283 | 0 |
| 17 | 0 | 0.00 | 0.00KB | 0.00 | 240233 | 0 |
| 18 | 0 | 0.00 | 0.00KB | 0.00 | 242899 | 0 |
| 19 | 0 | 0.00 | 0.00KB | 0.00 | 252187 | 0 |
| 20 | 0 | 0.00 | 0.00KB | 0.00 | 245548 | 0 |
| 21 | 0 | 0.00 | 0.00KB | 0.00 | 243962 | 0 |
| 22 | 0 | 0.00 | 0.00KB | 0.00 | 245938 | 0 |
| 23 | 0 | 0.00 | 0.00KB | 0.00 | 242467 | 0 |
| Total | 0 | 0.00 | 0.00KB | 0.00 | 5937885 | 0 |
 |
| >= 20% Full | >= 35% Full | >= 50% Full | >= 65% Full | >= 80% Full | >= 95% Full |
| Outgoing Feed | Batch Seq | Batch Num | Batch Max | %Full | Av. Pending |
|---|---|---|---|---|---|
| nbr.elbracht.net-o | 975391-975472 | 81 | 500 | 16 | 0.0 |
| text-spool-out | 0-0 | 0 | 500 | 0 | 0.0 |
| 1st Time | Last Time | # Msgs | Message |
|---|---|---|---|
| 23:04:35 | 23:04:42 | 3 | DNS Fwd/Rev mismatch: lookup of scanner-01.fr7.censys-scanner.com failed |