| |
DIABLO statistics for newsfeed.yoursite.com on Sun 04 Aug 2024 |
Generated on 20240804 2358 by feeder-stats v4.006. Copyright © 2002 The Diablo Project.
Diablo running processes:  81    Dnewslink running processes:  0


11:59PM  up 168 days,  7:18, 0 users, load averages: 1.24, 0.83, 0.74

Filesystem     Size    Used   Avail Capacity  Mounted on
/dev/da0s1g     94G    1.2G     85G     1%    /news
/dev/da1       7.3T    6.6T    107G    98%    /news2/spool/news/00
/dev/da2       7.3T    6.6T    106G    98%    /news2/spool/news/01
/dev/da3       3.7T    3.3T     63G    98%    /news2/spool/news/02
/dev/da4       5.5T      5T     65G    99%    /news2/spool/news/03
/dev/da8       7.3T    6.6T    108G    98%    /news2/spool/news/04
/dev/da9       7.3T    6.6T    105G    98%    /news2/spool/news/05
/dev/da10      7.3T    6.6T    106G    98%    /news2/spool/news/06
/dev/da11      5.5T    4.9T     94G    98%    /news2/spool/news/07
/dev/da12      5.5T      5T     75G    99%    /news2/spool/news/08
/dev/da13      7.3T    6.6T    106G    98%    /news2/spool/news/09
/dev/da14      7.3T    6.6T    104G    98%    /news2/spool/news/10
/dev/da15      7.3T    6.6T    104G    98%    /news2/spool/news/11
/dev/da16      7.3T    6.6T    108G    98%    /news2/spool/news/12
/dev/da17      7.3T    6.6T    105G    98%    /news2/spool/news/13
/dev/da18      7.3T    6.6T    108G    98%    /news2/spool/news/14
/dev/da19      7.3T    6.6T    104G    98%    /news2/spool/news/15
/dev/da20      7.3T    6.6T    105G    98%    /news2/spool/news/16
/dev/da21      7.3T    6.6T    102G    99%    /news2/spool/news/17
/dev/da22      7.3T    6.6T    104G    98%    /news2/spool/news/18
/dev/da23      7.3T    6.6T    106G    98%    /news2/spool/news/19
/dev/da24      7.3T    6.6T    108G    98%    /news2/spool/news/20
/dev/da25      7.3T    6.6T    106G    98%    /news2/spool/news/21
/dev/da26      7.3T    6.6T    107G    98%    /news2/spool/news/22
/dev/da5       221G     35G    168G    18%    /news1
/dev/md0        40G     14G     21G    39%    /news3
| Incoming Feed (+ Top1000 #) | Accepted | %Acc | %Tot | Art/sec | Volume | %Vol | KB/art | Check | Ihave | Spam | TooOld | Rejs | Errs | ||
|---|---|---|---|---|---|---|---|---|---|---|---|---|---|---|---|
| 1 | feeder.ecngs.de | 5628201 | 92.43 | 92.96 | 65.14 | 3.54TB | 99.90 | 675.92 | 6089093 | 0 | 0 | 0 | 262 | 0 | |
| 2 | feeder2.ecngs.de | 426141 | 90.62 | 7.04 | 4.94 | 3.53GB | 0.10 | 8.69 | 469928 | 0 | 0 | 0 | 299 | 0 | |
| Total | 6054342 | 0.00 | 100.00 | 70.09 | 3.55TB | 100.00 | 628.96 | 6559021 | 0 | 0 | 0 | 561 | 0 | ||
 |
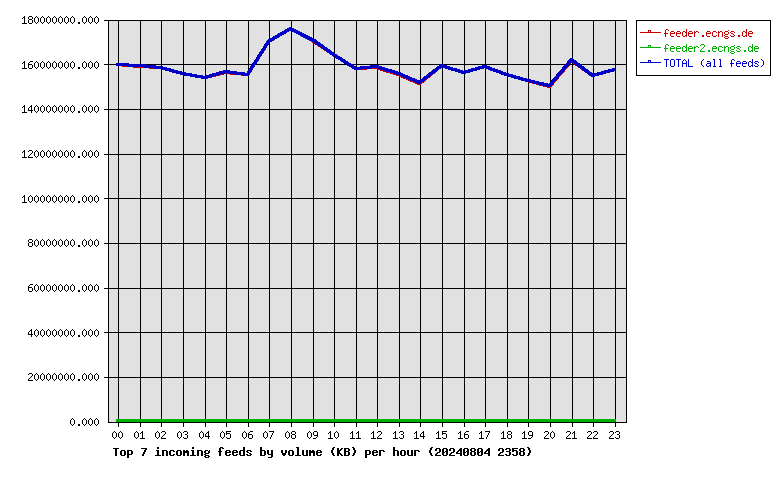
| Incoming Feed (+ Top1000 #) | Volume | %Vol | Kbps | Accepted | %Acc | %Tot | KB/art | Check | Ihave | Spam | TooOld | Rejs | Errs | ||
|---|---|---|---|---|---|---|---|---|---|---|---|---|---|---|---|
| 1 | feeder.ecngs.de | 3.54TB | 99.90 | 352244.10 | 5628201 | 92.43 | 92.96 | 675.92 | 6089093 | 0 | 0 | 0 | 262 | 0 | |
| 2 | feeder2.ecngs.de | 3.53GB | 0.10 | 343.92 | 426141 | 90.62 | 7.04 | 8.69 | 469928 | 0 | 0 | 0 | 299 | 0 | |
| Total | 3.55TB | 100.00 | 352588.02 | 6054342 | 0.00 | 100.00 | 628.96 | 6559021 | 0 | 0 | 0 | 561 | 0 | ||
 |
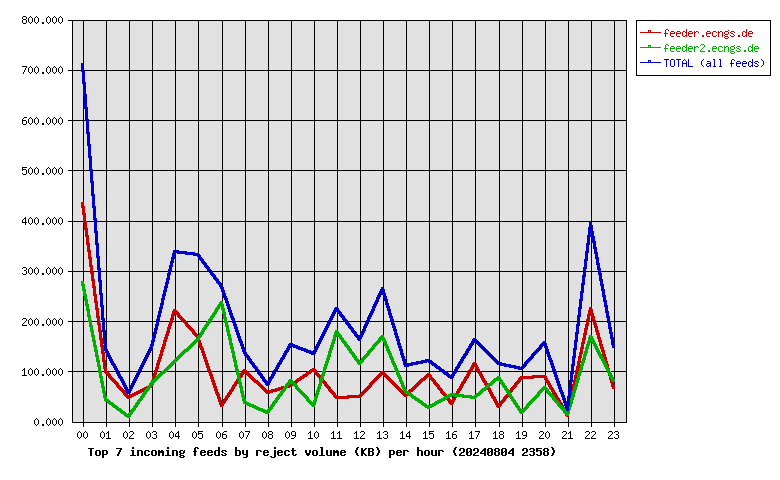
| Incoming Feed (+ Top1000 #) | Rej. Vol. | %Vol | Kbps | Accepted | %Acc | %Tot | KB/art | Check | Ihave | Spam | TooOld | Rejs | Errs | ||
|---|---|---|---|---|---|---|---|---|---|---|---|---|---|---|---|
| 1 | feeder.ecngs.de | 2.34MB | 52.51 | 0.22 | 5628201 | 92.43 | 92.96 | 675.92 | 6089093 | 0 | 0 | 0 | 262 | 0 | |
| 2 | feeder2.ecngs.de | 2.11MB | 47.49 | 0.20 | 426141 | 90.62 | 7.04 | 8.69 | 469928 | 0 | 0 | 0 | 299 | 0 | |
| Total | 4.45MB | 100.00 | 0.42 | 6054342 | 0.00 | 100.00 | 628.96 | 6559021 | 0 | 0 | 0 | 561 | 0 | ||
 |
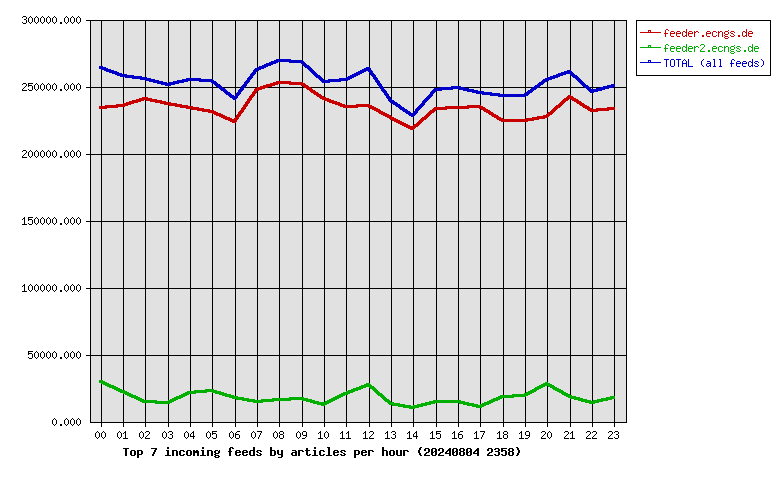
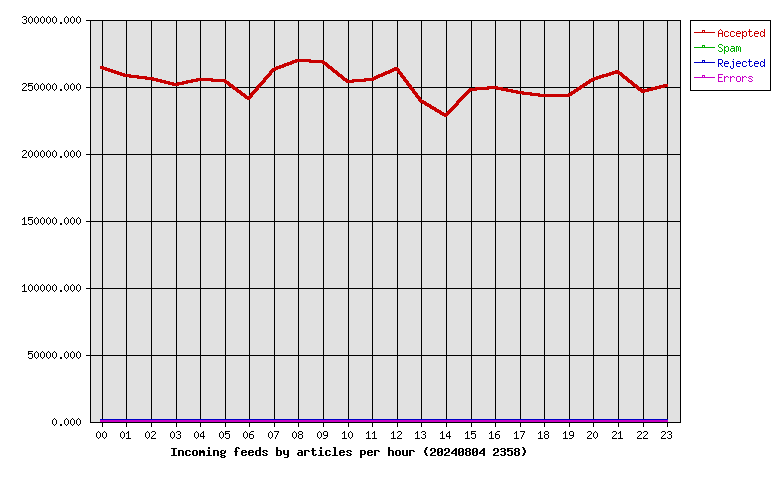
| Hour | Accepted | %Acc | Volume | %Vol | Check | Ihave | Spam | Rejs | Errs |
|---|---|---|---|---|---|---|---|---|---|
| 00 | 263805 | 4.36 | 152.31GB | 4.19 | 297215 | 0 | 0 | 56 | 0 |
| 01 | 257701 | 4.26 | 151.66GB | 4.18 | 284144 | 0 | 0 | 12 | 0 |
| 02 | 255312 | 4.22 | 150.99GB | 4.16 | 272185 | 0 | 0 | 7 | 0 |
| 03 | 251270 | 4.15 | 148.32GB | 4.08 | 266763 | 0 | 0 | 13 | 0 |
| 04 | 255063 | 4.21 | 146.80GB | 4.04 | 280926 | 0 | 0 | 39 | 0 |
| 05 | 254119 | 4.20 | 149.15GB | 4.11 | 291948 | 0 | 0 | 36 | 0 |
| 06 | 240720 | 3.98 | 147.94GB | 4.07 | 260059 | 0 | 0 | 23 | 0 |
| 07 | 262311 | 4.33 | 162.00GB | 4.46 | 279408 | 0 | 0 | 21 | 0 |
| 08 | 268791 | 4.44 | 167.72GB | 4.62 | 287036 | 0 | 0 | 12 | 0 |
| 09 | 268400 | 4.43 | 162.74GB | 4.48 | 287428 | 0 | 0 | 16 | 0 |
| 10 | 253116 | 4.18 | 156.46GB | 4.31 | 267288 | 0 | 0 | 15 | 0 |
| 11 | 255165 | 4.21 | 150.73GB | 4.15 | 279790 | 0 | 0 | 32 | 0 |
| 12 | 262884 | 4.34 | 151.33GB | 4.17 | 295284 | 0 | 0 | 38 | 0 |
| 13 | 239008 | 3.95 | 148.28GB | 4.08 | 254325 | 0 | 0 | 25 | 0 |
| 14 | 227956 | 3.77 | 144.40GB | 3.98 | 239850 | 0 | 0 | 11 | 0 |
| 15 | 247644 | 4.09 | 151.78GB | 4.18 | 262866 | 0 | 0 | 12 | 0 |
| 16 | 248696 | 4.11 | 148.91GB | 4.10 | 265550 | 0 | 0 | 13 | 0 |
| 17 | 245073 | 4.05 | 151.46GB | 4.17 | 257449 | 0 | 0 | 18 | 0 |
| 18 | 242618 | 4.01 | 148.02GB | 4.08 | 263812 | 0 | 0 | 18 | 0 |
| 19 | 242992 | 4.01 | 145.32GB | 4.00 | 264286 | 0 | 0 | 22 | 0 |
| 20 | 254706 | 4.21 | 143.23GB | 3.94 | 286311 | 0 | 0 | 27 | 0 |
| 21 | 260582 | 4.30 | 154.28GB | 4.25 | 281449 | 0 | 0 | 9 | 0 |
| 22 | 246005 | 4.06 | 147.61GB | 4.06 | 263790 | 0 | 0 | 56 | 0 |
| 23 | 250405 | 4.14 | 150.10GB | 4.13 | 269859 | 0 | 0 | 30 | 0 |
| Total | 6054342 | 100.00 | 3.55TB | 100.00 | 6559021 | 0 | 0 | 561 | 0 |
 |
| Outgoing Feed (+ Top1000 #) | Accepted | %Acc | %Tot | Art/sec | Volume | %Vol | KB/art | Dups | Rejs | % Ratio (Out/In) | ||
|---|---|---|---|---|---|---|---|---|---|---|---|---|
| 1 | 217.73.144.40 | 0 | 0.00 | 0.00 | 0.00 | 0.00KB | 0.00 | 0.00 | 6077984 | 0 | … | |
| Total | 0 | 0.00 | 0.00 | 0.00 | 0.00KB | 0.00 | 0.00 | 6077984 | 0 | |||
 |
| Outgoing Feed (+ Top1000 #) | Volume | %Vol | Kbps | Accepted | %Acc | %Tot | KB/art | Dups | Rejs | % Ratio (Out/In) | ||
|---|---|---|---|---|---|---|---|---|---|---|---|---|
| 1 | 217.73.144.40 | 0.00KB | 0.00 | 0.00 | 0 | 0.00 | 0.00 | 0.00 | 6077984 | 0 | … | |
| Total | 0.00KB | 0.00 | 0.00 | 0 | 0.00 | 0.00 | 0.00 | 6077984 | 0 | |||
 |
| Outgoing Feed (+ Top1000 #) | Rej. Vol. | %Vol | Kbps | Accepted | %Acc | %Tot | KB/art | Dups | Rejs | % Ratio (Out/In) | ||
|---|---|---|---|---|---|---|---|---|---|---|---|---|
| 1 | 217.73.144.40 | 0.00KB | 0.00 | 0.00 | 0 | 0.00 | 0.00 | 0.00 | 6077984 | 0 | … | |
| Total | 0.00KB | 0.00 | 0.00 | 0 | 0.00 | 0.00 | 0.00 | 6077984 | 0 | |||
 |
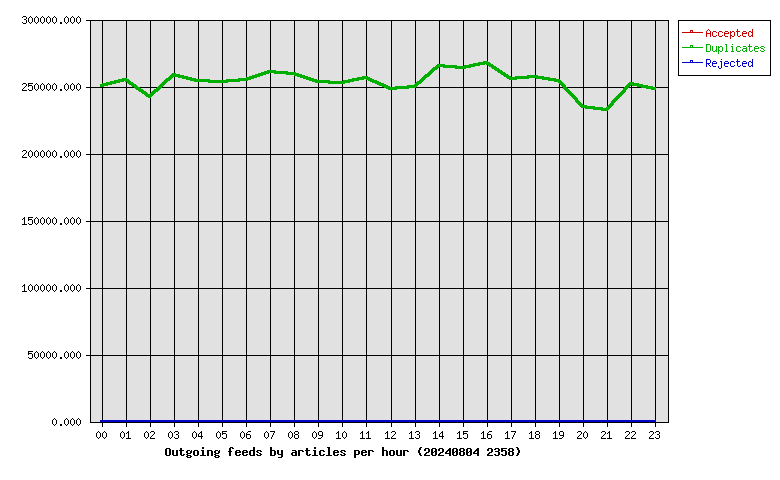
| Hour | Accepted | %Acc | Volume | %Vol | dups | Rejs |
|---|---|---|---|---|---|---|
| 00 | 0 | 0.00 | 0.00KB | 0.00 | 250436 | 0 |
| 01 | 0 | 0.00 | 0.00KB | 0.00 | 255094 | 0 |
| 02 | 0 | 0.00 | 0.00KB | 0.00 | 241986 | 0 |
| 03 | 0 | 0.00 | 0.00KB | 0.00 | 258728 | 0 |
| 04 | 0 | 0.00 | 0.00KB | 0.00 | 253890 | 0 |
| 05 | 0 | 0.00 | 0.00KB | 0.00 | 253251 | 0 |
| 06 | 0 | 0.00 | 0.00KB | 0.00 | 254777 | 0 |
| 07 | 0 | 0.00 | 0.00KB | 0.00 | 260677 | 0 |
| 08 | 0 | 0.00 | 0.00KB | 0.00 | 259658 | 0 |
| 09 | 0 | 0.00 | 0.00KB | 0.00 | 253653 | 0 |
| 10 | 0 | 0.00 | 0.00KB | 0.00 | 252304 | 0 |
| 11 | 0 | 0.00 | 0.00KB | 0.00 | 255975 | 0 |
| 12 | 0 | 0.00 | 0.00KB | 0.00 | 248270 | 0 |
| 13 | 0 | 0.00 | 0.00KB | 0.00 | 249661 | 0 |
| 14 | 0 | 0.00 | 0.00KB | 0.00 | 265053 | 0 |
| 15 | 0 | 0.00 | 0.00KB | 0.00 | 263783 | 0 |
| 16 | 0 | 0.00 | 0.00KB | 0.00 | 267280 | 0 |
| 17 | 0 | 0.00 | 0.00KB | 0.00 | 255690 | 0 |
| 18 | 0 | 0.00 | 0.00KB | 0.00 | 256720 | 0 |
| 19 | 0 | 0.00 | 0.00KB | 0.00 | 254295 | 0 |
| 20 | 0 | 0.00 | 0.00KB | 0.00 | 234560 | 0 |
| 21 | 0 | 0.00 | 0.00KB | 0.00 | 232404 | 0 |
| 22 | 0 | 0.00 | 0.00KB | 0.00 | 252047 | 0 |
| 23 | 0 | 0.00 | 0.00KB | 0.00 | 247792 | 0 |
| Total | 0 | 0.00 | 0.00KB | 0.00 | 6077984 | 0 |
 |
| >= 20% Full | >= 35% Full | >= 50% Full | >= 65% Full | >= 80% Full | >= 95% Full |
| Outgoing Feed | Batch Seq | Batch Num | Batch Max | %Full | Av. Pending |
|---|---|---|---|---|---|
| nbr.elbracht.net-o | 975103-975184 | 81 | 500 | 16 | 0.0 |
| text-spool-out | 0-0 | 0 | 500 | 0 | 0.0 |
| 1st Time | Last Time | # Msgs | Message |
|---|---|---|---|
| 04:14:21 | 1 | DNS Fwd/Rev mismatch: visit.keznews.com/194.165.16.76 |