| |
DIABLO statistics for newsfeed.yoursite.com on Sat 03 Aug 2024 |
Generated on 20240803 2358 by feeder-stats v4.006. Copyright © 2002 The Diablo Project.
Diablo running processes:  81    Dnewslink running processes:  0


11:59PM  up 167 days,  7:18, 0 users, load averages: 1.37, 0.91, 0.76

Filesystem     Size    Used   Avail Capacity  Mounted on
/dev/da0s1g     94G    1.2G     85G     1%    /news
/dev/da1       7.3T    6.6T     93G    99%    /news2/spool/news/00
/dev/da2       7.3T    6.6T     92G    99%    /news2/spool/news/01
/dev/da3       3.7T    3.3T     68G    98%    /news2/spool/news/02
/dev/da4       5.5T      5T     63G    99%    /news2/spool/news/03
/dev/da8       7.3T    6.6T     94G    99%    /news2/spool/news/04
/dev/da9       7.3T    6.6T     90G    99%    /news2/spool/news/05
/dev/da10      7.3T    6.6T     92G    99%    /news2/spool/news/06
/dev/da11      5.5T      5T     87G    98%    /news2/spool/news/07
/dev/da12      5.5T      5T     65G    99%    /news2/spool/news/08
/dev/da13      7.3T    6.6T     90G    99%    /news2/spool/news/09
/dev/da14      7.3T    6.6T     89G    99%    /news2/spool/news/10
/dev/da15      7.3T    6.6T     89G    99%    /news2/spool/news/11
/dev/da16      7.3T    6.6T     93G    99%    /news2/spool/news/12
/dev/da17      7.3T    6.6T     90G    99%    /news2/spool/news/13
/dev/da18      7.3T    6.6T     93G    99%    /news2/spool/news/14
/dev/da19      7.3T    6.6T     89G    99%    /news2/spool/news/15
/dev/da20      7.3T    6.6T     90G    99%    /news2/spool/news/16
/dev/da21      7.3T    6.6T     87G    99%    /news2/spool/news/17
/dev/da22      7.3T    6.6T     89G    99%    /news2/spool/news/18
/dev/da23      7.3T    6.6T     92G    99%    /news2/spool/news/19
/dev/da24      7.3T    6.6T     93G    99%    /news2/spool/news/20
/dev/da25      7.3T    6.6T     91G    99%    /news2/spool/news/21
/dev/da26      7.3T    6.6T     92G    99%    /news2/spool/news/22
/dev/da5       221G     35G    168G    18%    /news1
/dev/md0        40G     14G     22G    39%    /news3
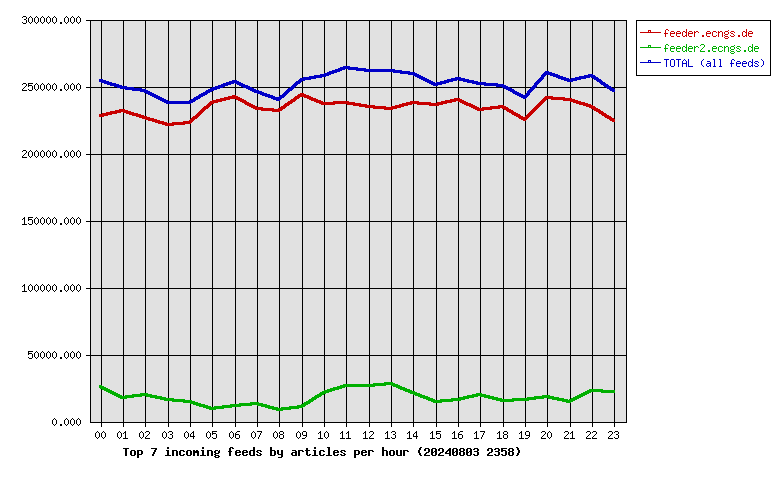
| Incoming Feed (+ Top1000 #) | Accepted | %Acc | %Tot | Art/sec | Volume | %Vol | KB/art | Check | Ihave | Spam | TooOld | Rejs | Errs | ||
|---|---|---|---|---|---|---|---|---|---|---|---|---|---|---|---|
| 1 | feeder.ecngs.de | 5606620 | 92.40 | 92.85 | 64.89 | 3.51TB | 99.90 | 671.85 | 6067242 | 0 | 0 | 0 | 255 | 0 | |
| 2 | feeder2.ecngs.de | 431452 | 91.24 | 7.15 | 5.01 | 3.42GB | 0.10 | 8.32 | 472615 | 0 | 0 | 0 | 255 | 0 | |
| Total | 6038072 | 0.00 | 100.00 | 69.90 | 3.51TB | 100.00 | 624.43 | 6539857 | 0 | 0 | 0 | 510 | 0 | ||
 |
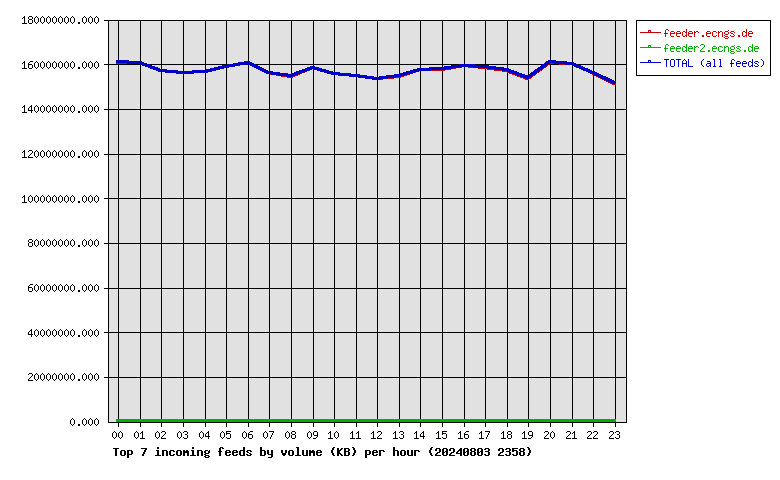
| Incoming Feed (+ Top1000 #) | Volume | %Vol | Kbps | Accepted | %Acc | %Tot | KB/art | Check | Ihave | Spam | TooOld | Rejs | Errs | ||
|---|---|---|---|---|---|---|---|---|---|---|---|---|---|---|---|
| 1 | feeder.ecngs.de | 3.51TB | 99.90 | 348776.79 | 5606620 | 92.40 | 92.85 | 671.85 | 6067242 | 0 | 0 | 0 | 255 | 0 | |
| 2 | feeder2.ecngs.de | 3.42GB | 0.10 | 333.60 | 431452 | 91.24 | 7.15 | 8.32 | 472615 | 0 | 0 | 0 | 255 | 0 | |
| Total | 3.51TB | 100.00 | 349110.39 | 6038072 | 0.00 | 100.00 | 624.43 | 6539857 | 0 | 0 | 0 | 510 | 0 | ||
 |
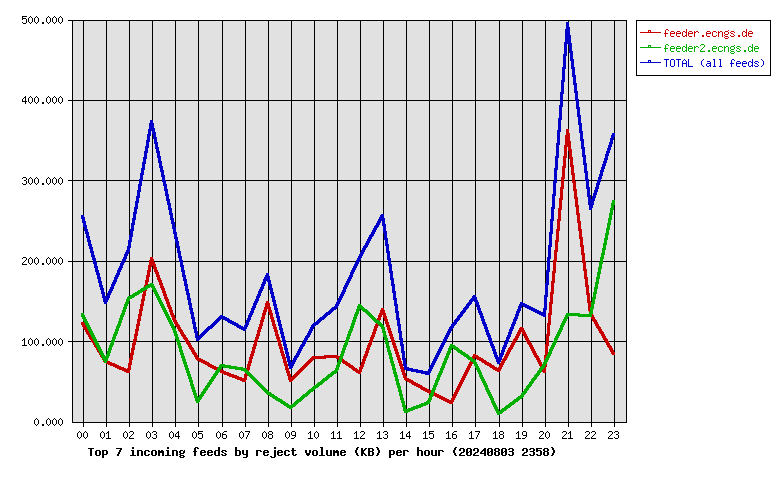
| Incoming Feed (+ Top1000 #) | Rej. Vol. | %Vol | Kbps | Accepted | %Acc | %Tot | KB/art | Check | Ihave | Spam | TooOld | Rejs | Errs | ||
|---|---|---|---|---|---|---|---|---|---|---|---|---|---|---|---|
| 1 | feeder.ecngs.de | 2.28MB | 53.15 | 0.22 | 5606620 | 92.40 | 92.85 | 671.85 | 6067242 | 0 | 0 | 0 | 255 | 0 | |
| 2 | feeder2.ecngs.de | 2.01MB | 46.85 | 0.19 | 431452 | 91.24 | 7.15 | 8.32 | 472615 | 0 | 0 | 0 | 255 | 0 | |
| Total | 4.30MB | 100.00 | 0.41 | 6038072 | 0.00 | 100.00 | 624.43 | 6539857 | 0 | 0 | 0 | 510 | 0 | ||
 |
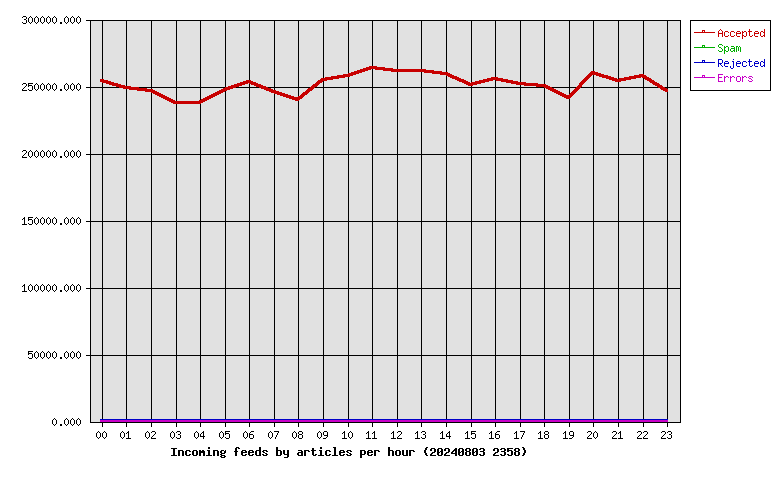
| Hour | Accepted | %Acc | Volume | %Vol | Check | Ihave | Spam | Rejs | Errs |
|---|---|---|---|---|---|---|---|---|---|
| 00 | 254102 | 4.21 | 153.49GB | 4.27 | 283646 | 0 | 0 | 35 | 0 |
| 01 | 249064 | 4.12 | 153.10GB | 4.26 | 268283 | 0 | 0 | 19 | 0 |
| 02 | 246513 | 4.08 | 149.72GB | 4.16 | 270290 | 0 | 0 | 29 | 0 |
| 03 | 237352 | 3.93 | 148.81GB | 4.14 | 252152 | 0 | 0 | 26 | 0 |
| 04 | 237724 | 3.94 | 149.27GB | 4.15 | 258979 | 0 | 0 | 21 | 0 |
| 05 | 247025 | 4.09 | 151.33GB | 4.21 | 260410 | 0 | 0 | 14 | 0 |
| 06 | 253621 | 4.20 | 153.14GB | 4.26 | 266909 | 0 | 0 | 19 | 0 |
| 07 | 245574 | 4.07 | 148.81GB | 4.14 | 260122 | 0 | 0 | 17 | 0 |
| 08 | 240054 | 3.98 | 147.37GB | 4.10 | 249819 | 0 | 0 | 13 | 0 |
| 09 | 254605 | 4.22 | 151.14GB | 4.20 | 266786 | 0 | 0 | 5 | 0 |
| 10 | 258002 | 4.27 | 148.50GB | 4.13 | 282556 | 0 | 0 | 7 | 0 |
| 11 | 264092 | 4.37 | 147.47GB | 4.10 | 293922 | 0 | 0 | 29 | 0 |
| 12 | 261260 | 4.33 | 146.42GB | 4.07 | 292580 | 0 | 0 | 35 | 0 |
| 13 | 261470 | 4.33 | 147.45GB | 4.10 | 293471 | 0 | 0 | 57 | 0 |
| 14 | 259165 | 4.29 | 150.22GB | 4.18 | 283416 | 0 | 0 | 17 | 0 |
| 15 | 250859 | 4.15 | 150.32GB | 4.18 | 265950 | 0 | 0 | 13 | 0 |
| 16 | 255553 | 4.23 | 151.90GB | 4.22 | 275704 | 0 | 0 | 12 | 0 |
| 17 | 252083 | 4.17 | 151.21GB | 4.21 | 274608 | 0 | 0 | 15 | 0 |
| 18 | 250065 | 4.14 | 150.02GB | 4.17 | 267597 | 0 | 0 | 9 | 0 |
| 19 | 241206 | 3.99 | 146.59GB | 4.08 | 260263 | 0 | 0 | 17 | 0 |
| 20 | 259959 | 4.31 | 153.35GB | 4.26 | 281588 | 0 | 0 | 9 | 0 |
| 21 | 254356 | 4.21 | 152.72GB | 4.25 | 272454 | 0 | 0 | 41 | 0 |
| 22 | 258097 | 4.27 | 148.98GB | 4.14 | 285392 | 0 | 0 | 28 | 0 |
| 23 | 246271 | 4.08 | 144.36GB | 4.01 | 272960 | 0 | 0 | 23 | 0 |
| Total | 6038072 | 100.00 | 3.51TB | 100.00 | 6539857 | 0 | 0 | 510 | 0 |
 |
| Outgoing Feed (+ Top1000 #) | Accepted | %Acc | %Tot | Art/sec | Volume | %Vol | KB/art | Dups | Rejs | % Ratio (Out/In) | ||
|---|---|---|---|---|---|---|---|---|---|---|---|---|
| 1 | 217.73.144.40 | 0 | 0.00 | 0.00 | 0.00 | 0.00KB | 0.00 | 0.00 | 6025695 | 0 | … | |
| Total | 0 | 0.00 | 0.00 | 0.00 | 0.00KB | 0.00 | 0.00 | 6025695 | 0 | |||
 |
| Outgoing Feed (+ Top1000 #) | Volume | %Vol | Kbps | Accepted | %Acc | %Tot | KB/art | Dups | Rejs | % Ratio (Out/In) | ||
|---|---|---|---|---|---|---|---|---|---|---|---|---|
| 1 | 217.73.144.40 | 0.00KB | 0.00 | 0.00 | 0 | 0.00 | 0.00 | 0.00 | 6025695 | 0 | … | |
| Total | 0.00KB | 0.00 | 0.00 | 0 | 0.00 | 0.00 | 0.00 | 6025695 | 0 | |||
 |
| Outgoing Feed (+ Top1000 #) | Rej. Vol. | %Vol | Kbps | Accepted | %Acc | %Tot | KB/art | Dups | Rejs | % Ratio (Out/In) | ||
|---|---|---|---|---|---|---|---|---|---|---|---|---|
| 1 | 217.73.144.40 | 0.00KB | 0.00 | 0.00 | 0 | 0.00 | 0.00 | 0.00 | 6025695 | 0 | … | |
| Total | 0.00KB | 0.00 | 0.00 | 0 | 0.00 | 0.00 | 0.00 | 6025695 | 0 | |||
 |
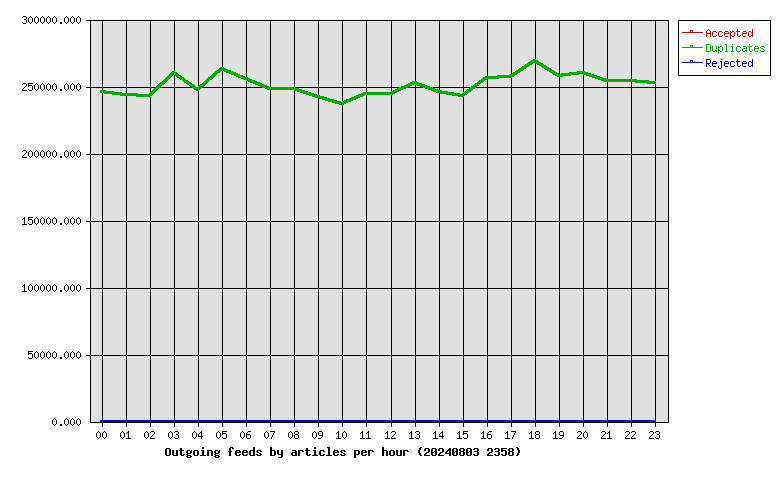
| Hour | Accepted | %Acc | Volume | %Vol | dups | Rejs |
|---|---|---|---|---|---|---|
| 00 | 0 | 0.00 | 0.00KB | 0.00 | 246159 | 0 |
| 01 | 0 | 0.00 | 0.00KB | 0.00 | 243708 | 0 |
| 02 | 0 | 0.00 | 0.00KB | 0.00 | 243012 | 0 |
| 03 | 0 | 0.00 | 0.00KB | 0.00 | 259847 | 0 |
| 04 | 0 | 0.00 | 0.00KB | 0.00 | 247121 | 0 |
| 05 | 0 | 0.00 | 0.00KB | 0.00 | 263008 | 0 |
| 06 | 0 | 0.00 | 0.00KB | 0.00 | 255697 | 0 |
| 07 | 0 | 0.00 | 0.00KB | 0.00 | 248127 | 0 |
| 08 | 0 | 0.00 | 0.00KB | 0.00 | 248132 | 0 |
| 09 | 0 | 0.00 | 0.00KB | 0.00 | 241954 | 0 |
| 10 | 0 | 0.00 | 0.00KB | 0.00 | 236628 | 0 |
| 11 | 0 | 0.00 | 0.00KB | 0.00 | 244712 | 0 |
| 12 | 0 | 0.00 | 0.00KB | 0.00 | 244617 | 0 |
| 13 | 0 | 0.00 | 0.00KB | 0.00 | 252758 | 0 |
| 14 | 0 | 0.00 | 0.00KB | 0.00 | 245820 | 0 |
| 15 | 0 | 0.00 | 0.00KB | 0.00 | 243042 | 0 |
| 16 | 0 | 0.00 | 0.00KB | 0.00 | 256470 | 0 |
| 17 | 0 | 0.00 | 0.00KB | 0.00 | 256919 | 0 |
| 18 | 0 | 0.00 | 0.00KB | 0.00 | 268991 | 0 |
| 19 | 0 | 0.00 | 0.00KB | 0.00 | 258090 | 0 |
| 20 | 0 | 0.00 | 0.00KB | 0.00 | 259956 | 0 |
| 21 | 0 | 0.00 | 0.00KB | 0.00 | 253845 | 0 |
| 22 | 0 | 0.00 | 0.00KB | 0.00 | 254107 | 0 |
| 23 | 0 | 0.00 | 0.00KB | 0.00 | 252975 | 0 |
| Total | 0 | 0.00 | 0.00KB | 0.00 | 6025695 | 0 |
 |
| >= 20% Full | >= 35% Full | >= 50% Full | >= 65% Full | >= 80% Full | >= 95% Full |
| Outgoing Feed | Batch Seq | Batch Num | Batch Max | %Full | Av. Pending |
|---|---|---|---|---|---|
| nbr.elbracht.net-o | 974815-974896 | 81 | 500 | 16 | 0.0 |
| text-spool-out | 0-0 | 0 | 500 | 0 | 0.0 |
| 1st Time | Last Time | # Msgs | Message |
|---|---|---|---|
| 21:41:35 | 21:41:42 | 3 | DNS Fwd/Rev mismatch: lookup of scanner-27.ch1.censys-scanner.com failed |