| |
DIABLO statistics for newsfeed.yoursite.com on Fri 02 Aug 2024 |
Generated on 20240802 2358 by feeder-stats v4.006. Copyright © 2002 The Diablo Project.
Diablo running processes:  81    Dnewslink running processes:  0


11:59PM  up 166 days,  7:18, 0 users, load averages: 1.12, 0.68, 0.65

Filesystem     Size    Used   Avail Capacity  Mounted on
/dev/da0s1g     94G    1.2G     85G     1%    /news
/dev/da1       7.3T    6.6T     81G    99%    /news2/spool/news/00
/dev/da2       7.3T    6.6T     79G    99%    /news2/spool/news/01
/dev/da3       3.7T    3.3T     65G    98%    /news2/spool/news/02
/dev/da4       5.5T      5T     87G    98%    /news2/spool/news/03
/dev/da8       7.3T    6.6T     80G    99%    /news2/spool/news/04
/dev/da9       7.3T    6.6T     77G    99%    /news2/spool/news/05
/dev/da10      7.3T    6.6T     79G    99%    /news2/spool/news/06
/dev/da11      5.5T      5T     84G    98%    /news2/spool/news/07
/dev/da12      5.5T    4.9T     97G    98%    /news2/spool/news/08
/dev/da13      7.3T    6.6T     77G    99%    /news2/spool/news/09
/dev/da14      7.3T    6.6T     76G    99%    /news2/spool/news/10
/dev/da15      7.3T    6.6T     75G    99%    /news2/spool/news/11
/dev/da16      7.3T    6.6T     80G    99%    /news2/spool/news/12
/dev/da17      7.3T    6.6T     77G    99%    /news2/spool/news/13
/dev/da18      7.3T    6.6T     81G    99%    /news2/spool/news/14
/dev/da19      7.3T    6.6T     76G    99%    /news2/spool/news/15
/dev/da20      7.3T    6.6T     77G    99%    /news2/spool/news/16
/dev/da21      7.3T    6.6T     74G    99%    /news2/spool/news/17
/dev/da22      7.3T    6.6T     76G    99%    /news2/spool/news/18
/dev/da23      7.3T    6.6T     78G    99%    /news2/spool/news/19
/dev/da24      7.3T    6.6T     80G    99%    /news2/spool/news/20
/dev/da25      7.3T    6.6T     78G    99%    /news2/spool/news/21
/dev/da26      7.3T    6.6T     79G    99%    /news2/spool/news/22
/dev/da5       221G     35G    168G    18%    /news1
/dev/md0        40G     14G     22G    39%    /news3
| Incoming Feed (+ Top1000 #) | Accepted | %Acc | %Tot | Art/sec | Volume | %Vol | KB/art | Check | Ihave | Spam | TooOld | Rejs | Errs | ||
|---|---|---|---|---|---|---|---|---|---|---|---|---|---|---|---|
| 1 | feeder.ecngs.de | 5782571 | 90.75 | 91.38 | 66.93 | 3.58TB | 99.89 | 665.20 | 6371291 | 0 | 0 | 0 | 339 | 0 | |
| 2 | feeder2.ecngs.de | 545684 | 90.27 | 8.62 | 6.35 | 4.14GB | 0.11 | 7.96 | 604119 | 0 | 0 | 0 | 353 | 0 | |
| Total | 6328255 | 0.00 | 100.00 | 73.27 | 3.59TB | 100.00 | 608.53 | 6975410 | 0 | 0 | 0 | 692 | 0 | ||
 |
| Incoming Feed (+ Top1000 #) | Volume | %Vol | Kbps | Accepted | %Acc | %Tot | KB/art | Check | Ihave | Spam | TooOld | Rejs | Errs | ||
|---|---|---|---|---|---|---|---|---|---|---|---|---|---|---|---|
| 1 | feeder.ecngs.de | 3.58TB | 99.89 | 356164.67 | 5782571 | 90.75 | 91.38 | 665.20 | 6371291 | 0 | 0 | 0 | 339 | 0 | |
| 2 | feeder2.ecngs.de | 4.14GB | 0.11 | 404.04 | 545684 | 90.27 | 8.62 | 7.96 | 604119 | 0 | 0 | 0 | 353 | 0 | |
| Total | 3.59TB | 100.00 | 356568.71 | 6328255 | 0.00 | 100.00 | 608.53 | 6975410 | 0 | 0 | 0 | 692 | 0 | ||
 |
| Incoming Feed (+ Top1000 #) | Rej. Vol. | %Vol | Kbps | Accepted | %Acc | %Tot | KB/art | Check | Ihave | Spam | TooOld | Rejs | Errs | ||
|---|---|---|---|---|---|---|---|---|---|---|---|---|---|---|---|
| 1 | feeder.ecngs.de | 2.70MB | 52.36 | 0.26 | 5782571 | 90.75 | 91.38 | 665.20 | 6371291 | 0 | 0 | 0 | 339 | 0 | |
| 2 | feeder2.ecngs.de | 2.46MB | 47.64 | 0.23 | 545684 | 90.27 | 8.62 | 7.96 | 604119 | 0 | 0 | 0 | 353 | 0 | |
| Total | 5.16MB | 100.00 | 0.49 | 6328255 | 0.00 | 100.00 | 608.53 | 6975410 | 0 | 0 | 0 | 692 | 0 | ||
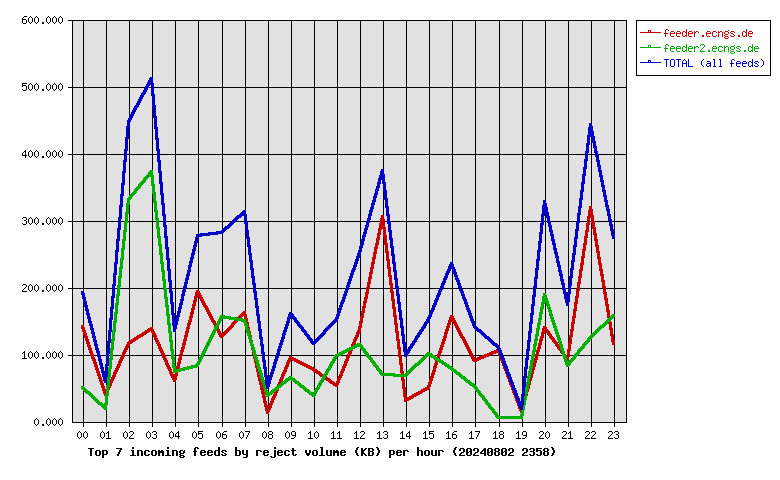 |
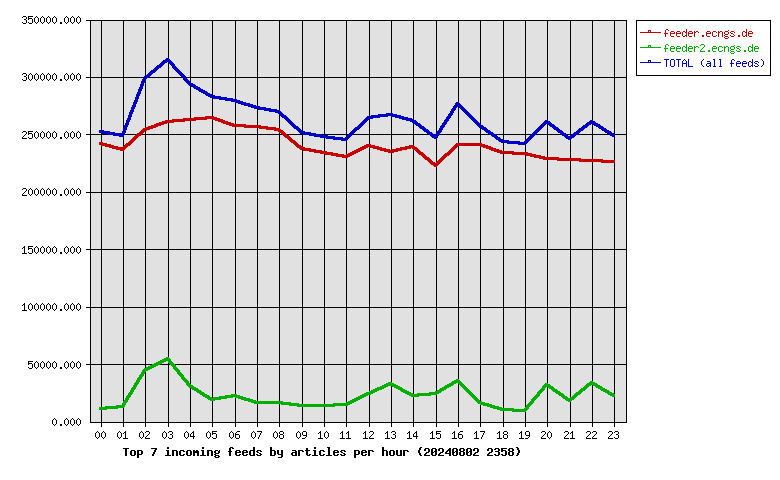
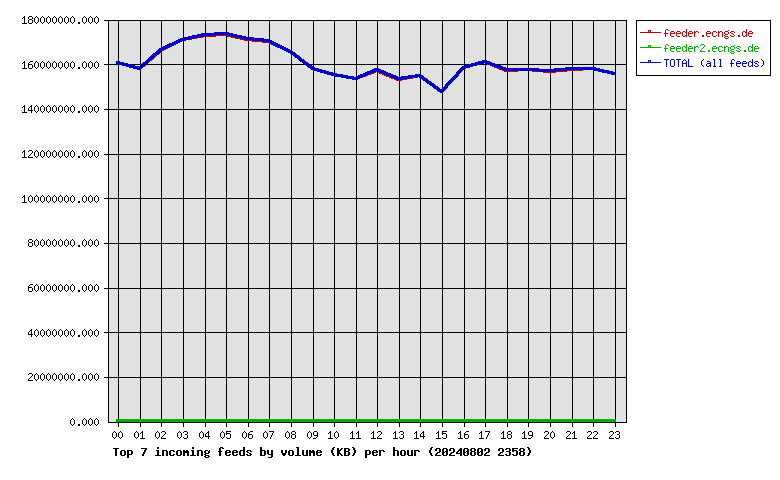
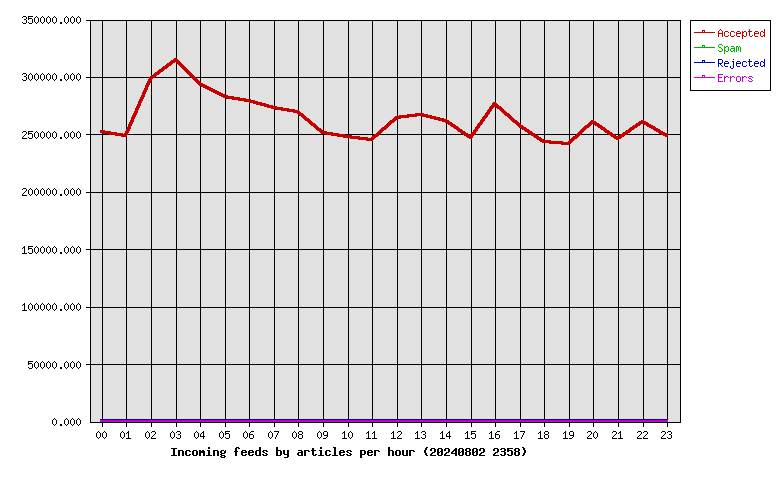
| Hour | Accepted | %Acc | Volume | %Vol | Check | Ihave | Spam | Rejs | Errs |
|---|---|---|---|---|---|---|---|---|---|
| 00 | 252438 | 3.99 | 153.17GB | 4.17 | 265146 | 0 | 0 | 16 | 0 |
| 01 | 248920 | 3.93 | 150.70GB | 4.10 | 263599 | 0 | 0 | 10 | 0 |
| 02 | 298436 | 4.72 | 158.70GB | 4.32 | 353180 | 0 | 0 | 62 | 0 |
| 03 | 314886 | 4.98 | 163.00GB | 4.44 | 371727 | 0 | 0 | 87 | 0 |
| 04 | 293845 | 4.64 | 164.88GB | 4.49 | 339167 | 0 | 0 | 48 | 0 |
| 05 | 282807 | 4.47 | 165.39GB | 4.50 | 311866 | 0 | 0 | 34 | 0 |
| 06 | 279248 | 4.41 | 163.20GB | 4.44 | 304706 | 0 | 0 | 42 | 0 |
| 07 | 272794 | 4.31 | 162.35GB | 4.42 | 291883 | 0 | 0 | 31 | 0 |
| 08 | 269846 | 4.26 | 157.90GB | 4.30 | 288526 | 0 | 0 | 11 | 0 |
| 09 | 250832 | 3.96 | 150.49GB | 4.10 | 266288 | 0 | 0 | 20 | 0 |
| 10 | 247458 | 3.91 | 147.95GB | 4.03 | 262997 | 0 | 0 | 11 | 0 |
| 11 | 244723 | 3.87 | 146.37GB | 3.99 | 261957 | 0 | 0 | 19 | 0 |
| 12 | 264018 | 4.17 | 149.95GB | 4.08 | 292558 | 0 | 0 | 31 | 0 |
| 13 | 266562 | 4.21 | 146.29GB | 3.98 | 303922 | 0 | 0 | 45 | 0 |
| 14 | 261564 | 4.13 | 147.53GB | 4.02 | 288694 | 0 | 0 | 12 | 0 |
| 15 | 246595 | 3.90 | 140.74GB | 3.83 | 269624 | 0 | 0 | 21 | 0 |
| 16 | 276090 | 4.36 | 151.15GB | 4.12 | 319552 | 0 | 0 | 31 | 0 |
| 17 | 256923 | 4.06 | 153.58GB | 4.18 | 274996 | 0 | 0 | 14 | 0 |
| 18 | 243462 | 3.85 | 149.90GB | 4.08 | 254600 | 0 | 0 | 6 | 0 |
| 19 | 241520 | 3.82 | 150.09GB | 4.09 | 251923 | 0 | 0 | 6 | 0 |
| 20 | 260597 | 4.12 | 149.47GB | 4.07 | 297786 | 0 | 0 | 42 | 0 |
| 21 | 245546 | 3.88 | 150.44GB | 4.10 | 266140 | 0 | 0 | 26 | 0 |
| 22 | 260365 | 4.11 | 150.71GB | 4.10 | 299486 | 0 | 0 | 46 | 0 |
| 23 | 248780 | 3.93 | 148.57GB | 4.05 | 275087 | 0 | 0 | 21 | 0 |
| Total | 6328255 | 100.00 | 3.59TB | 100.00 | 6975410 | 0 | 0 | 692 | 0 |
 |
| Outgoing Feed (+ Top1000 #) | Accepted | %Acc | %Tot | Art/sec | Volume | %Vol | KB/art | Dups | Rejs | % Ratio (Out/In) | ||
|---|---|---|---|---|---|---|---|---|---|---|---|---|
| 1 | 217.73.144.40 | 0 | 0.00 | 0.00 | 0.00 | 0.00KB | 0.00 | 0.00 | 6426252 | 0 | … | |
| Total | 0 | 0.00 | 0.00 | 0.00 | 0.00KB | 0.00 | 0.00 | 6426252 | 0 | |||
 |
| Outgoing Feed (+ Top1000 #) | Volume | %Vol | Kbps | Accepted | %Acc | %Tot | KB/art | Dups | Rejs | % Ratio (Out/In) | ||
|---|---|---|---|---|---|---|---|---|---|---|---|---|
| 1 | 217.73.144.40 | 0.00KB | 0.00 | 0.00 | 0 | 0.00 | 0.00 | 0.00 | 6426252 | 0 | … | |
| Total | 0.00KB | 0.00 | 0.00 | 0 | 0.00 | 0.00 | 0.00 | 6426252 | 0 | |||
 |
| Outgoing Feed (+ Top1000 #) | Rej. Vol. | %Vol | Kbps | Accepted | %Acc | %Tot | KB/art | Dups | Rejs | % Ratio (Out/In) | ||
|---|---|---|---|---|---|---|---|---|---|---|---|---|
| 1 | 217.73.144.40 | 0.00KB | 0.00 | 0.00 | 0 | 0.00 | 0.00 | 0.00 | 6426252 | 0 | … | |
| Total | 0.00KB | 0.00 | 0.00 | 0 | 0.00 | 0.00 | 0.00 | 6426252 | 0 | |||
 |
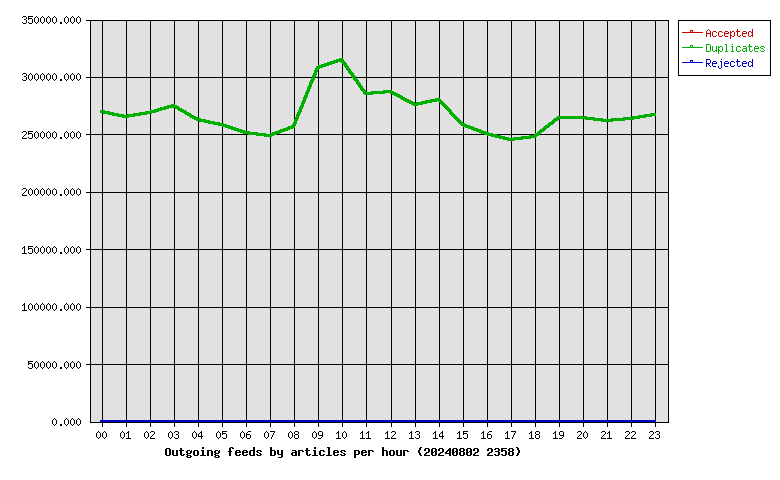
| Hour | Accepted | %Acc | Volume | %Vol | dups | Rejs |
|---|---|---|---|---|---|---|
| 00 | 0 | 0.00 | 0.00KB | 0.00 | 269054 | 0 |
| 01 | 0 | 0.00 | 0.00KB | 0.00 | 265488 | 0 |
| 02 | 0 | 0.00 | 0.00KB | 0.00 | 268340 | 0 |
| 03 | 0 | 0.00 | 0.00KB | 0.00 | 274796 | 0 |
| 04 | 0 | 0.00 | 0.00KB | 0.00 | 262590 | 0 |
| 05 | 0 | 0.00 | 0.00KB | 0.00 | 258388 | 0 |
| 06 | 0 | 0.00 | 0.00KB | 0.00 | 251042 | 0 |
| 07 | 0 | 0.00 | 0.00KB | 0.00 | 248644 | 0 |
| 08 | 0 | 0.00 | 0.00KB | 0.00 | 256397 | 0 |
| 09 | 0 | 0.00 | 0.00KB | 0.00 | 307395 | 0 |
| 10 | 0 | 0.00 | 0.00KB | 0.00 | 314959 | 0 |
| 11 | 0 | 0.00 | 0.00KB | 0.00 | 285148 | 0 |
| 12 | 0 | 0.00 | 0.00KB | 0.00 | 286532 | 0 |
| 13 | 0 | 0.00 | 0.00KB | 0.00 | 275964 | 0 |
| 14 | 0 | 0.00 | 0.00KB | 0.00 | 279923 | 0 |
| 15 | 0 | 0.00 | 0.00KB | 0.00 | 258157 | 0 |
| 16 | 0 | 0.00 | 0.00KB | 0.00 | 250367 | 0 |
| 17 | 0 | 0.00 | 0.00KB | 0.00 | 245396 | 0 |
| 18 | 0 | 0.00 | 0.00KB | 0.00 | 247517 | 0 |
| 19 | 0 | 0.00 | 0.00KB | 0.00 | 264354 | 0 |
| 20 | 0 | 0.00 | 0.00KB | 0.00 | 264189 | 0 |
| 21 | 0 | 0.00 | 0.00KB | 0.00 | 261442 | 0 |
| 22 | 0 | 0.00 | 0.00KB | 0.00 | 263259 | 0 |
| 23 | 0 | 0.00 | 0.00KB | 0.00 | 266911 | 0 |
| Total | 0 | 0.00 | 0.00KB | 0.00 | 6426252 | 0 |
 |
| >= 20% Full | >= 35% Full | >= 50% Full | >= 65% Full | >= 80% Full | >= 95% Full |
| Outgoing Feed | Batch Seq | Batch Num | Batch Max | %Full | Av. Pending |
|---|---|---|---|---|---|
| nbr.elbracht.net-o | 974527-974608 | 81 | 500 | 16 | 0.0 |
| text-spool-out | 0-0 | 0 | 500 | 0 | 0.0 |
| 1st Time | Last Time | # Msgs | Message |
|---|---|---|---|
| 22:14:22 | 1 | DNS Fwd/Rev mismatch: internettl.org/104.152.52.205 | |
| 22:14:44 | 1 | DNS Fwd/Rev mismatch: internettl.org/104.152.52.124 |