| |
DIABLO statistics for newsfeed.yoursite.com on Thu 01 Aug 2024 |
Generated on 20240801 2358 by feeder-stats v4.006. Copyright © 2002 The Diablo Project.
Diablo running processes:  81    Dnewslink running processes:  0


11:59PM  up 165 days,  7:18, 0 users, load averages: 2.67, 1.50, 1.07

Filesystem     Size    Used   Avail Capacity  Mounted on
/dev/da0s1g     94G    1.2G     85G     1%    /news
/dev/da1       7.3T    6.6T     69G    99%    /news2/spool/news/00
/dev/da2       7.3T    6.6T     66G    99%    /news2/spool/news/01
/dev/da3       3.7T    3.2T    124G    96%    /news2/spool/news/02
/dev/da4       5.5T      5T     84G    98%    /news2/spool/news/03
/dev/da8       7.3T    6.6T     68G    99%    /news2/spool/news/04
/dev/da9       7.3T    6.6T     66G    99%    /news2/spool/news/05
/dev/da10      7.3T    6.6T     66G    99%    /news2/spool/news/06
/dev/da11      5.5T      5T     77G    98%    /news2/spool/news/07
/dev/da12      5.5T      5T     88G    98%    /news2/spool/news/08
/dev/da13      7.3T    6.6T     65G    99%    /news2/spool/news/09
/dev/da14      7.3T    6.6T     64G    99%    /news2/spool/news/10
/dev/da15      7.3T    6.6T     63G    99%    /news2/spool/news/11
/dev/da16      7.3T    6.6T     68G    99%    /news2/spool/news/12
/dev/da17      7.3T    6.6T     65G    99%    /news2/spool/news/13
/dev/da18      7.3T    6.6T     68G    99%    /news2/spool/news/14
/dev/da19      7.3T    6.6T     64G    99%    /news2/spool/news/15
/dev/da20      7.3T    6.6T     65G    99%    /news2/spool/news/16
/dev/da21      7.3T    6.6T    121G    98%    /news2/spool/news/17
/dev/da22      7.3T    6.6T     64G    99%    /news2/spool/news/18
/dev/da23      7.3T    6.6T     66G    99%    /news2/spool/news/19
/dev/da24      7.3T    6.6T     67G    99%    /news2/spool/news/20
/dev/da25      7.3T    6.6T     66G    99%    /news2/spool/news/21
/dev/da26      7.3T    6.6T     67G    99%    /news2/spool/news/22
/dev/da5       221G     35G    168G    18%    /news1
/dev/md0        40G     14G     22G    39%    /news3
| Incoming Feed (+ Top1000 #) | Accepted | %Acc | %Tot | Art/sec | Volume | %Vol | KB/art | Check | Ihave | Spam | TooOld | Rejs | Errs | ||
|---|---|---|---|---|---|---|---|---|---|---|---|---|---|---|---|
| 1 | feeder.ecngs.de | 5721343 | 91.36 | 91.79 | 66.22 | 3.54TB | 99.89 | 664.33 | 6261989 | 0 | 0 | 0 | 300 | 0 | |
| 2 | feeder2.ecngs.de | 511503 | 91.28 | 8.21 | 5.92 | 4.15GB | 0.11 | 8.51 | 560108 | 0 | 0 | 0 | 260 | 0 | |
| Total | 6232846 | 0.00 | 100.00 | 72.14 | 3.54TB | 100.00 | 610.51 | 6822097 | 0 | 0 | 0 | 560 | 0 | ||
 |
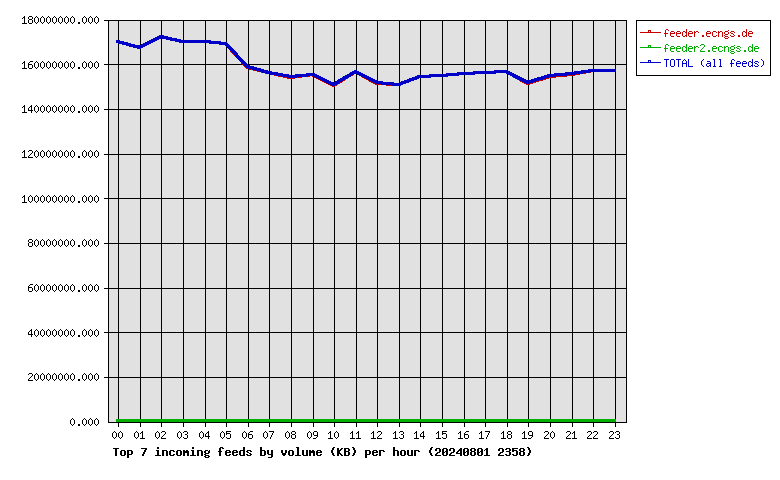
| Incoming Feed (+ Top1000 #) | Volume | %Vol | Kbps | Accepted | %Acc | %Tot | KB/art | Check | Ihave | Spam | TooOld | Rejs | Errs | ||
|---|---|---|---|---|---|---|---|---|---|---|---|---|---|---|---|
| 1 | feeder.ecngs.de | 3.54TB | 99.89 | 351931.78 | 5721343 | 91.36 | 91.79 | 664.33 | 6261989 | 0 | 0 | 0 | 300 | 0 | |
| 2 | feeder2.ecngs.de | 4.15GB | 0.11 | 403.22 | 511503 | 91.28 | 8.21 | 8.51 | 560108 | 0 | 0 | 0 | 260 | 0 | |
| Total | 3.54TB | 100.00 | 352335.00 | 6232846 | 0.00 | 100.00 | 610.51 | 6822097 | 0 | 0 | 0 | 560 | 0 | ||
 |
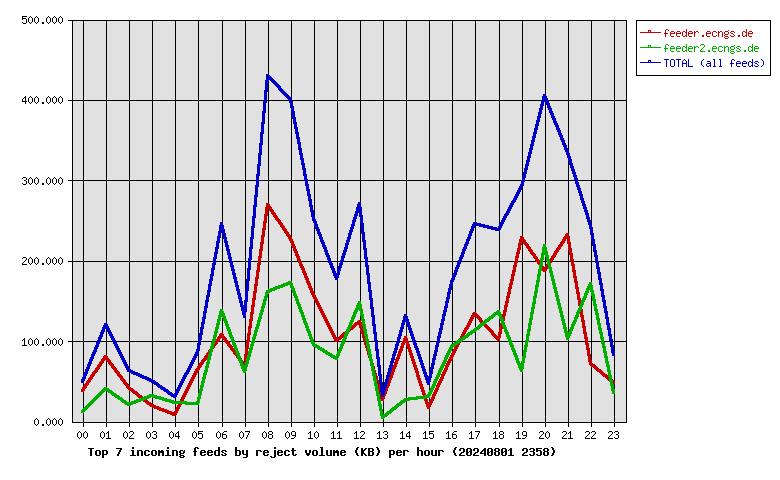
| Incoming Feed (+ Top1000 #) | Rej. Vol. | %Vol | Kbps | Accepted | %Acc | %Tot | KB/art | Check | Ihave | Spam | TooOld | Rejs | Errs | ||
|---|---|---|---|---|---|---|---|---|---|---|---|---|---|---|---|
| 1 | feeder.ecngs.de | 2.47MB | 55.89 | 0.23 | 5721343 | 91.36 | 91.79 | 664.33 | 6261989 | 0 | 0 | 0 | 300 | 0 | |
| 2 | feeder2.ecngs.de | 1.95MB | 44.11 | 0.18 | 511503 | 91.28 | 8.21 | 8.51 | 560108 | 0 | 0 | 0 | 260 | 0 | |
| Total | 4.42MB | 100.00 | 0.42 | 6232846 | 0.00 | 100.00 | 610.51 | 6822097 | 0 | 0 | 0 | 560 | 0 | ||
 |
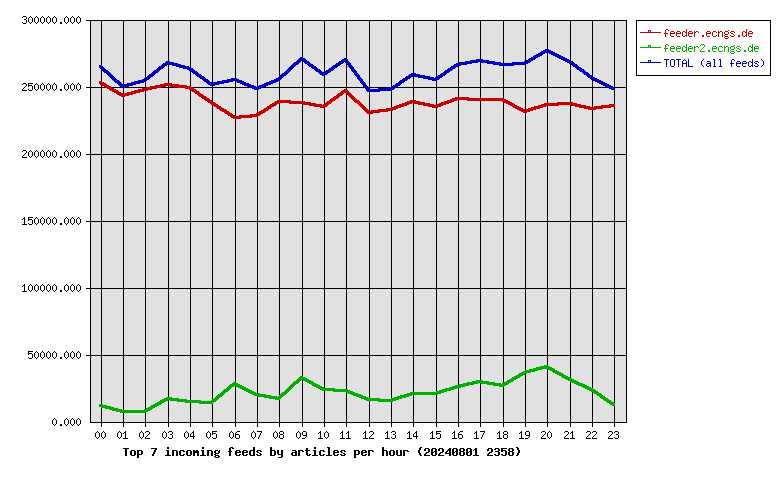
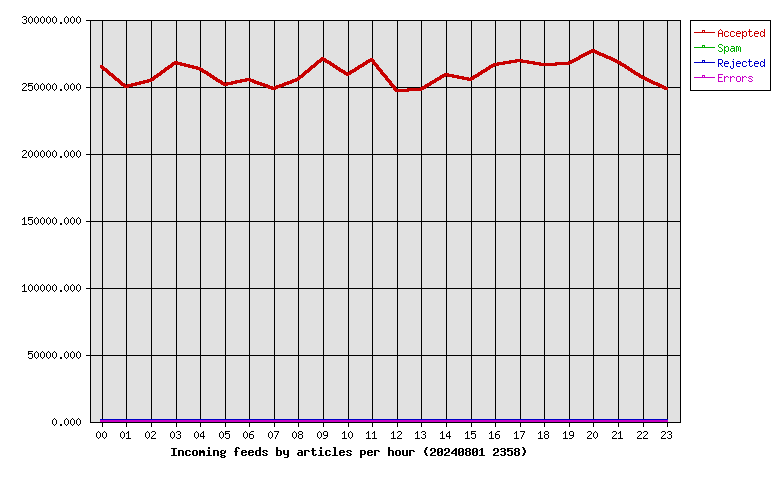
| Hour | Accepted | %Acc | Volume | %Vol | Check | Ihave | Spam | Rejs | Errs |
|---|---|---|---|---|---|---|---|---|---|
| 00 | 264740 | 4.25 | 161.95GB | 4.46 | 278396 | 0 | 0 | 13 | 0 |
| 01 | 249929 | 4.01 | 159.37GB | 4.39 | 258540 | 0 | 0 | 13 | 0 |
| 02 | 254037 | 4.08 | 164.35GB | 4.53 | 261690 | 0 | 0 | 9 | 0 |
| 03 | 267731 | 4.30 | 162.16GB | 4.47 | 284242 | 0 | 0 | 8 | 0 |
| 04 | 263220 | 4.22 | 162.01GB | 4.46 | 281745 | 0 | 0 | 9 | 0 |
| 05 | 251235 | 4.03 | 161.17GB | 4.44 | 270391 | 0 | 0 | 11 | 0 |
| 06 | 254720 | 4.09 | 151.32GB | 4.17 | 286651 | 0 | 0 | 31 | 0 |
| 07 | 247806 | 3.98 | 148.95GB | 4.10 | 270577 | 0 | 0 | 21 | 0 |
| 08 | 254553 | 4.08 | 146.90GB | 4.05 | 273132 | 0 | 0 | 30 | 0 |
| 09 | 270566 | 4.34 | 148.13GB | 4.08 | 308102 | 0 | 0 | 43 | 0 |
| 10 | 258350 | 4.14 | 143.61GB | 3.96 | 285758 | 0 | 0 | 39 | 0 |
| 11 | 269616 | 4.33 | 149.39GB | 4.12 | 295382 | 0 | 0 | 23 | 0 |
| 12 | 246784 | 3.96 | 144.46GB | 3.98 | 264270 | 0 | 0 | 25 | 0 |
| 13 | 247690 | 3.97 | 143.73GB | 3.96 | 265108 | 0 | 0 | 5 | 0 |
| 14 | 258549 | 4.15 | 147.15GB | 4.05 | 281397 | 0 | 0 | 14 | 0 |
| 15 | 254956 | 4.09 | 147.66GB | 4.07 | 275037 | 0 | 0 | 4 | 0 |
| 16 | 266331 | 4.27 | 148.46GB | 4.09 | 299011 | 0 | 0 | 33 | 0 |
| 17 | 269316 | 4.32 | 148.97GB | 4.10 | 303739 | 0 | 0 | 42 | 0 |
| 18 | 266309 | 4.27 | 149.35GB | 4.12 | 296956 | 0 | 0 | 26 | 0 |
| 19 | 267159 | 4.29 | 144.54GB | 3.98 | 308400 | 0 | 0 | 28 | 0 |
| 20 | 276638 | 4.44 | 147.57GB | 4.07 | 323137 | 0 | 0 | 60 | 0 |
| 21 | 267924 | 4.30 | 148.19GB | 4.08 | 303788 | 0 | 0 | 34 | 0 |
| 22 | 256627 | 4.12 | 149.70GB | 4.13 | 283623 | 0 | 0 | 30 | 0 |
| 23 | 248060 | 3.98 | 149.88GB | 4.13 | 263025 | 0 | 0 | 9 | 0 |
| Total | 6232846 | 100.00 | 3.54TB | 100.00 | 6822097 | 0 | 0 | 560 | 0 |
 |
| Outgoing Feed (+ Top1000 #) | Accepted | %Acc | %Tot | Art/sec | Volume | %Vol | KB/art | Dups | Rejs | % Ratio (Out/In) | ||
|---|---|---|---|---|---|---|---|---|---|---|---|---|
| 1 | 217.73.144.40 | 0 | 0.00 | 0.00 | 0.00 | 0.00KB | 0.00 | 0.00 | 6237256 | 0 | … | |
| Total | 0 | 0.00 | 0.00 | 0.00 | 0.00KB | 0.00 | 0.00 | 6237256 | 0 | |||
 |
| Outgoing Feed (+ Top1000 #) | Volume | %Vol | Kbps | Accepted | %Acc | %Tot | KB/art | Dups | Rejs | % Ratio (Out/In) | ||
|---|---|---|---|---|---|---|---|---|---|---|---|---|
| 1 | 217.73.144.40 | 0.00KB | 0.00 | 0.00 | 0 | 0.00 | 0.00 | 0.00 | 6237256 | 0 | … | |
| Total | 0.00KB | 0.00 | 0.00 | 0 | 0.00 | 0.00 | 0.00 | 6237256 | 0 | |||
 |
| Outgoing Feed (+ Top1000 #) | Rej. Vol. | %Vol | Kbps | Accepted | %Acc | %Tot | KB/art | Dups | Rejs | % Ratio (Out/In) | ||
|---|---|---|---|---|---|---|---|---|---|---|---|---|
| 1 | 217.73.144.40 | 0.00KB | 0.00 | 0.00 | 0 | 0.00 | 0.00 | 0.00 | 6237256 | 0 | … | |
| Total | 0.00KB | 0.00 | 0.00 | 0 | 0.00 | 0.00 | 0.00 | 6237256 | 0 | |||
 |
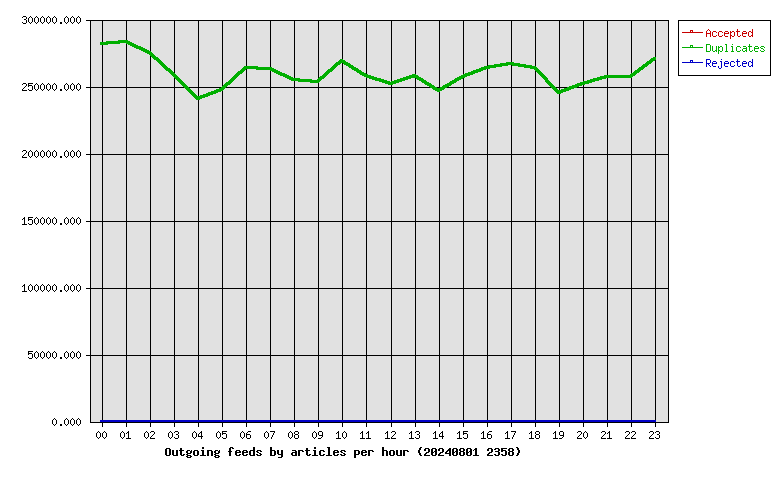
| Hour | Accepted | %Acc | Volume | %Vol | dups | Rejs |
|---|---|---|---|---|---|---|
| 00 | 0 | 0.00 | 0.00KB | 0.00 | 282035 | 0 |
| 01 | 0 | 0.00 | 0.00KB | 0.00 | 282985 | 0 |
| 02 | 0 | 0.00 | 0.00KB | 0.00 | 275006 | 0 |
| 03 | 0 | 0.00 | 0.00KB | 0.00 | 258324 | 0 |
| 04 | 0 | 0.00 | 0.00KB | 0.00 | 240340 | 0 |
| 05 | 0 | 0.00 | 0.00KB | 0.00 | 247423 | 0 |
| 06 | 0 | 0.00 | 0.00KB | 0.00 | 263949 | 0 |
| 07 | 0 | 0.00 | 0.00KB | 0.00 | 263367 | 0 |
| 08 | 0 | 0.00 | 0.00KB | 0.00 | 254932 | 0 |
| 09 | 0 | 0.00 | 0.00KB | 0.00 | 253142 | 0 |
| 10 | 0 | 0.00 | 0.00KB | 0.00 | 269314 | 0 |
| 11 | 0 | 0.00 | 0.00KB | 0.00 | 257676 | 0 |
| 12 | 0 | 0.00 | 0.00KB | 0.00 | 251550 | 0 |
| 13 | 0 | 0.00 | 0.00KB | 0.00 | 257648 | 0 |
| 14 | 0 | 0.00 | 0.00KB | 0.00 | 246946 | 0 |
| 15 | 0 | 0.00 | 0.00KB | 0.00 | 257003 | 0 |
| 16 | 0 | 0.00 | 0.00KB | 0.00 | 264054 | 0 |
| 17 | 0 | 0.00 | 0.00KB | 0.00 | 266721 | 0 |
| 18 | 0 | 0.00 | 0.00KB | 0.00 | 264125 | 0 |
| 19 | 0 | 0.00 | 0.00KB | 0.00 | 244814 | 0 |
| 20 | 0 | 0.00 | 0.00KB | 0.00 | 251540 | 0 |
| 21 | 0 | 0.00 | 0.00KB | 0.00 | 257062 | 0 |
| 22 | 0 | 0.00 | 0.00KB | 0.00 | 256832 | 0 |
| 23 | 0 | 0.00 | 0.00KB | 0.00 | 270468 | 0 |
| Total | 0 | 0.00 | 0.00KB | 0.00 | 6237256 | 0 |
 |
| >= 20% Full | >= 35% Full | >= 50% Full | >= 65% Full | >= 80% Full | >= 95% Full |
| Outgoing Feed | Batch Seq | Batch Num | Batch Max | %Full | Av. Pending |
|---|---|---|---|---|---|
| nbr.elbracht.net-o | 974239-974320 | 81 | 500 | 16 | 0.0 |
| text-spool-out | 0-0 | 0 | 500 | 0 | 0.0 |
| 1st Time | Last Time | # Msgs | Message |
|---|