| |
DIABLO statistics for newsfeed.yoursite.com on Wed 31 Jul 2024 |
Generated on 20240731 2358 by feeder-stats v4.006. Copyright © 2002 The Diablo Project.
Diablo running processes:  81    Dnewslink running processes:  0


11:59PM  up 164 days,  7:18, 0 users, load averages: 1.06, 0.70, 0.60

Filesystem     Size    Used   Avail Capacity  Mounted on
/dev/da0s1g     94G    1.2G     85G     1%    /news
/dev/da1       7.3T    6.6T     72G    99%    /news2/spool/news/00
/dev/da2       7.3T    6.6T     70G    99%    /news2/spool/news/01
/dev/da3       3.7T    3.2T    104G    97%    /news2/spool/news/02
/dev/da4       5.5T      5T     83G    98%    /news2/spool/news/03
/dev/da8       7.3T    6.6T     72G    99%    /news2/spool/news/04
/dev/da9       7.3T    6.6T     69G    99%    /news2/spool/news/05
/dev/da10      7.3T    6.6T     69G    99%    /news2/spool/news/06
/dev/da11      5.5T      5T     66G    99%    /news2/spool/news/07
/dev/da12      5.5T      5T     91G    98%    /news2/spool/news/08
/dev/da13      7.3T    6.6T     67G    99%    /news2/spool/news/09
/dev/da14      7.3T    6.6T     66G    99%    /news2/spool/news/10
/dev/da15      7.3T    6.6T     66G    99%    /news2/spool/news/11
/dev/da16      7.3T    6.6T     71G    99%    /news2/spool/news/12
/dev/da17      7.3T    6.6T     68G    99%    /news2/spool/news/13
/dev/da18      7.3T    6.6T     71G    99%    /news2/spool/news/14
/dev/da19      7.3T    6.6T     67G    99%    /news2/spool/news/15
/dev/da20      7.3T    6.6T     68G    99%    /news2/spool/news/16
/dev/da21      7.3T    6.6T     65G    99%    /news2/spool/news/17
/dev/da22      7.3T    6.6T     68G    99%    /news2/spool/news/18
/dev/da23      7.3T    6.6T     69G    99%    /news2/spool/news/19
/dev/da24      7.3T    6.6T     70G    99%    /news2/spool/news/20
/dev/da25      7.3T    6.6T     69G    99%    /news2/spool/news/21
/dev/da26      7.3T    6.6T     70G    99%    /news2/spool/news/22
/dev/da5       221G     35G    168G    18%    /news1
/dev/md0        40G     14G     22G    39%    /news3
| Incoming Feed (+ Top1000 #) | Accepted | %Acc | %Tot | Art/sec | Volume | %Vol | KB/art | Check | Ihave | Spam | TooOld | Rejs | Errs | ||
|---|---|---|---|---|---|---|---|---|---|---|---|---|---|---|---|
| 1 | feeder.ecngs.de | 6151035 | 93.37 | 93.86 | 71.19 | 3.73TB | 99.91 | 651.34 | 6587266 | 0 | 0 | 0 | 224 | 0 | |
| 2 | feeder2.ecngs.de | 402423 | 91.52 | 6.14 | 4.66 | 3.56GB | 0.09 | 9.28 | 439475 | 0 | 0 | 0 | 232 | 0 | |
| Total | 6553458 | 0.00 | 100.00 | 75.85 | 3.73TB | 100.00 | 611.92 | 7026741 | 0 | 0 | 0 | 456 | 0 | ||
 |
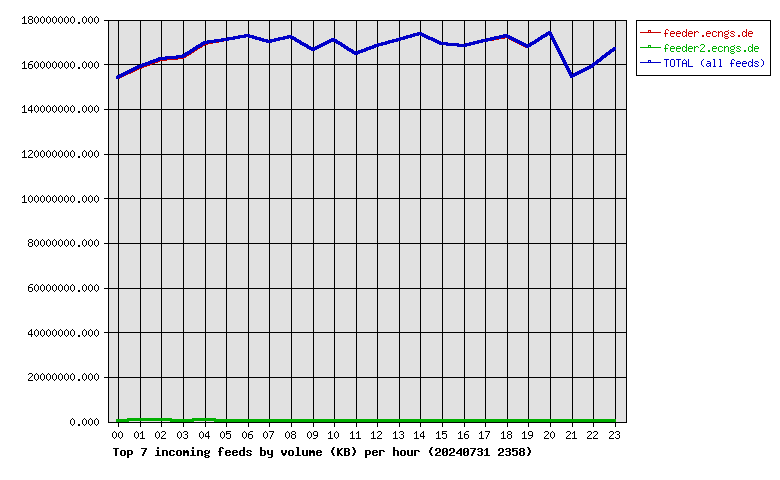
| Incoming Feed (+ Top1000 #) | Volume | %Vol | Kbps | Accepted | %Acc | %Tot | KB/art | Check | Ihave | Spam | TooOld | Rejs | Errs | ||
|---|---|---|---|---|---|---|---|---|---|---|---|---|---|---|---|
| 1 | feeder.ecngs.de | 3.73TB | 99.91 | 370967.15 | 6151035 | 93.37 | 93.86 | 651.34 | 6587266 | 0 | 0 | 0 | 224 | 0 | |
| 2 | feeder2.ecngs.de | 3.56GB | 0.09 | 345.97 | 402423 | 91.52 | 6.14 | 9.28 | 439475 | 0 | 0 | 0 | 232 | 0 | |
| Total | 3.73TB | 100.00 | 371313.12 | 6553458 | 0.00 | 100.00 | 611.92 | 7026741 | 0 | 0 | 0 | 456 | 0 | ||
 |
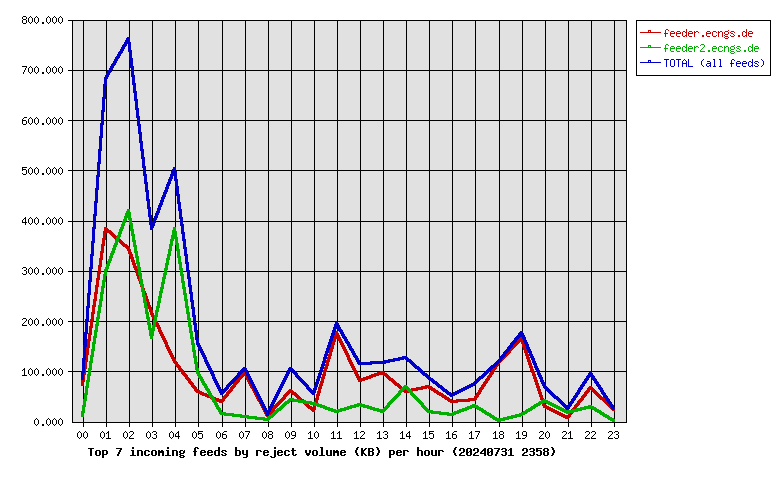
| Incoming Feed (+ Top1000 #) | Rej. Vol. | %Vol | Kbps | Accepted | %Acc | %Tot | KB/art | Check | Ihave | Spam | TooOld | Rejs | Errs | ||
|---|---|---|---|---|---|---|---|---|---|---|---|---|---|---|---|
| 1 | feeder.ecngs.de | 2.33MB | 57.23 | 0.22 | 6151035 | 93.37 | 93.86 | 651.34 | 6587266 | 0 | 0 | 0 | 224 | 0 | |
| 2 | feeder2.ecngs.de | 1.74MB | 42.77 | 0.17 | 402423 | 91.52 | 6.14 | 9.28 | 439475 | 0 | 0 | 0 | 232 | 0 | |
| Total | 4.07MB | 100.00 | 0.39 | 6553458 | 0.00 | 100.00 | 611.92 | 7026741 | 0 | 0 | 0 | 456 | 0 | ||
 |
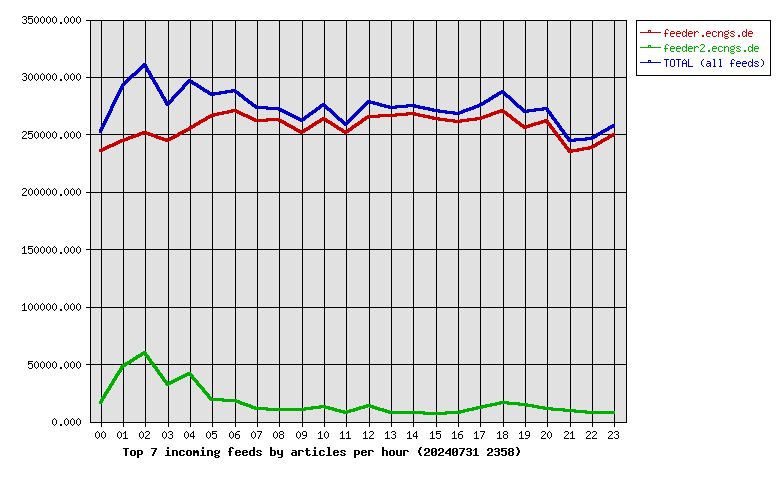
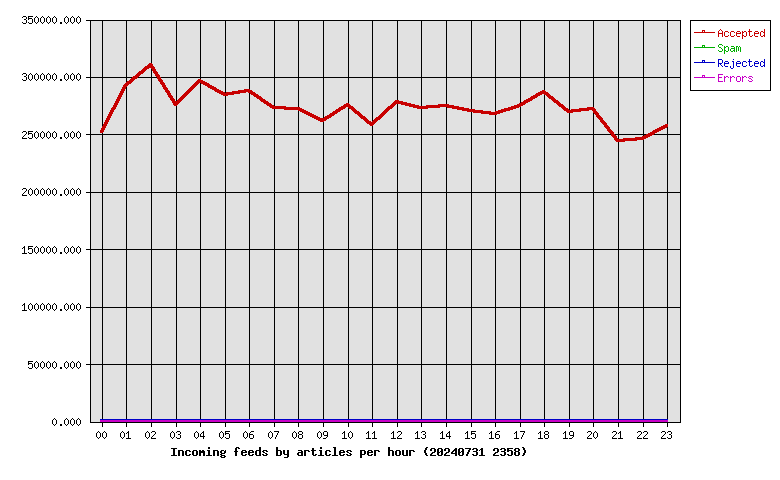
| Hour | Accepted | %Acc | Volume | %Vol | Check | Ihave | Spam | Rejs | Errs |
|---|---|---|---|---|---|---|---|---|---|
| 00 | 251841 | 3.84 | 146.76GB | 3.84 | 271275 | 0 | 0 | 8 | 0 |
| 01 | 291706 | 4.45 | 151.32GB | 3.96 | 346571 | 0 | 0 | 65 | 0 |
| 02 | 310184 | 4.73 | 154.86GB | 4.05 | 379130 | 0 | 0 | 98 | 0 |
| 03 | 275800 | 4.21 | 155.54GB | 4.07 | 311260 | 0 | 0 | 22 | 0 |
| 04 | 296502 | 4.52 | 161.71GB | 4.23 | 345910 | 0 | 0 | 50 | 0 |
| 05 | 284414 | 4.34 | 162.86GB | 4.26 | 319080 | 0 | 0 | 33 | 0 |
| 06 | 287807 | 4.39 | 164.77GB | 4.31 | 307689 | 0 | 0 | 10 | 0 |
| 07 | 273128 | 4.17 | 162.19GB | 4.24 | 285516 | 0 | 0 | 7 | 0 |
| 08 | 271880 | 4.15 | 164.26GB | 4.30 | 282607 | 0 | 0 | 4 | 0 |
| 09 | 261313 | 3.99 | 158.73GB | 4.15 | 272922 | 0 | 0 | 12 | 0 |
| 10 | 275853 | 4.21 | 162.97GB | 4.26 | 290405 | 0 | 0 | 10 | 0 |
| 11 | 258457 | 3.94 | 157.04GB | 4.11 | 266942 | 0 | 0 | 13 | 0 |
| 12 | 278214 | 4.25 | 160.36GB | 4.19 | 292300 | 0 | 0 | 22 | 0 |
| 13 | 272819 | 4.16 | 162.97GB | 4.26 | 280690 | 0 | 0 | 9 | 0 |
| 14 | 274737 | 4.19 | 165.56GB | 4.33 | 282769 | 0 | 0 | 12 | 0 |
| 15 | 269946 | 4.12 | 161.10GB | 4.21 | 276451 | 0 | 0 | 9 | 0 |
| 16 | 267728 | 4.09 | 160.38GB | 4.19 | 276939 | 0 | 0 | 11 | 0 |
| 17 | 274952 | 4.20 | 162.62GB | 4.25 | 288056 | 0 | 0 | 8 | 0 |
| 18 | 286571 | 4.37 | 164.41GB | 4.30 | 304856 | 0 | 0 | 10 | 0 |
| 19 | 269890 | 4.12 | 160.07GB | 4.19 | 286386 | 0 | 0 | 16 | 0 |
| 20 | 272255 | 4.15 | 165.87GB | 4.34 | 283956 | 0 | 0 | 10 | 0 |
| 21 | 244119 | 3.73 | 147.16GB | 3.85 | 254440 | 0 | 0 | 4 | 0 |
| 22 | 246237 | 3.76 | 151.95GB | 3.97 | 254982 | 0 | 0 | 9 | 0 |
| 23 | 257105 | 3.92 | 158.96GB | 4.16 | 265609 | 0 | 0 | 4 | 0 |
| Total | 6553458 | 100.00 | 3.73TB | 100.00 | 7026741 | 0 | 0 | 456 | 0 |
 |
| Outgoing Feed (+ Top1000 #) | Accepted | %Acc | %Tot | Art/sec | Volume | %Vol | KB/art | Dups | Rejs | % Ratio (Out/In) | ||
|---|---|---|---|---|---|---|---|---|---|---|---|---|
| 1 | 217.73.144.40 | 0 | 0.00 | 0.00 | 0.00 | 0.00KB | 0.00 | 0.00 | 6510063 | 0 | … | |
| Total | 0 | 0.00 | 0.00 | 0.00 | 0.00KB | 0.00 | 0.00 | 6510063 | 0 | |||
 |
| Outgoing Feed (+ Top1000 #) | Volume | %Vol | Kbps | Accepted | %Acc | %Tot | KB/art | Dups | Rejs | % Ratio (Out/In) | ||
|---|---|---|---|---|---|---|---|---|---|---|---|---|
| 1 | 217.73.144.40 | 0.00KB | 0.00 | 0.00 | 0 | 0.00 | 0.00 | 0.00 | 6510063 | 0 | … | |
| Total | 0.00KB | 0.00 | 0.00 | 0 | 0.00 | 0.00 | 0.00 | 6510063 | 0 | |||
 |
| Outgoing Feed (+ Top1000 #) | Rej. Vol. | %Vol | Kbps | Accepted | %Acc | %Tot | KB/art | Dups | Rejs | % Ratio (Out/In) | ||
|---|---|---|---|---|---|---|---|---|---|---|---|---|
| 1 | 217.73.144.40 | 0.00KB | 0.00 | 0.00 | 0 | 0.00 | 0.00 | 0.00 | 6510063 | 0 | … | |
| Total | 0.00KB | 0.00 | 0.00 | 0 | 0.00 | 0.00 | 0.00 | 6510063 | 0 | |||
 |
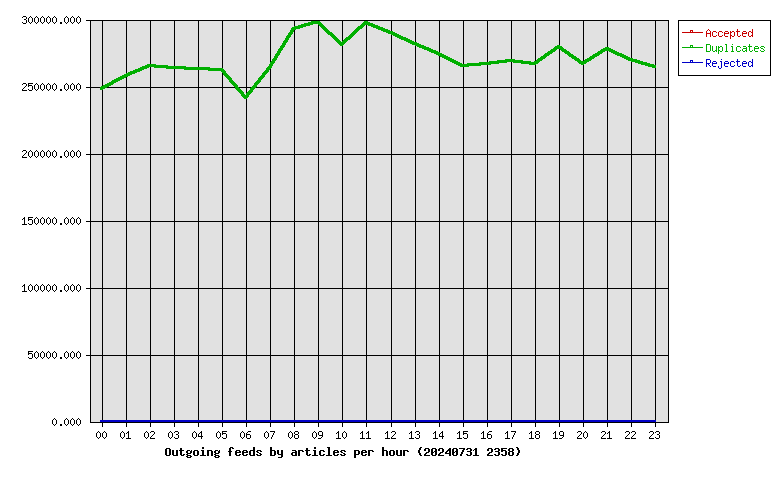
| Hour | Accepted | %Acc | Volume | %Vol | dups | Rejs |
|---|---|---|---|---|---|---|
| 00 | 0 | 0.00 | 0.00KB | 0.00 | 248334 | 0 |
| 01 | 0 | 0.00 | 0.00KB | 0.00 | 257476 | 0 |
| 02 | 0 | 0.00 | 0.00KB | 0.00 | 265529 | 0 |
| 03 | 0 | 0.00 | 0.00KB | 0.00 | 263513 | 0 |
| 04 | 0 | 0.00 | 0.00KB | 0.00 | 263127 | 0 |
| 05 | 0 | 0.00 | 0.00KB | 0.00 | 262169 | 0 |
| 06 | 0 | 0.00 | 0.00KB | 0.00 | 241441 | 0 |
| 07 | 0 | 0.00 | 0.00KB | 0.00 | 264012 | 0 |
| 08 | 0 | 0.00 | 0.00KB | 0.00 | 293260 | 0 |
| 09 | 0 | 0.00 | 0.00KB | 0.00 | 298369 | 0 |
| 10 | 0 | 0.00 | 0.00KB | 0.00 | 281128 | 0 |
| 11 | 0 | 0.00 | 0.00KB | 0.00 | 297565 | 0 |
| 12 | 0 | 0.00 | 0.00KB | 0.00 | 290226 | 0 |
| 13 | 0 | 0.00 | 0.00KB | 0.00 | 281814 | 0 |
| 14 | 0 | 0.00 | 0.00KB | 0.00 | 274544 | 0 |
| 15 | 0 | 0.00 | 0.00KB | 0.00 | 265143 | 0 |
| 16 | 0 | 0.00 | 0.00KB | 0.00 | 266991 | 0 |
| 17 | 0 | 0.00 | 0.00KB | 0.00 | 268787 | 0 |
| 18 | 0 | 0.00 | 0.00KB | 0.00 | 266656 | 0 |
| 19 | 0 | 0.00 | 0.00KB | 0.00 | 279709 | 0 |
| 20 | 0 | 0.00 | 0.00KB | 0.00 | 266994 | 0 |
| 21 | 0 | 0.00 | 0.00KB | 0.00 | 278310 | 0 |
| 22 | 0 | 0.00 | 0.00KB | 0.00 | 270119 | 0 |
| 23 | 0 | 0.00 | 0.00KB | 0.00 | 264847 | 0 |
| Total | 0 | 0.00 | 0.00KB | 0.00 | 6510063 | 0 |
 |
| >= 20% Full | >= 35% Full | >= 50% Full | >= 65% Full | >= 80% Full | >= 95% Full |
| Outgoing Feed | Batch Seq | Batch Num | Batch Max | %Full | Av. Pending |
|---|---|---|---|---|---|
| nbr.elbracht.net-o | 973951-974032 | 81 | 500 | 16 | 0.0 |
| text-spool-out | 0-0 | 0 | 500 | 0 | 0.0 |
| 1st Time | Last Time | # Msgs | Message |
|---|